Market Reversal Alerts
- Indicators
-
Lee Samson
 Have been trading since 1998, started in stocks and indices before moving over to Forex after around 5 years. Have been on the journey learning to trade like most traders, taking countless courses and trying every indicator and strategy under the sun.
 - Version: 5.10
- Updated: 12 November 2021
- Activations: 20
Profit from market structure changes as price reverses and pulls back. The Market Reversal Alerts indicator identifies when a trend or extended price move is approaching exhaustion, alerts you the moment market structure shifts, and confirms the entry when price re-tests the reversal zone, so you trade defined areas instead of guesses.
How it works
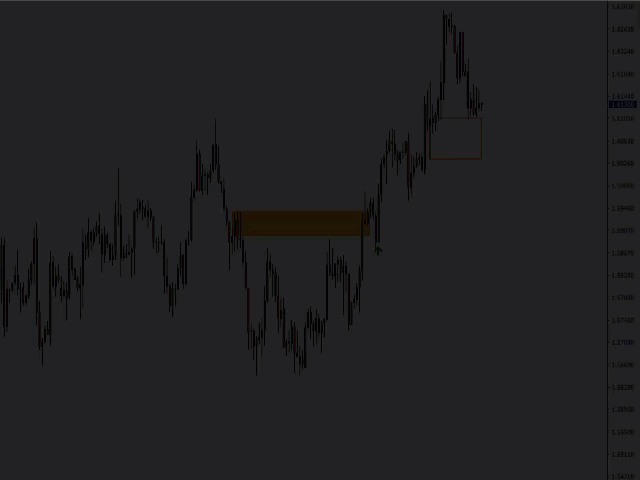
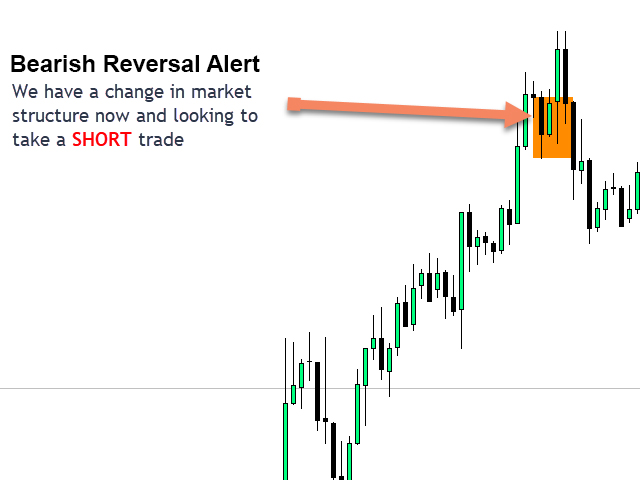
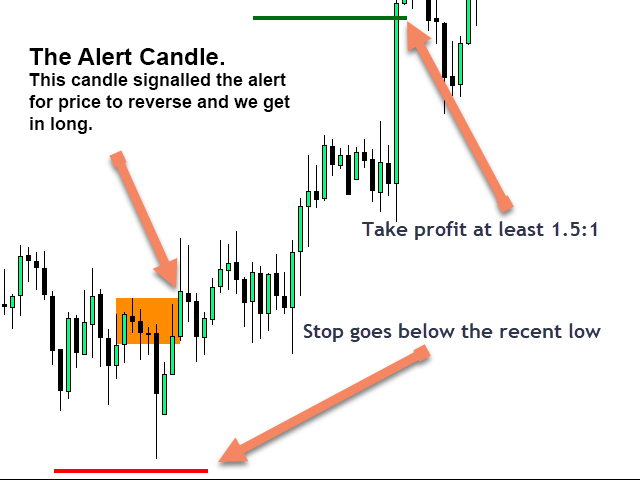
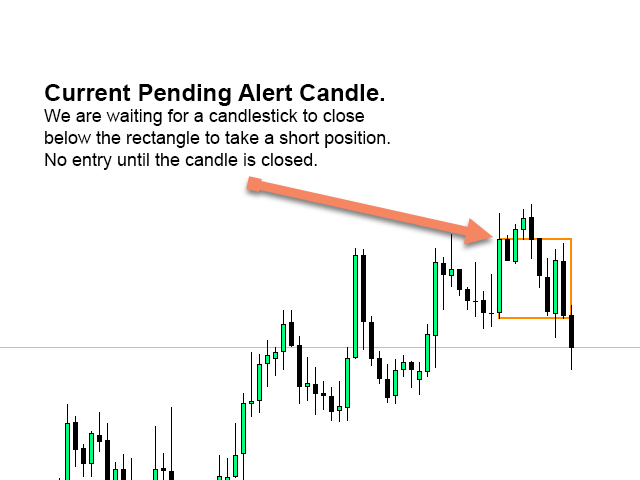
As price forms new highs or lows near potential exhaustion points, the indicator identifies the breakout and momentum, then draws a rectangle on the last opposite-coloured candle, the short-term structure that the current move is standing on. It trails that rectangle along behind price as the trend continues, always tracking the tightest structure level in play. When price weakens enough to close back through the rectangle, that is a shift in market structure: the point where reversals and major pullbacks begin. The rectangle changes to a solid block, and you receive an alert.
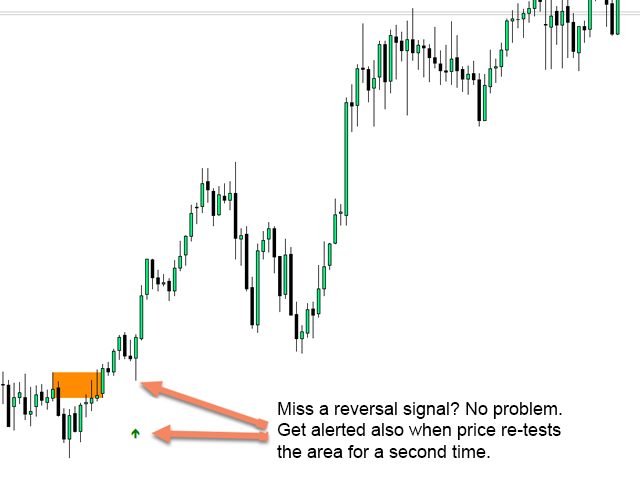
A second alert type then confirms when price returns to re-test the reversal zone. Structure shifts that hold a re-test are the higher-probability entries, and the indicator tracks this for you automatically. Alerts are delivered as terminal pop-ups, push notifications to your phone and email, on every symbol and timeframe you run it on, forex, gold, indices or crypto, from one-minute scalping through to daily-chart position trading.
Key features
- Alerts you to potential market structure changes at key exhaustion points, in real time
- Automatically draws short-term market structure, no manual marking of levels
- Trails alert rectangles behind price to find the tightest entries as the trend matures
- Rectangles convert to solid blocks on alerts, so reversal points are visible at a glance
- Re-test alerts confirm when a reversal zone has been successfully retested, filtering for the stronger entries
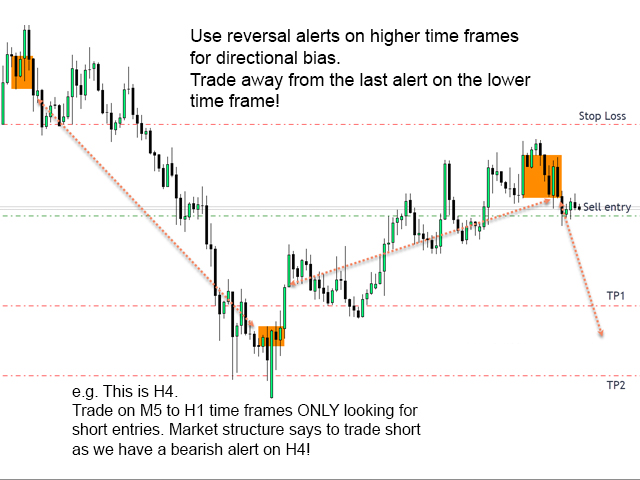
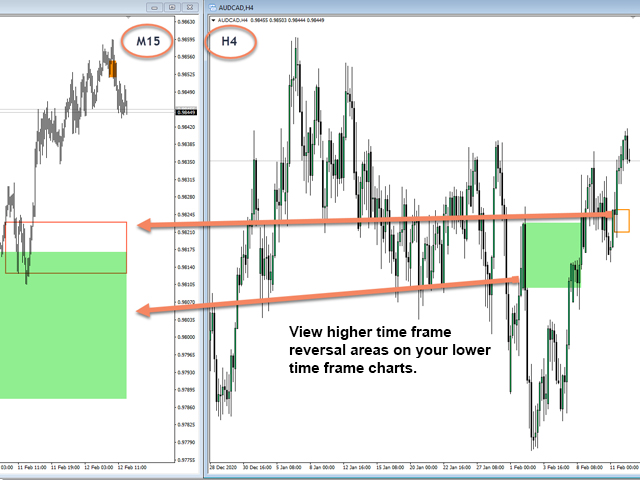
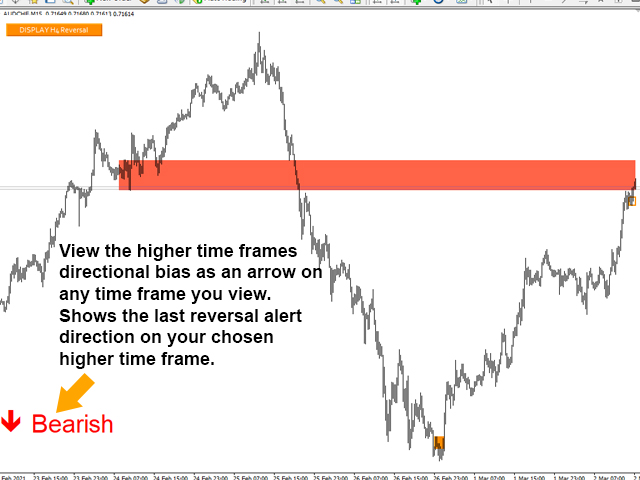
- View higher timeframe reversal rectangles on your lower trading timeframe, ideal for locating lower timeframe entries at higher timeframe levels
- Higher timeframe directional bias arrow shown on your chart, so you always know the bigger trend you are trading within
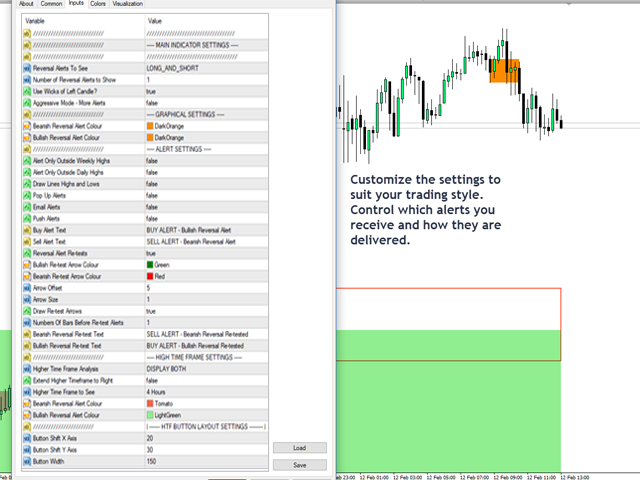
- Choose all alerts, longs only, shorts only, or direction based on each pair's current trend
- Pop-up, push and email alerts built in, monitor everything while away from the screen
- Works on every symbol and timeframe your broker offers
How to trade the alerts
When a reversal alert fires, look left: is price turning at an old support or resistance level, a supply or demand zone, or just beyond one where a stop hunt has occurred? Then check one higher timeframe for the same thing, structure shifts on lower timeframes are most powerful at major higher timeframe levels. When those conditions line up, trade in the direction of the reversal. Place your stop just beyond the most recent high or low, if the shift is genuine, price rarely returns through that peak. A 1.5 to 2 to 1 reward-to-risk is readily achievable, and running a second position trailed behind the new rectangles as they form can extend winners to 5 to 1 and beyond. The indicator also works as a confirmation layer on top of any existing strategy you already trade.
Important: how the indicator draws structure
The indicator always displays the current market structure. As structure evolves, old invalidated rectangles are replaced by the new levels price is actually respecting, this is by design, because you trade the structure that exists now, not history. Your alert notifications are your permanent real-time record of every signal as it fired. To watch exactly how it behaves bar by bar, download the free demo and run it in the strategy tester before you buy, and see the size of the moves that follow the reversal alerts.
Get started
This indicator is the core charting tool of the market structure methodology I have taught for many years as The Market Structure Trader, and structured free training on trading it is available via my profile.
Optional dashboard add-on to monitor ALL pairs and timeframes here: https://www.mql5.com/en/market/product/62751
EA available here: Auto trade market reversal alerts! https://www.mql5.com/en/market/product/65383
MT5 version available here: https://www.mql5.com/en/market/product/57892


magnifico indicador, útil en mi estrategias de trading muy recomendable