RSI and TDI Alert Dashboard
- Indicators
-
Lee Samson
 Have been trading since 1998, started in stocks and indices before moving over to Forex after around 5 years. Have been on the journey learning to trade like most traders, taking countless courses and trying every indicator and strategy under the sun.
 - Version: 1.40
- Updated: 17 May 2022
- Activations: 20
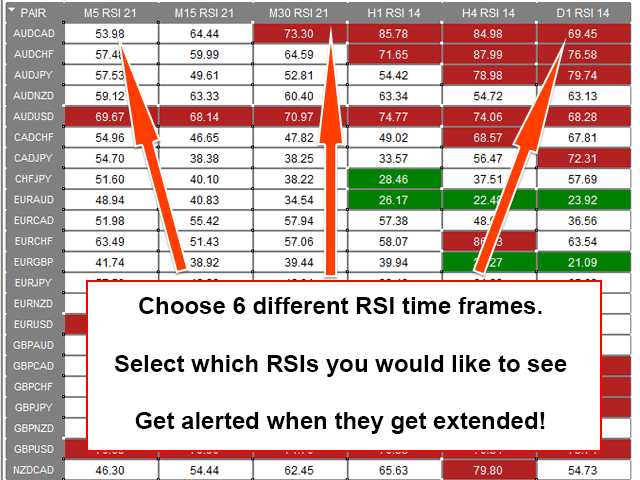
The RSI / TDI alert dashboard allows you to monitor RSIs at once (selectable by you) on every major pair you trade.
You can use it in two ways:
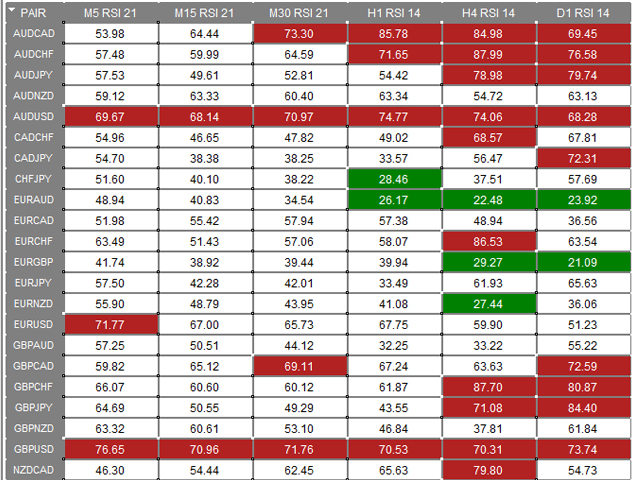
1. Select multiple time frames and the dash will show you when there are multiple time frames extended beyond normal trading conditions. A great indicator that price has pushed hard recently as it has achieved an overbought or oversold level across multiple time frames so a pullback or reversal is due soon.
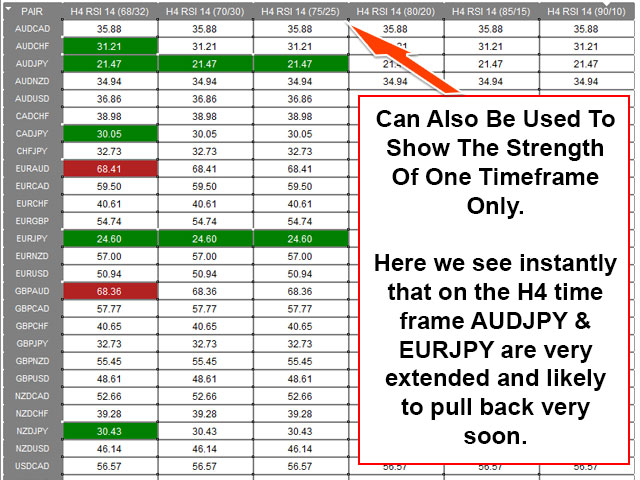
2. Use one time frame (your favourite to trade) and multiple RSI levels to show you the strength of the extension of RSI on that time frame. This is a great strategy for taking mean reversion trades when price has pushed very hard in one direction for too long and the market is due a profit take move. In the example screenshot you can see the H4 RSI is extended on 2 pairs beyond the 25 level which is much further than typical price action so a good opportunity to go long.
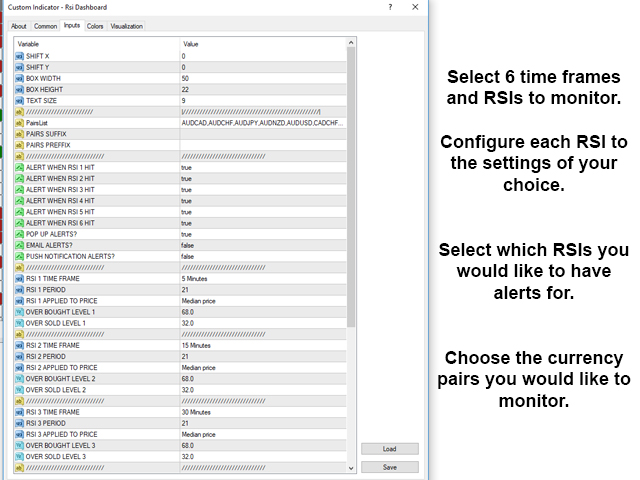
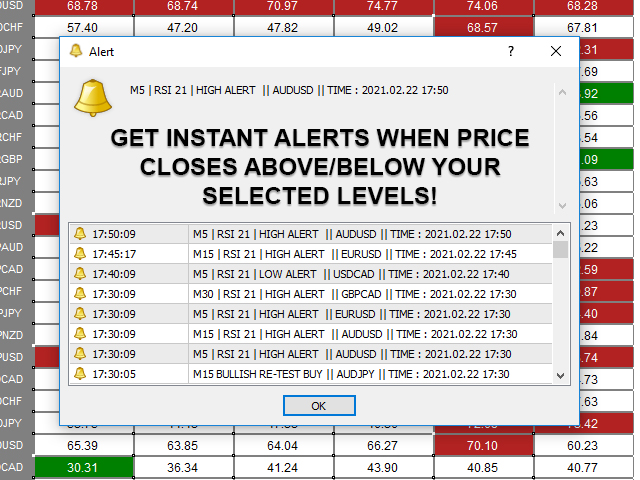
The dashboard will alert you to extended conditions (overbought and oversold) at levels of your choice when a candle closes on the chosen time frame. You can have 6 seperate RSIs monitored at once. Each one you can select the time frame, type and overbought and oversold levels for independently.
MT5 VERSION AVAILABLE HERE: https://www.mql5.com/en/market/product/66307
You can see instantly the condition of any currency pair and selct those that look ready for a pullback or reversal. Alerts on the dashboard show in the relevant colour to indicate whether it is a good buy (green) or sell (red) opportunity. You can also select which time frames to receive alerts on independently so if you just want to enter when M15 is extended you can select to only recive alerts for that time frame.
The dashboard is designed to sit on it's own chart with no other indicators and can be put on any pair or timeframe. It is designed to simply sit in the background and just alert you every time an RSI of your choosing gets to the levels of your choice.
Why is it called the RSI / TDI Dashboard?
The TDI is a popular indicator and used by many traders including those that follow Steve Mauro (BTMM) who uses it consistently. The signal line in the TDI is actually just an RSI line set to Median price and this dashboard allows you to mimic the TDI line almost exactly. This means you can use it to monitor potential shark fin entries in line with that strategy.
Input Settings:
- Box Sizing: Adjust the isze of the dashboard and the font size.
- Pairs List: Select the instruments you want to trade. Pre-loaded with all major and minor pairs.
- Pairs Suffix/Prefix: If your broker uses a prefix or suffix you can enter it in these boxes so the dashboard matches your symbols list.
- RSI Alerts: Get pop-up, email or push notifications for your selected RSI time frames.
- RSI Settings: Select the time frame, RSI period, Price type and levels for the alerts.
RSI Compliments Any Strategy:
The RSI (Relative Strength Index) is commonly used by pullback and reversal traders to show when a currency pair has pushed hard and is due to either pull back (profit take) or reverse completely in the opposite direction. It is a great confirmation indicator and can be used in any strategy to help confirm price action reversal patterns.
Using RSI Dashboard On It's Own:
You can use the dashboard as a stand alone system and take entries on pairs as they get over extended across multiple time frames.
For example:
Use a multi-timeframe entry method. Wait for multiple time frames to become overbought or oversold (e.g. H4, H1, M15) then enter when a lower timeframe also becomes extended. The more timeframes you have in the same colour the more over-extended it is in one direction and the more likely it is to pullback or reverse.
Or as stated above enter only when your favourite timeframe (mine is H4) is extended beyond a specific level (75 is great) and then enter on a lower time frame when price looks like reversing.


amazing tools!