Market Reversal Alerts Dashboard MT5
- Indicators
-
Lee Samson
 Have been trading since 1998, started in stocks and indices before moving over to Forex after around 5 years. Have been on the journey learning to trade like most traders, taking countless courses and trying every indicator and strategy under the sun.
 - Version: 2.10
- Updated: 5 August 2021
- Activations: 20
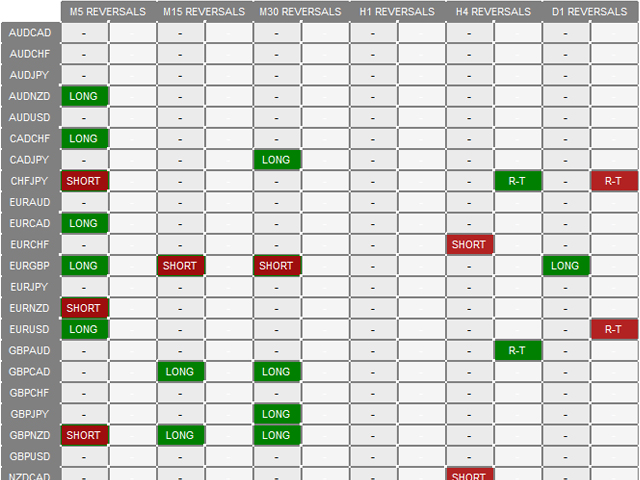
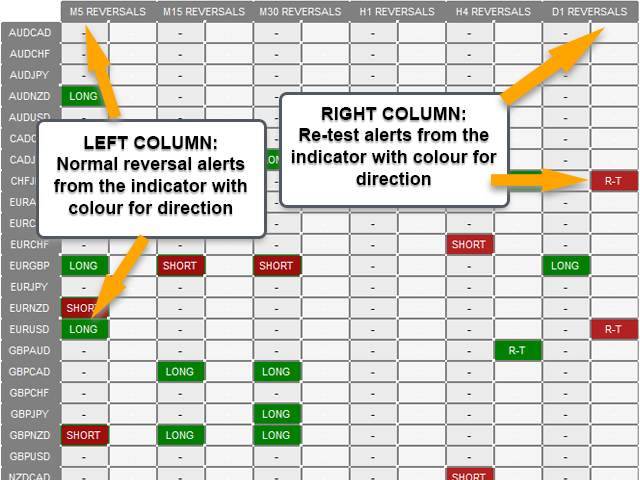
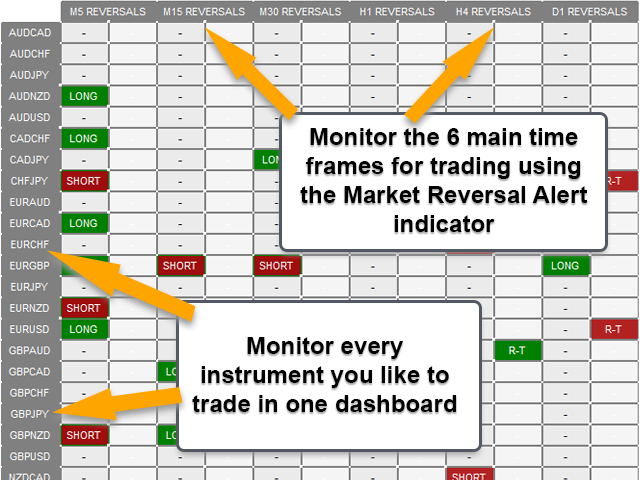
This dashboard is an alert tool for use with the market structure reversal indicator. It's primary purpose is to alert you to reversal opportunities on specific time frames and also to the re-tests of the alerts (confirmation) as the indicator does. The dashboard is designed to sit on a chart on it's own and work in the background to send you alerts on your chosen pairs and timeframes. It was developed after many people requested a dash to monitor multiple pairs and time frames at once rather than having the market reversal indicator running on multiple charts in one MT4. It alerts on M5, M15, M30, H1, H4 and D1 timeframes. Higher timeframes work best of course as with anything in trading.
The indicator I created to draw the rectangles and alert to market structure shifts on a specific pair runs the dashboard.
The dashboard simply allows you to monitor multiple pairs and time frames and get alerted with one chart open.
Get the MT5 version of the market reversal alerts indicator here: https://www.mql5.com/en/market/product/46295
MT4 version of this dashboard is here: https://www.mql5.com/en/market/product/62751/
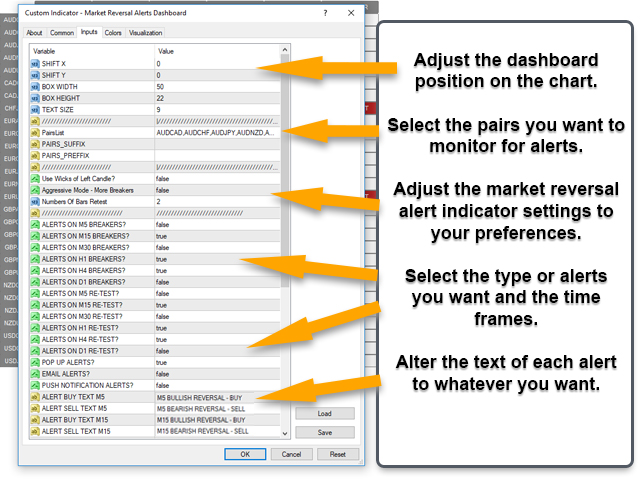
Indicator Inputs / Settings:
- Adjust size and position of dashboard.
- Select pairs to show and your brokers suffix or prefix if required.
- Adjustments for market reversal indicator fine tuning including wicks to the left, aggressive mode and retest distance settings.
- Select which time frames you would like to receive alerts for.
- Select which time frames you would like to receive re-test alerts for.
- Alert preference, choose from pop-up, email or push notifications.
- Adjust the text for each alert as required.
About The Market Reversal Alert Indicator:
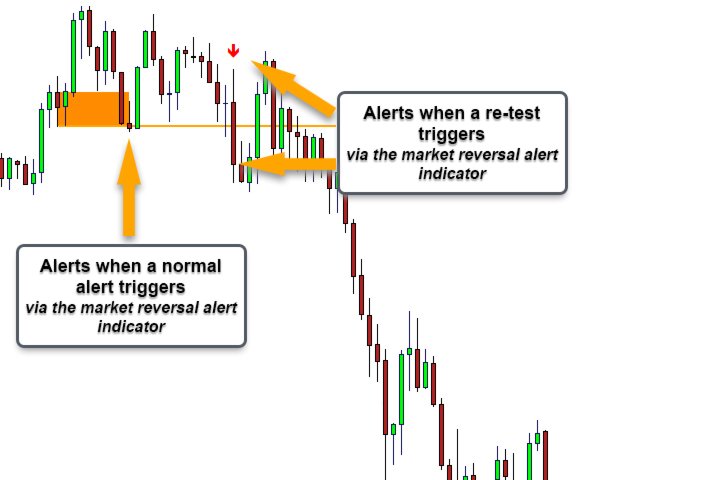
Market structure is widely used by many traders for a number of different strategies. There is a wealth of information on the web about market structure but basically the indicator is designed to give you early alerts when shifts are potentially happening. The indicator draws rectangles on the candles of opposing colour to a trend or move. These candles tend to support a continuous move in one direction until price closes above/below it in the opposing direction.
So the basic premise of the indicator is that when you get an alert after a move down it's possible a bottom has formed and a change in market structure is about to occur (reversal/pullback - either short or long term). Of course not every alert will work out and if price continues in the same direction (in this case down) and closes below the most recent low the indicator removes the alert from the chart and continues to draw in new structure.


Awesome Dashboard, works perfect in combination with the Market Reversal Indicator. Very good quality and functionality as you are used to from Lee 👍