Multi Timeframe MTF Visual Stochastics Display

5

AT LAST! A stochastic indicator for MT4 that shows multiple time frames on one chart! See the actual position of the main and signal lines in 4 separate time frames instantly to help you make educated trading decisions.A true MTF stochastic indicator for traders that need to see visually what the indicator is telling them on multiple time frames, no arrows that just point up or down or numbers displayed.

No more flicking between time frames to see where other stochastics are positioned! Stay on your favorite time frame and get an overview of them all!

No more wondering if that up or down arrow on other stochastic indicators is the main or signal line, or what angle it's really pointing!

No more MTF stochastics that just don't look right as hey are stretched out or inaccurate and take up valuable chart space!

See whether a cross has happened or not on all timeframes RIGHT FROM YOUR TRADING CHART!

FEATURES

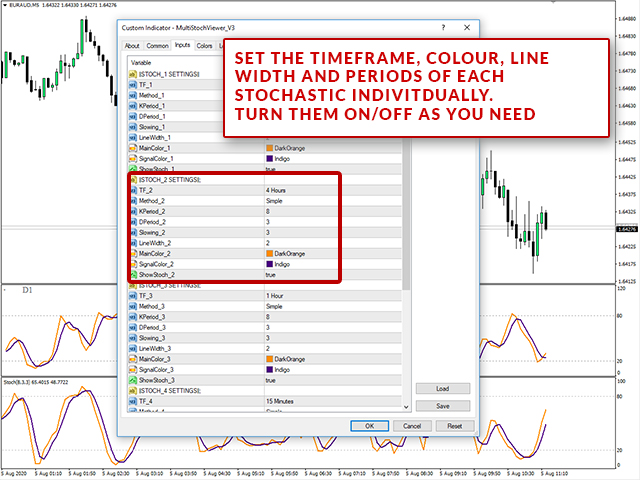
  • Choose your preferred time frames ( up to 4 in total) from M1 to Monthly
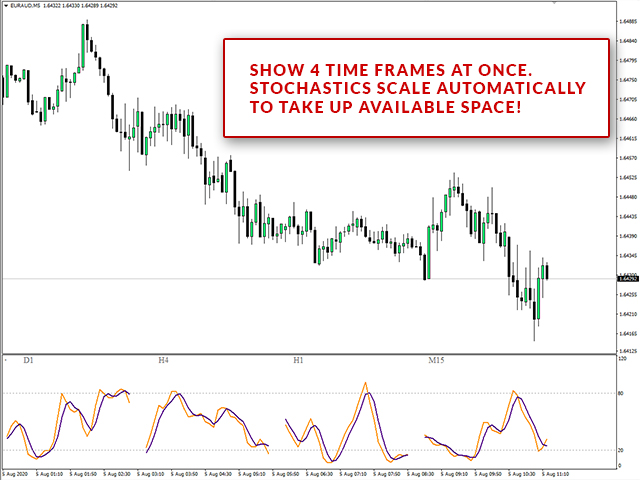
  • See the latest portion of the stochastic for each one displayed side by side
  • Fully customizable colours, levels and parameters as per the stock indicator that comes with MT4
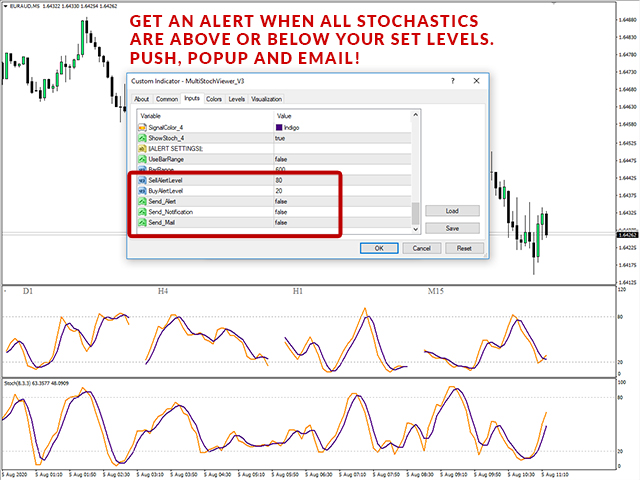
  • Setup alerts to tell you when all time frames you have chosen are overbought or oversold
  • Integrated popup, push and email alerts
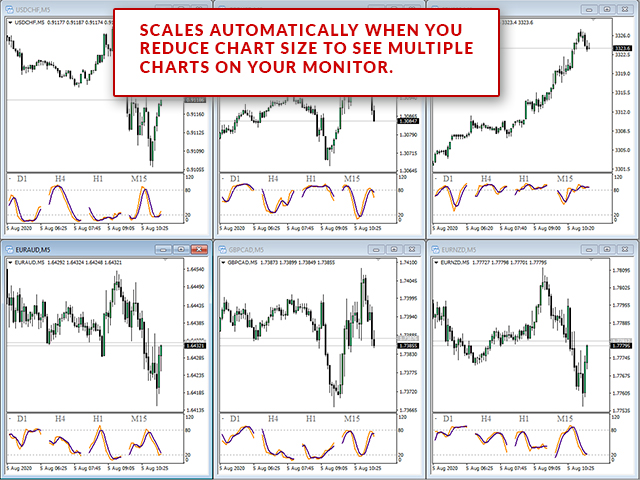
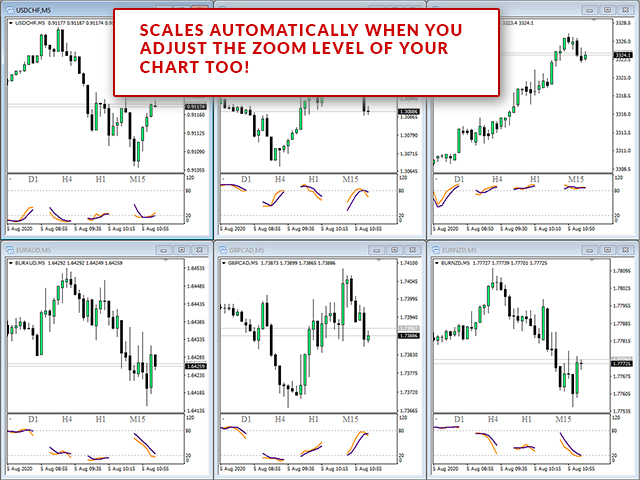
  • Scales with your chart so each stochastic takes up 1/4 of the available space on screen
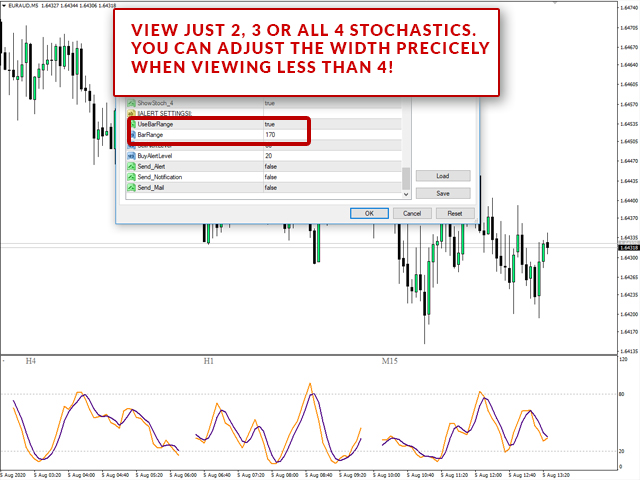
  • Choose to have 2, 3 or 4 stochastics displayed and manually set the width each takes up.
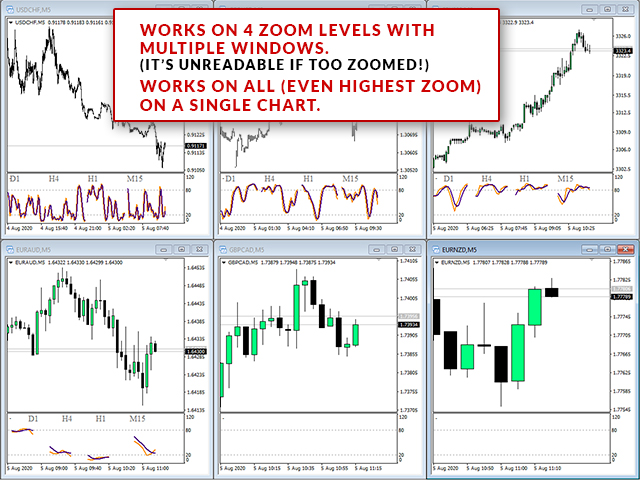
  • Zooms in and out with your main chart to keep in line with your preferred view of the market
  • Choose the same parameters for multiple time frames or set them all to the same time frame and show different stochastics with different parameters

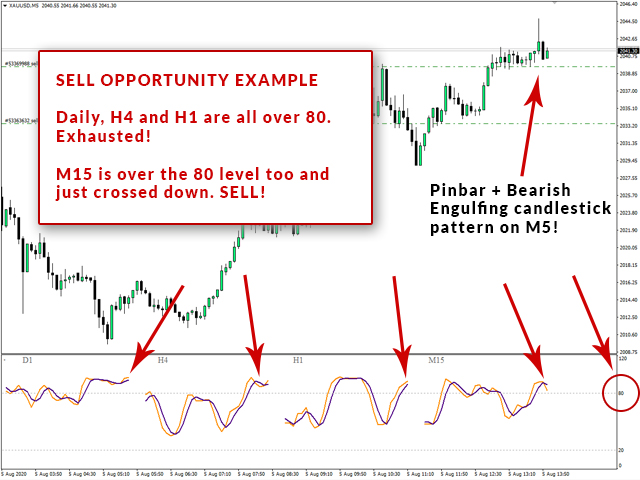
You've heard the phrase BUY LOW and SELL HIGH! Stochastics are a great indicator of where to do that, especially when multiple time frames agree. Single stochastics on lower time frames especially cannot be relied upon.
NEVER buy when stochastics are over 80 and NEVER sell when they are below 20.

Stochastics form a key part of many systems and oscillators have always been used to help identify market waves and moves. Most professional traders use multiple time frame analysis to time their entries and spot key areas to get in and out of the market.

Having 4 key time frames displayed instantly on one chart for traders that use multiple time frame analysis and stochastics is priceless.

Common Strategies & How To Trade With the MTF Stochastics Indicator

The MTF stochastics indicator can be used alone or in conjunction with your other favorite indicators.

Exhaustion Strategy

On it's own a great strategy is to use stochastics for identifying when pullbacks are likely to occur.

  1. When all selected time frames are either overbought (above the 80 level) or oversold (below the 20 level) look for price action signals on the lowest time frame. 
  2. The indicator will alert you when the stochastics are in these areas
  3. Price action signals could be a pinbar, engulfing candle or any good candlestick formation that traditionally signals a reversal.

Trend Pullback Strategy

Us the highest time frame to signal trend direction to you. e.g. M15, H1, H4 or daily time frame for trend.

  1. Us the highest time frame for general trend direction. Only take trades in the direction this time frame stochastic is heading. If stochastics have recently left the oversold area (under 20) crossed and are heading up you have a temporary uptrend.
  2. Use the lower time frames to time entries into the market in the direction of the higher trend.
  3. Wait for the lower time frames to be oversold (if trend direction is up) and buy when you get a cross on the lowest time frame stochastics or a good price action candlestick formation.


Reviews 1
Max
1639
Max 2025.09.05 20:57 
 

Great indicator, needs to be updated with complete settings for Stoch types like built-in stoch, look forward to RSI and MACD version and mt5

Recommended products
Forex Market Profile and Vwap
Lorentzos Roussos
4.86 (7)
Volume Profile Indicator / Market Profile Indicator What this is not : FMP is not the classic letter-coded TPO display , does not display the overall chart data profile calculation , and , it does not segment the chart into periods and calculate them. What it does :  Most importantly ,the FMP indicator will process data that resides between the left edge of the user defined spectrum and the right edge of the user defined spectrum. User can define the spectrum by just pulling each end of the indi
FREE
Extremum by trend
Anton Iudakov
5 (2)
Looking for entry points along the local trend without repaint! Arrows indicate entry points. Based on classic indicators. The indicator is easy to use. Settings Наименование Описание Frequency factor Signal frequency. The less, the more often. This affects the quality. Recommendations Recommended for use on major currency pairs. Timeframe from m5, m15, m30 Subscribe to my telegram channel, where we discuss intraday trading, ideas, indicators, etc., a link in my profile contacts.
FREE
Shadow Flare MT4
Kestutis Balciunas
Shadow Flare Indicator is a non-repainting trend & liquidity tool for MetaTrader 4. It runs a configurable moving-average baseline (HMA, EMA, SMA, or RMA) wrapped in an Average True Range envelope and produces a sticky trend state that only flips when price closes through the upper or lower band. The same trend engine drives an automatic supply/demand zone module that detects pivot highs and pivot lows, draws coloured boxes around them, and mitigates each zone the moment price closes through it.
FREE
Enhanced Volume Profile: The Ultimate Order Flow & Liquidity Analysis Tool Overview Enhanced Volume Profile   is an indicator for MetaTrader 5 that displays the traded volume at specific price levels over a defined period. It separates the total volume into buy and sell components, presenting them as a side-by-side histogram on the chart. This allows users to observe the volume distribution and the proportion of buy and sell volumes at each price level. Graphics Rendering The indicator uses t
FREE
SX Supply Demand Zones accurately identifies and draws high-probability Supply and Demand zones using a sophisticated algorithm. Unlike traditional indicators that clutter your chart, this indicator is designed with a focus on performance and a clean user experience. New Unique Feature: Interactive Legend System What truly sets this indicator apart from everything else is the Interactive Control Legend. You have a professional dashboard directly on your chart that allows you to: Show/Hide: Ins
FREE
PZ Penta O MT4
PZ TRADING SLU
2.33 (3)
The Penta-O is a 6-point retracement harmonacci pattern which usually precedes big market movements. Penta-O patterns can expand and repaint quite a bit. To make things easier this indicator implements a twist: it waits for a donchian breakout in the right direction before signaling the trade. The end result is an otherwise repainting indicator with a very reliable trading signal. The donchian breakout period is entered as an input. [ Installation Guide | Update Guide | Troubleshooting | FAQ | A
FREE
SMA Indicator
Nitu Brijesh Yadav
Arrow Indicator (Buy/Sell Alerts) – Simple Yet Powerful Tool!             Product Version: 1.01           Indicator Type: Trend Reversal Signals           Timeframes Supported: All (Recommended: H1, H4, D1)           Key Features: Buy Signal: Green upward arrow () appears below the candle  Sell Signal : Red downward arrow () appears above the candle Accurate Trend Reversal Detection – Based on tried and tested SMA strategy. ️ Clean Chart View – Minimalist, non-i
FREE
QualifiedEngulfing
Ashkan Hazegh Nikrou
QualifiedEngulfing Is Free Version Of ProEngulfing Indicator  ProEngulfing Is Paid Version Of This Indicator  Download It Here . What is Different Between free and paid version of ProEngulfing ?  Free version has limitation of One Signal Per Day Join Koala Trading Solution Channel in mql5 community to find out the latest news about all koala products, join link is below : https://www.mql5.com/en/channels/koalatradingsolution Introducing QualifiedEngulfing   – Your Professional Engulf Pattern In
FREE
Free automatic Fibonacci is an indicator that automatically plots a Fibonacci retracement based on the number of bars you select on the BarsToScan setting in the indicator. The Fibonacci is automatically updated in real time as new highest and lowest values appears amongst the selected bars. You can select which level values to be displayed in the indicator settings. You can also select the color of the levels thus enabling the trader to be able to attach the indicator several times with differe
FREE
Smart FVG Indicator MT4   delivers professional Fair Value Gap (FVG) detection, monitoring, and alerting directly on your charts. It combines   ATR-based filtering   with structure-aware logic to remove noise, adapt to liquidity, and keep only the most relevant imbalances for precise decisions. Key Advantages Accurate FVG detection:   Identifies genuine inefficiencies, not just simple candle gaps. ATR-based precision:   Adaptive sensitivity filters out low-quality signals across markets and time
FREE
Master the market rhythm with the Advanced Market Sessions indicator. Timing is everything in trading. Knowing exactly when major financial centers open and close is the key to understanding market volatility, liquidity, and directional bias. This indicator gives you crystal-clear visibility into the three major trading sessions: Asia, London, and New York. By automatically mapping the exact High and Low of each session in real-time, this tool empowers you to trade with true institutional contex
FREE
BoxInside MT4
Evgeny Shevtsov
4.83 (6)
This indicator calculates the volume profile and places labels that correspond to the VAH, VAL and POC levels, for each candle individually. Indicator operation features The indicator works on the timeframes from M5 to MN, but it uses the history data of smaller periods: M1 - for periods from M5 to H1, M5 - for the H4 period, M30 - for the D1 period, H4 - for the W1 period, D1 - for the MN period. The color and location of the VAL, VAH and POC labels on the current candle are considered to be c
FREE
Extremum Reverse Bar
Yurij Izyumov
2.8 (5)
This indicator has been created for finding the probable reversal points of the symbol price. A small candlestick reversal pattern is used it its operation in conjunction with a filter of extremums. The indicator is not redrawn! If the extremum filter is disabled, the indicator shows all points that have a pattern. If the extremum filter is enabled, the condition works – if the history Previous bars 1 candles back contains higher candles and they are farther than the Previous bars 2 candle, such
FREE
Check my paid tools they work great and I share Ea's based on them for free please r ate The Dual Timeframe RSI (Relative Strength Index) indicator is a novel trading tool that allows traders to monitor RSI readings from two different timeframes on a single chart. This dual perspective enables traders to identify potential trend confirmations and divergences more effectively. For instance, a trader might use a 1-hour RSI alongside a daily RSI to ensure that short-term trades align with the broa
FREE
SC MTF Rsi MT4
Krisztian Kenedi
5 (1)
Relative Strength Index (RSI) indicator with multi-timeframe support, customizable visual signals, and configurable alert system. Freelance programming services, updates, and other TrueTL products are available on my MQL5 profile . Feedback and reviews are highly appreciated! What is RSI? Relative Strength Index (RSI) is a momentum oscillator that measures the speed and magnitude of price changes. The indicator oscillates between 0 and 100, comparing the magnitude of recent gains to recent lo
FREE
DSS Candles AM
Andrii Matviievskyi
This indicator colors the price chart candles according to the data of the DSS Oscillator AM indicator. DSS Oscillator AM is the author's implementation of the Double Smoothed Stochastic oscillator developed by William Blau and Walter Bressert. The calculation of values ​​is largely similar to the calculation of the classic stochastic oscillator. The indicator takes into account the location of the current price relative to local highs/lows. The signal about the change in the direction of price
Scalping indicator. It takes into account volatility, price movement in the local interval and the direction of the current trend. Recommended timeframe - M5. Advantages: Low volatility when a signal appears ensures minimal movement against an open position. The indicator does not redraw its signals. There are alert signals. It is a great tool for day trading. Settings: Name Description Period Indicator period Range of each bar in the period (pp.) The maximum size of each candle in the indicato
FREE
Wise Men Indicator demo
Bohdan Kasyanenko
3 (2)
The indicator displays signals according to the strategy of Bill Williams on the chart. Demo version of the indicator has the same features as the paid, except that it can work only on a demo account . Signal "First Wise Man" is formed when there is a divergent bar with angulation.  Bullish divergent bar - with lower minimum and closing price in the upper half. Bearish divergent bar - higher maximum and the closing price at the bottom half. Angulation is formed when all three lines of Alligator
FREE
Rainbow MT4
Jamal El Alama
Rainbow MT4 is a technical indicator based on Moving average with period 34 and very easy to use. When price crosses above MA and MA changes color to green, it’s a signal to buy. When price crosses below MA and MA changes color to red, it’s a signal to sell. The Expert advisor ( Rainbow EA MT4) based on Rainbow MT4 indicator, as you can see in the short video below is now available here .
FREE
This is a regression tree indicator for MT4/MT5. This indicator classificate nodes on the time period so that the deviation becomes smaller, and displays regression line and channel for each node. It's free! Attached CartDemo.ex4 and CartDemo.ex5 is a Demo version and has the following limitations: Can't use HighSpeed method (default method is RandomForest) Maximum number of bars is 260 (increase from 200) There is no expiration date and can be started many times, but it stops after an hour.
FREE
Power Trend Free
Yurij Kozhevnikov
5 (2)
Power Trend Free - the indicator shows the trend strength in the selected period. Input Parameters The indicator has three input parameters: Period - a positive number greater than one, it shows the number of candlesticks used for calculations. If you enter one or zero, there will be no error, but the indicator will not be drawn. Applied Price - the standard "Apply to:" set meaning data used for the indicator calculation: Close - Close prices; Open - Open prices; High - High prices; Low - Low p
FREE
With this system you can spot high-probability trades in direction of strong trends. You can profit from stop hunt moves initiated by the smart money! Important Information How you can maximize the potential of the scanner, please read here: www.mql5.com/en/blogs/post/718109 Please read also the blog about the usage of the indicator: Professional Trading With Strong Momentum This FREE Version of the indicator works only on EURUSD and GBPUSD. The full version of the indicator can be found here:
FREE
SX Golden MA Pack MT4
Mojtaba Sarikhani
5 (1)
This comprehensive technical indicator calculates and plots up to 3 moving averages with 3 different periods. By employing three moving averages of distinct lookback periods, the trader can confirm whether the market has indeed experienced a change in trend or whether it is merely pausing momentarily before resuming its prior state. SX Golden MA Pack  for MT5 is available   here . The shorter the moving average period, the more closely it tracks the price curve. When a security initiates an upt
FREE
Discover the power of precision and efficiency in your trading with the " Super Auto Fibonacci " MT4 indicator. This cutting-edge tool is meticulously designed to enhance your technical analysis, providing you with invaluable insights to make informed trading decisions. Key Features: Automated Fibonacci Analysis: Say goodbye to the hassle of manual Fibonacci retracement and extension drawing. "Super Auto Fibonacci" instantly identifies and plots Fibonacci levels on your MT4 chart, saving you tim
FREE
ZigZag Support Resistance MT4
Emmanuel Tshepang Mosweu
4.67 (3)
This indicator uses the Zigzag indicator to identify swing highs and swing lows in the price chart.    Once it has identified the swing highs and swing lows, it can use them to determine potential support and resistance levels. A support level is formed when the price drops and bounces back up from a swing low, indicating that there is buying pressure at that level. A resistance level is formed when the price rises and reverses downward from a swing high, suggesting selling pressure at that leve
FREE
Zig Zag 123
Stephen Reynolds
Zig Zag 123 tells us when a reversal or continuation is more likely by looking at the shift in supply and demand. When this happens a signature pattern appears known as 123 (also known ABC) will often break out in direction of higher low or lower high. Stop loss and take profit levels have been added. There is a panel that shows the overall performance of your trades for if you was to use these stop loss and take profit levels.  We get alerted if a pattern 123 appears and also if the price re
FREE
Trendline indicator
David Muriithi
2 (1)
Are you tired of drawing trendlines every time you're analyzing charts? Or perhaps you would like more consistency in your technical analysis. Then this is for you. This indicator will draw trend lines automatically when dropped on a chart. How it works Works similar to standard deviation channel found on mt4 and mt5. It has 2 parameters: 1. Starting Bar 2. Number of bars for calculation The   starting bar   is the bar which drawing of the trend lines will begin, while the   number of bars for c
FREE
This indicator shows the latest untouched support and resistance as horizontal lines. The indicator can show support/resistance from higher timeframes. With this indicator you can e.g. easily see the support/resistance of the timeframes H4, D1 and W1 on a H1 chart, which can be a big advantage while time your entry on H1. This is the FREE version of the indicator: Support Resistance Multi Time Frame The free version works only on EURUSD and GBPUSD! Parameters referenceTF: the timeframe from whi
FREE
This indicator alerts you when/before new 1 or 5 minute bar candle formed. In other words,this indicator alerts you every 1/5 minutes. This indicator is especially useful for traders who trade when new bars formed. *This indicator don't work propery in strategy tester.Use this in live trading to check functionality. There is more powerful Pro version .In Pro version,you can choose more timeframe and so on. Input Parameters Alert_Or_Sound =Sound ----- Choose alert or sound or both to notify y
FREE
Follow The Line
Oliver Gideon Amofa Appiah
3.94 (16)
FOLLOW THE LINE GET THE FULL VERSION HERE: https://www.mql5.com/en/market/product/36024 This indicator obeys the popular maxim that: "THE TREND IS YOUR FRIEND" It paints a GREEN line for BUY and also paints a RED line for SELL.  It gives alarms and alerts of all kinds. IT DOES NOT REPAINT and can be used for all currency pairs and timeframes. Yes, as easy and simple as that. Even a newbie can use it to make great and reliable trades. NB: For best results, get my other premium indicators for more
FREE
Buyers of this product also purchase
Neuro Poseidon MT4
Daria Rezueva
4.96 (24)
Neuro Poseidon is a new indicator by Daria Rezueva. It combines precise trading signals with adaptive TP/SL levels - creating best possible trades as a result! Message me and get  Neuro Poseidon Assistant  as a gift to automize your trading process! What makes it stand out? 1. Proven profitability on all assets and timeframes 2. Only confirmed BUY and SELL signals present on the chart 3. Adaptive TP & SL levels generated by the software for each trade 4. Easy to understand - suitable for all
M1 Sniper
Oleg Rodin
5 (23)
M1 SNIPER is an easy to use trading indicator system. It is an arrow indicator which is designed for M1 time frame. The indicator can be used as a standalone system for scalping on M1 time frame and it can be used as a part of your existing trading system. Though this trading system was designed specifically for trading on M1, it still can be used with other time frames too. Originally I designed this method for trading XAUUSD and BTCUSD. But I find this method helpful in trading other markets a
Gann Made Easy
Oleg Rodin
4.84 (164)
Gann Made Easy is a professional and easy to use Forex trading system which is based on the best principles of trading using the theory of W.D. Gann. The indicator provides accurate BUY and SELL signals including Stop Loss and Take Profit levels. You can trade even on the go using PUSH notifications. PLEASE CONTACT ME AFTER PURCHASE TO GET TRADING  INSTRUCTIONS AND GREAT EXTRA INDICATORS   FOR FREE! Probably you already heard about the Gann trading methods before. Usually the Gann theory is a ve
Scalper Inside PRO
Alexey Minkov
4.74 (68)
Scalper Inside PRO Scalper Inside PRO is an intraday trend and scalping indicator for MetaTrader 4 that uses an exclusive algorithm to quickly detect market direction and key target levels. It automatically calculates entry, exit and multiple profit targets, and shows detailed performance statistics so you can see how different instruments and strategies performed. This helps you choose the most suitable trading instruments for the current market conditions. Additionally, you can easily integrat
PRO Renko System
Oleg Rodin
5 (30)
PRO Renko System is a highly accurate trading system specially designed for trading RENKO charts. The ARROWS and Trend Indicators DO NOT REPAINT! The system effectively neutralizes so called market noise giving you access to accurate reversal signals. The indicator is very easy to use and has only one parameter responsible for signal generation. You can easily adapt the tool to any trading instrument of your choice and the size of the renko bar. I am always ready to provide extra support to help
Dynamic Forex28 Navigator
Bernhard Schweigert
4.43 (7)
Specials Discount now. The Next Generation Forex Trading Tool. Dynamic Forex28 Navigator is the evolution of our long-time, popular indicators, combining the power of three into one: Advanced Currency Strength28 Indicator (695 reviews) + Advanced Currency IMPULSE with ALERT (520 reviews) + CS28 Combo Signals (recent Bonus) Details about the indicator  https://www.mql5.com/en/blogs/post/758844 What Does The Next-Generation Strength Indicator Offer? Everything you loved about the originals, now
Trend Catcher ind
Ramil Minniakhmetov
TREND CATCHER INDICATOR Trend Catcher Indicator analyzes market price movements, using a combination of the author’s proprietary and customized adaptive trend-analysis indicators.  It identifies the true market direction by filtering out short-term noise and focusing on underlying momentum strength, volatility expansion, and price structure behavior.  It also uses a combination of smoothing and trend-filtering customized indicators such as moving averages, RSI, and volatility filters.   Real ope
Trend Lines PRO
Roman Podpora
5 (1)
TREND LINES PRO    helps understand where the market is truly changing direction. The indicator shows real trend reversals and points where major players re-enter. You see   BOS lines   Trend changes and key levels on higher timeframes — without complex settings or unnecessary noise. Signals don't repaint and remain on the chart after the bar closes. VERSION MT 5     -     Reveals its maximum potential when paired with the   RFI LEVELS PRO  indicator What the indicator shows: Real shifts   tren
Enigmera
Ivan Stefanov
5 (8)
ENIGMERA: The core of the market (This is a manual indicator and contains features that may not supported by the MetaTrader current testing environment) Introduction This indicator and trading system is a remarkable approach to the financial markets . ENIGMERA uses the fractal cycles to accurately calculate support and resistance levels. It shows the authentic accumulation phase and gives direction and targets.  A system that works whether we are in a trend or a correction.   How It Works Most
KT Alpha Hunter Arrows MT4
KEENBASE SOFTWARE SOLUTIONS
Most arrow indicators give you a signal and leave you to figure out the rest. KT Alpha Hunter Arrows gives you the full trading plan. Every signal arrow prints with a full plan already drawn: entry line, stop-loss, four take-profit levels, and a live edge verdict telling you whether this symbol and time-frame is worth trading right now. An included Trade Manager EA handles the execution after you enter, so discipline stays intact when the market gets loud. Non-repaint. Closed-bar signals only. B
This indicator is an indicator for automatic wave analysis that is perfect for practical trading! Case... Note:   I am not used to the Western name for wave classification. Influenced by the naming habit of Chaos Theory (Chanzhongshuochan), I named the basic wave as   pen   , the secondary wave band as   segment   , and the segment with trend direction   as main trend segment   (this naming method will be used in future notes, let me tell you in advance), but the algorithm is not closely relat
Genesis Matrix Pro is a professional multi-timeframe trend detection indicator designed to help traders identify high-quality market alignment with clarity and structure. It combines 12 different technical indicators into one visual alignment matrix, allowing traders to quickly see when market conditions are bullish, bearish, or neutral. A signal is generated only when the selected strategies are aligned, helping reduce noise and improve decision-making. PLEASE CONTACT ME AFTER PURCHASE TO GET
This product was   updated   for the   2026 market   and   optimized   for the   latest MT5 builds . PRICE UPDATE NOTICE: Smart Trend Trading System   is currently available for $99. The price will   increase to $199   after the next   30 purchases. SPECIAL OFFER:  After purchasing Smart Trend Trading System, send me a private message to claim the Smart Universal EA for FREE and turn your Smart Trend signals into automated trades. Smart Trend Trading System is a complete non-repainting, non-re
MTF Supply Demand Zones
Georgios Kalomoiropoulos
4.82 (22)
Next Generation Of Automated Supply And Demand Zones. New and Innovative Algorithm that Works At Any Chart. All Zones Are Being Created Dynamically According To Price Action Of The Market. AMAZING OFFER --> Activations from 5 to 20 for "MTF Supply Demand Zones" and "Automated Trendlines" If you get the MTF Supply Demand Zones you can join the " Trade Like Me " Video Series. It contains 14 Live Sessions where  i am placing trades on Forex, Stocks, Indices and Metals. You will be able to see ho
PZ Trend Trading
PZ TRADING SLU
4.8 (5)
Capture every opportunity: your go-to indicator for profitable trend trading Trend Trading is an indicator designed to profit as much as possible from trends taking place in the market, by timing pullbacks and breakouts. It finds trading opportunities by analyzing what the price is doing during established trends. [ Installation Guide | Update Guide | Troubleshooting | FAQ | All Products ] Trade financial markets with confidence and efficiency Profit from established trends without getting whips
Step into the world of Forex trading with confidence, clarity, and precision using   Gold Indicator   a next-generation tool engineered to take your trading performance to the next level. Whether you’re a seasoned professional or just beginning your journey in the currency markets, Gold Indicator equips you with powerful insights and help you trade smarter, not harder. Built on the proven synergy of three advanced indicators, Gold Indicator focuses exclusively on medium and long-term trends eli
MetaBands M4
Vahidreza Heidar Gholami
3.5 (6)
MetaBands uses powerful and unique algorithms to draw channels and detect trends so that it can provide traders with potential points for entering and exiting trades. It’s a channel indicator plus a powerful trend indicator. It includes different types of channels which can be merged to create new channels simply by using the input parameters. MetaBands uses all types of alerts to notify users about market events. Features Supports most of the channel algorithms Powerful trend detection algorith
Current event:  https://c.mql5.com/1/326/A2SR2025_NoMusic.gif A. What is A2SR ?   * It's a leading technical indicator (no repaint, no lagging). -- Guidance : -- at   https://www.mql5.com/en/blogs/post/734748/page4#comment_16532516 -- and  https://www.mql5.com/en/users/yohana/blog A2SR has a special technique in determining the levels of Support ( demand ) and Resistance ( supply ) . Unlike the ordinary way that we seen on the net, A2SR has a original concept in determining actual SR levels.
M30/H1/H4 Swing Version Available Want to catch the big moves that M5/M15 can't reach? Gold Signal Swing Pro (M30/H1/H4) is now available. Target $20-$80+ per trade. https://www.mql5.com/en/market/product/177643 KURAMA GOLD SIGNAL PRO (MT4) — Complete XAUUSD Trading System with 7-Layer Filter, Auto TP/SL, and Quality Scoring NON-REPAINTING. NON-REDRAWING. NON-LAGGING. Every signal is permanent. What you see is what you get. BONUS: Buy the lifetime li
BTMM State Engine Pro is a MetaTrader 4 indicator for traders who use the Beat The Market Maker approach: Asian session context, kill zone timing, level progression, peak formation detection, and a multi-pair scanner from a single chart. It combines cycle state logic with a built-in scanner dashboard so you do not need the same tool on many charts at once. What it does Draws the Asian session range; session times can follow broker server offset or be set in inputs. Tracks level progression (L
Advanced Supply Demand
Bernhard Schweigert
4.91 (300)
Trading Special – 40% OFF Best Solution for any Newbie or Expert Trader! This indicator is a unique, high quality and affordable trading tool because we have incorporated a number of proprietary features and a new formula. With this update, you will be able to show double timeframe zones. You will not only be able to show a higher TF but to show both, the chart TF, PLUS the higher TF: SHOWING NESTED ZONES. All Supply Demand traders will love it. :) Important Information Revealed Maximize the pot
Neo Wave PRO
Nikolay Raykov
Price & Time Market Structure Indicator A professional market structure tool that analyzes waves through both price and time — not price alone. Main Description NeoWave PRO is a professional market structure indicator for MetaTrader 4 designed for traders who want to move beyond traditional one-dimensional wave tools such as ZigZag, swing indicators, and basic high/low systems. Most wave indicators analyze only one thing: Price. But a real market wave is not only a price movement. A true wave de
RFI levels PRO
Roman Podpora
5 (1)
The indicator accurately shows the reversal points and price return zones where the   Major players . You see where new trends are forming and make decisions with maximum precision, maintaining control over every trade. VERSION MT5     -     Reveals its maximum potential when combined with the   TREND LINES PRO   indicator What the indicator shows: Reversal structures and reversal levels with activation at the beginning of a new trend. Display of   TAKE PROFIT   and   STOP LOSS   levels with mi
Quant Direction
Georgios Kalomoiropoulos
Quant Direction is a 3 dimensional market analysis tool. It provides a purely objective, algorithmic view of the market by calculating exact percentage-based biases across multiple dimensions simultaneously. Developed utilizing advanced AI modeling tools and subjected to thorough testing, this algorithm is engineered to read the market with unique precision. It can analyze any currency pair or financial instrument available on your platform.  Quant Direction is the ideal tool whether you are a S
MonsterDash Harmonic Indicator is a harmonic pattern dashboard. It recognizes all major patterns. MonsterDash is a dashboard that displays all detected patterns for all symbols and (almost) all timeframes in sortable and scrollable format. Users can add their own user defined patterns . MonsterDash can open and update charts with the pattern found. Settings MonsterDash's default settings are good enough most of the time. Feel free to fine tune them to your needs. The color settings are for thos
Apollo SR Master is a Support/Resistance indicator with special features which make trading with Support/Resistance zones easier and more reliable. The indicator calculates Support/Resistance zones in real-time without any time lag by detecting local price tops and bottoms. Then to confirm the newly formed SR area, the indicator shows special signal which signalizes that the SR zone can be taken into consideration and used as an actual SELL or BUY signal. In this case the strength of the SR zone
Trading Special –40% OFF Best Solution for any Newbie or Expert Trader! This Indicator is a unique, high quality and affordable trading tool because we have incorporated a number of proprietary features and a new formula. With only ONE chart you can read Currency Strength for 28 Forex pairs! Imagine how your trading will improve because you are able to pinpoint the exact trigger point of a new trend or scalping opportunity? User manual: click here That's the first one, the original! Don't buy a
Auto Optimized Parabolic RSI: Advanced 3D Momentum Engine Most retail indicators fail because they rely on static inputs that break the moment market volatility shifts. Auto Optimized Parabolic RSI solves the problem of "indicator decay" by continuously recalculating its own mathematical edge, bringing institutional-grade quantitative adaptation directly to your MT5 terminal. The Core Advantage: Custom In-Memory 3D Optimization   Standard auto-optimizers often freeze the MT5 platform because the
PZ 123 Pattern
PZ TRADING SLU
1 (1)
Unlock powerful breakout opportunities The 123 Pattern is one of the most popular, powerful and flexible chart patterns. The pattern is made up of three price points: a bottom, a peak or valley, and a Fibonacci retracement between 38.2% and 71.8%. A pattern is considered valid when the price breaks beyond the last peak or valley, moment at which the indicator plots an arrow, rises an alert, and the trade can be placed. [ Installation Guide | Update Guide | Troubleshooting | FAQ | All Products  ]
Market Makers
Mohamed Hassan
5 (4)
After purchase, contact me privately to receive 1 month of free testing with EA Forex Proton! This advanced MT4 trading robot automatically executes signals from any MT4 indicator, including Market Makers. The latest version also includes AI integration, allowing each trade signal to be analyzed using Artificial Intelligence. Live Signal with EA Forex Proton: Click here Market Makers is a powerful price action trading system designed to identify high-probability Buy and Sell opportunities based
More from author
Monitor every symbol and every timeframe with your favourite indicators from a single chart. The Ultimate Indicator Dashboard gives you a complete multi-symbol, multi-indicator, multi-timeframe view — all in one clean, draggable panel. Stop flipping between charts. See RSI, MACD, Bollinger Bands, Ichimoku, ATR, volume, and more across all your instruments at a glance. Colour-coded signals show you exactly where the opportunities are, and smart alerts tell you when conditions change — so you neve
LAUNCH OFFER 30% OFF! $49 instead of $69! The Risk/Reward Tool is a professional-grade Expert Advisor designed to revolutionise the way you plan, visualise, and execute trades in MetaTrader 5. Whether you're a discretionary trader who values precise risk management or a strategy developer who needs to test trade setups visually, this tool provides everything you need in one elegant, intuitive interface. Unlike basic position calculators, the Risk/Reward Tool combines visual trade planning with
LAUNCH OFFER 30% OFF! $49 instead of $69! The Risk/Reward Tool is a professional-grade Expert Advisor designed to revolutionise the way you plan, visualise, and execute trades in MetaTrader 4. Whether you're a discretionary trader who values precise risk management or a strategy developer who needs to test trade setups visually, this tool provides everything you need in one elegant, intuitive interface. Unlike basic position calculators, the Risk/Reward Tool combines visual trade planning with
LIMITED TIME SALE - 30% OFF! WAS $50 - NOW JUST $35! Profit from market structure changes as price reverses and pulls back. The market structure reversal alert indicator identifies when a trend or price move is approaching exhaustion and ready to reverse. It alerts you to changes in market structure which typically occur when a reversal or major pullback are about to happen. The indicator identifies breakouts and price momentum initially, every time a new high or low is formed near a po
LIMITED TIME SALE - 30% OFF! WAS $50 - NOW JUST $35! The ADR Reversal Indicator shows you at a glance where price is currently trading in relation to it's normal average daily range. You will get instant alerts via pop-up, email or push when price exceeds it's average range and levels above it of your choosing so you can jump into pullbacks and reversals quickly. The indicator draws horizontal lines on the chart at the average daily range extremes and also extensions above those levels
The Market Reversal Alerts EA is powered by the indicator of the same name ( available here ) and trades based on market structure shifts. The EA will by default take a trade every time a market reversal alert is sent by the indicator and will trade those alerts based on the conditions and filters you set in the EA settings. It draws support rectangles as price moves in it's current trend direction and trades when price reverses sharply and signals a market structure shift or a re-test of the re
Position Trader EA
LEE SAMSON
4.64 (11)
Turn any trading strategy into a position trading strategy or trade the proven RSI & ADR based position trading strategies, including automated drawdown control system for positions that move against you. This EA is an evolution and a simplification of the MRA EA that has been used for position trading strategies taught on the Market Structure Trader website for many years. See my profile for a link to the website, free position trading course and other products. The EA will automatically scale
LIMITED TIME SALE - 30% OFF! WAS $50 - NOW JUST $35! Profit from market structure changes as price reverses and pulls back. The market structure reversal alert indicator identifies when a trend or price move is approaching exhaustion and ready to reverse. It alerts you to changes in market structure which typically occur when a reversal or major pullback are about to happen. The indicator identifies breakouts and price momentum initially, every time a new high or low is formed near a po
LIMITED TIME SALE - 30% OFF! WAS $50 - NOW JUST $35! This dashboard is an alert tool for use with the market structure reversal indicator. It's primary purpose is to alert you to reversal opportunities on specific time frames and also to the re-tests of the alerts (confirmation) as the indicator does. The dashboard is designed to sit on a chart on it's own and work in the background to send you alerts on your chosen pairs and timeframes. It was developed after many people requested a da
Take advantage of the opening volatility of the major stock indexes and profit from the sudden moves created at those times when the market breaks away at the opening bell. The strategies' goal is to simply benefit from those days when the market moves fast and hard in one direction at the open and bank that move. If the market opens weak and directionless, the EA locks in a hedge loss and waits for the market to decide on a direction before exiting the positions. The stock index hedge EA analys
LIMITED TIME SALE - 30% OFF! WAS $50 - NOW JUST $35! The ADR Reversal Indicator shows you at a glance where price is currently trading in relation to it's normal average daily range. You will get instant alerts via pop-up, email or push when price exceeds it's average range and levels above it of your choosing so you can jump into pullbacks and reversals quickly. The indicator draws horizontal lines on the chart at the average daily range extremes and also extensions above those levels
The Market Reversal EA is powered by the indicator of the same name ( available here ) and trades based on market structure shifts. The EA will by default take a trade every time a market reversal alert is sent by the indicator and will trade those alerts based on the conditions and filters you set in the EA settings. It draws support rectangles as price moves in it's current trend direction and trades when price reverses sharply and signals a market structure shift or a re-test of the reversal.
LIMITED TIME SALE - 30% OFF! WAS $50 - NOW JUST $35! A symmetrical triangle chart pattern represents a period of contraction & consolidation before the price is forced to breakout to the upside or breakdown. A breakdown from the lower trendline marks the start of a new bearish trend, while a breakout from the upper trendline indicates the start of a new bullish trend. Get the dashboard to monitor all instruments and time frames you trade for symmetrical triangle patterns at once! https:
LIMITED TIME SALE - 30% OFF! WAS $50 - NOW JUST $35! The RSI / TDI alert dashboard allows you to monitor RSIs at once (selectable by you) on every major pair you trade. You can use it in two ways: 1.   Select multiple time frames and the dash will show you when there are multiple time frames extended beyond normal trading conditions. A great indicator that price has pushed hard recently as it has achieved an overbought or oversold level across multiple time frames so a pullback or rever
Turn any trading strategy into a position trading strategy or trade the proven RSI & ADR based position trading strategies, including automated drawdown control system for positions that move against you. This EA is an evolution and a simplification of the MRA EA that has been used for position trading strategies taught on the Market Structure Trader website for many years. See my profile for a link to the website, free position trading course and other products. The EA will automatically scale
Stop Guessing. Start Trading with a Statistical Edge. Stock indices don't trade like forex. They have defined sessions, they gap overnight, and they follow predictable statistical patterns. This indicator gives you the probability data you need to trade indices like the DAX, S&P 500, and Dow Jones with confidence. What Makes This Different Most indicators show you what happened. This one shows you what's likely to happen next.  Every trading day, the indicator analyses your current setup against
LIMITED TIME SALE - 30% OFF! WAS $50 - NOW JUST $35! Automatically draw support and resistance levels PLUS propulsion candle gaps on your chart, so you can see where price is likely to head next and/or potentially reverse. This indicator is designed to be used as part of the position trading methodology taught on my website (The Market Structure Trader) and displays key information for targeting and potential entries. MT5 version available here:  https://www.mql5.com/en/market/product/9
LIMITED TIME SALE - 30% OFF! WAS $50 - NOW JUST $35! A symmetrical triangle chart pattern represents a period of contraction & consolidation before the price is forced to breakout to the upside or breakdown. A breakdown from the lower trendline marks the start of a new bearish trend, while a breakout from the upper trendline indicates the start of a new bullish trend. MT4 Version Available Here:  https://www.mql5.com/en/market/product/68709/ This indicator identifies these patterns and
Automatic Trade Protection EA For MT5 Overview Trade Equity Guardian is a lightweight, always-on Expert Advisor that continuously monitors all open positions on your account and automatically closes any trade that breaches your predefined risk thresholds. It acts as a safety net — protecting your account from oversized positions, runaway losses, or locking in profits when targets are hit. Attach it to any chart and let it run in the background. It works alongside your other EAs and manual trades
FREE
Profit from the explosive moves that occur at the open of stock indices and give yourself an actionable edge every day. The opening range breakout EA can be tweaked to your liking to capture the trends that form just after the open every day on the main stock indices like the DAX, DOW, NASDAQ and S&P500. These opens happen at the same time every day, so you know when volatility will occur, and often just after the open strong trends form which you can capture with this EA. The opening range is t
Profit from the explosive moves that occur at the open of stock indices and give yourself an actionable edge every day. The opening range breakout EA can be tweaked to your liking to capture the trends that form just after the open every day on the main stock indices like the DAX, DOW, NASDAQ and S&P500. These opens happen at the same time every day so you know when volatility will occur and often just after the open strong trends form which you can capture with this EA. The opening range is typ
Stop Guessing. Start Trading with a Statistical Edge. Stock indices don't trade like forex. They have defined sessions, they gap overnight, and they follow predictable statistical patterns. This indicator gives you the probability data you need to trade indices like the DAX, S&P 500, and Dow Jones with confidence. What Makes This Different Most indicators show you what happened. This one shows you what's likely to happen next.  Every trading day, the indicator analyses your current setup against
The Strat Dashboard - Multi-Symbol Pattern Scanner for Rob Smith's Strat Strategy Transform Your Trading with Real-Time Multi-Symbol Strat Analysis The Strat Dashboard   is a powerful, professional-grade indicator designed specifically for traders using Rob Smith's renowned "Strat" trading methodology. Monitor unlimited symbols across multiple timeframes simultaneously, identify high-probability setups instantly, and never miss another actionable pattern. MT4 Version :- https://www.mql5.com/en/m
Instantly see your closed trade history by day and week, your current open trades, and forex exposure on one chart! Use the heatmap to identify profitable trades and where your current drawdown is within your trading portfolio. MT5 Version -  https://www.mql5.com/en/market/product/132613 Quick Close Buttons Use the quick close buttons to close every trade on a single symbol, close out individual trades in full, or take partial profits or losses at the click of a button. No more hunting for trade
LIMITED TIME SALE - 30% OFF! WAS $50 - NOW JUST $35! The ADR Alert Dashboard shows you at a glance where price is currently trading in relation to it's normal average daily range. You will get instant alerts via pop-up, email or push when price exceeds it's average range and levels above it of your choosing so you can jump into pullbacks and reversals quickly. The dash is designed to be placed on a blank chart and just sit in the background and alert you when levels are hit so you do no
LIMITED TIME SALE - 30% OFF! WAS $50 - NOW JUST $35! The RSI / TDI alert dashboard allows you to monitor RSIs at once (selectable by you) on every major pair you trade. You can use it in two ways: 1. Select multiple time frames and the dash will show you when there are multiple time frames extended beyond normal trading conditions. A great indicator that price has pushed hard recently as it has achieved an overbought or oversold level across multiple time frames so a pullback or reversa
ADR Alert Dashboard
LEE SAMSON
3.73 (11)
LIMITED TIME SALE - 30% OFF! WAS $50 - NOW JUST $35! The ADR Alert Dashboard shows you at a glance where price is currently trading in relation to it's normal average daily range. You will get instant alerts via pop-up, email or push when price exceeds it's average range and levels above it of your choosing so you can jump into pullbacks and reversals quickly. The dash is designed to be placed on a blank chart and just sit in the background and alert you when levels are hit so you do no
LIMITED TIME SALE - 30% OFF! WAS $50 - NOW JUST $35! Take control of your forex portfolio. See instantly where you stand, whats working and whats causing you pain! MT4 VERSION AVAILABLE HERE:  https://www.mql5.com/en/market/product/58375 The Trade Manager Dashboard is designed to show you at a glance where each position you have in the forex market currently is, and make risk management and exposure to currencies easier to understand.   For traders that scale into the market gradually
LIMITED TIME SALE - 30% OFF! WAS $50 - NOW JUST $35! Take control of your forex portfolio. See instantly where you stand, whats working and whats causing you pain! MT5 VERSION AVAILABLE HERE:  https://www.mql5.com/en/market/product/58658 The Trade Manager Dashboard is designed to show you at a glance where each position you have in the forex market currently is, and make risk management and exposure to currencies easier to understand. For traders that scale into the market gradually wi
The Strat Dashboard - Multi-Symbol Pattern Scanner for Rob Smith's Strat Strategy Transform Your Trading with Real-Time Multi-Symbol Strat Analysis The Strat Dashboard is a powerful, professional-grade indicator designed specifically for traders using Rob Smith's renowned "Strat" trading methodology. Monitor unlimited symbols across multiple timeframes simultaneously, identify high-probability setups instantly, and never miss another actionable pattern. MT5 Version :-  https://www.mql5.com/en/ma
Filter:
Max
1639
Max 2025.09.05 20:57 
 

Great indicator, needs to be updated with complete settings for Stoch types like built-in stoch, look forward to RSI and MACD version and mt5

Reply to review