ADR Alert Dashboard MT5
- Indicators
- LEE SAMSON
- Version: 1.0
- Activations: 10
💲LIMITED TIME SALE - 30% OFF!💲
👉WAS $50 - NOW JUST $35!👈
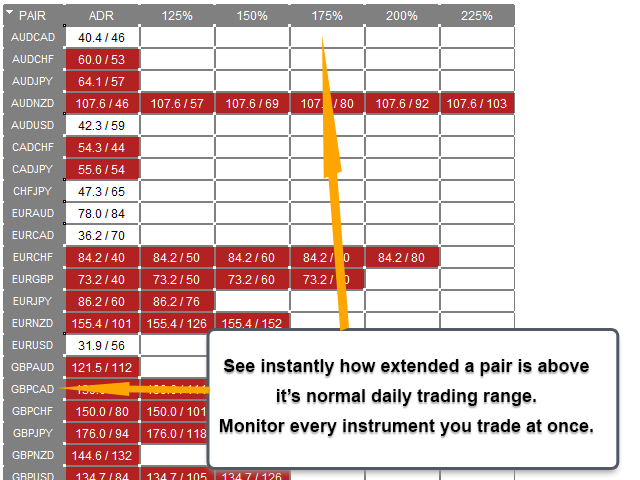
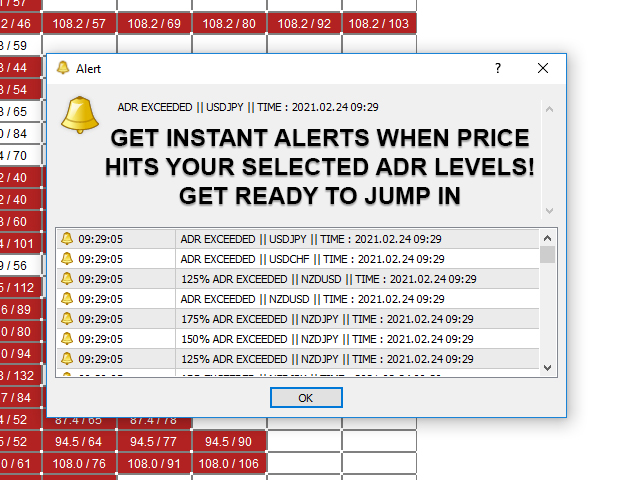
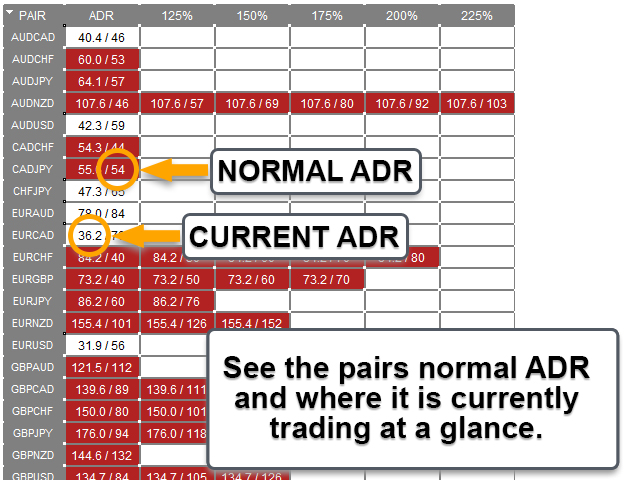
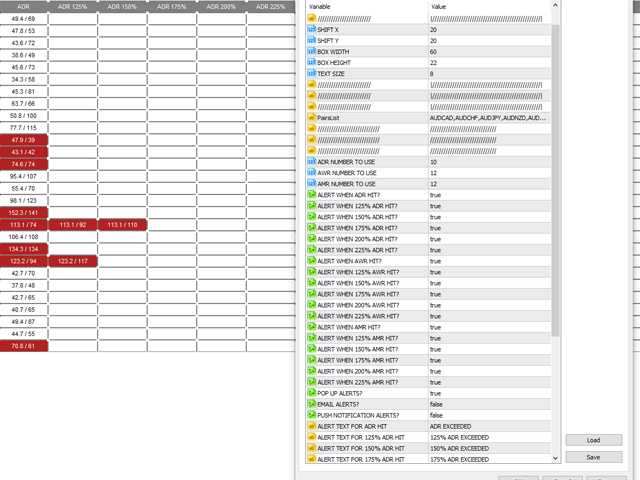
The ADR Alert Dashboard shows you at a glance where price is currently trading in relation to it's normal average daily range. You will get instant alerts via pop-up, email or push when price exceeds it's average range and levels above it of your choosing so you can jump into pullbacks and reversals quickly. The dash is designed to be placed on a blank chart and just sit in the background and alert you when levels are hit so you do not need to sit and watch it or even look at all!
MT4 VERSION AVAILABLE HERE: https://www.mql5.com/en/market/product/62756
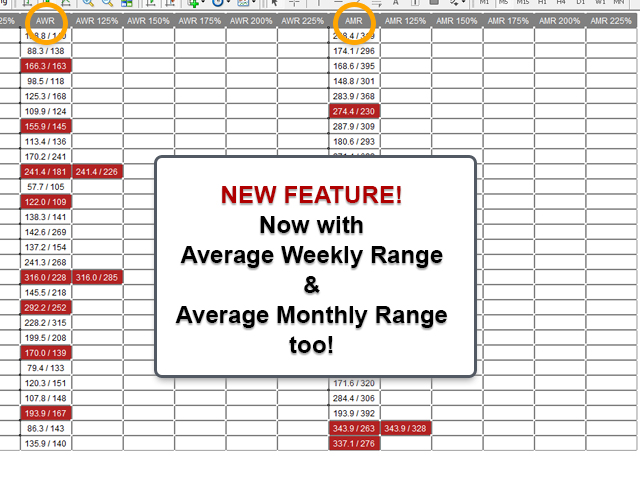
NEW: Now also shows you the average WEEKLY and MONTHLY ranges and alerts to them too!
GET THE ADR REVERSAL INDICATOR WHICH DRAWS THE LEVELS ON YOUR CHART TOO HERE: https://www.mql5.com/en/market/product/64477
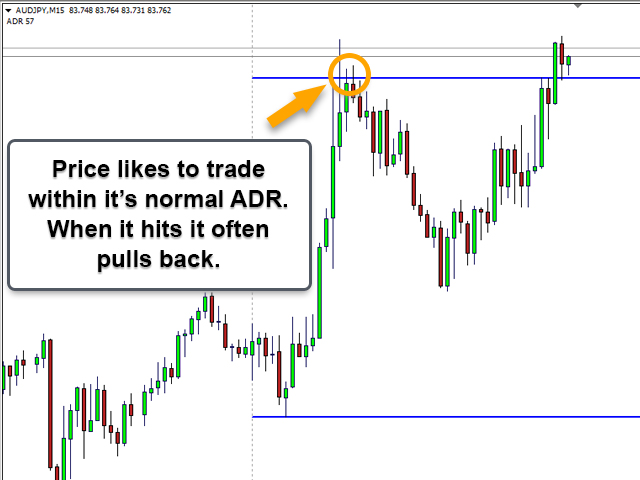
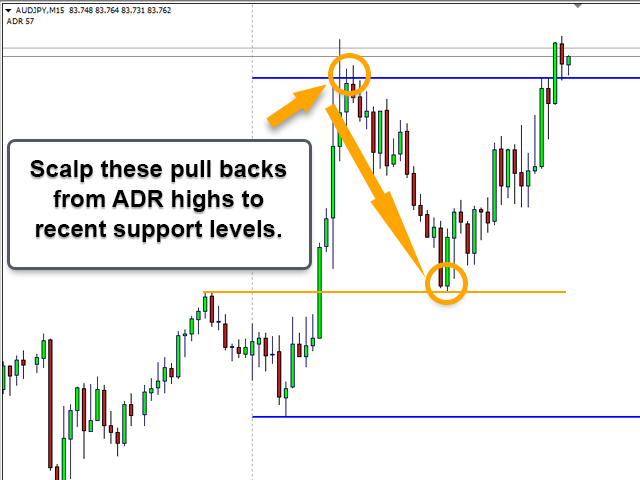
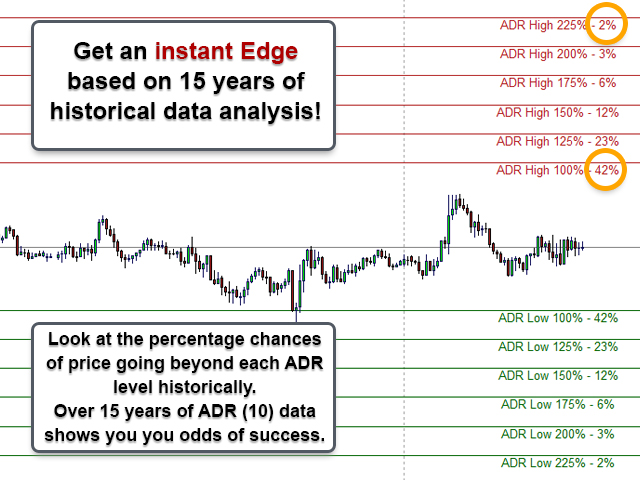
Around 60% of the time price trades within it's normal average daily range (ADR) and pushes above these levels are usually an indicator of a sharp price move which will typically have a pull back (profit take) move following it. You can take advantage of these sharp moves by trading the pull back from the top or bottom of the daily range to the most recent level of support or resistance.
Over 20 years of historical data was gathered to find the average percentage chances of price moving beyond specific ADR levels for the major forex pairs and a selection of crosses. This data indicated that price only moved beyond 200% of it's ADR 3% of the time meaning your odds of a reversal or pullback at that level would be 97%!!!
These are the ADR extension averages shown by the data:
Price exceeded 100% of ADR10 roughly 42% of the time.
Price exceeded 125% of ADR10 roughly 23% of the time.
Price exceeded 150% of ADR10 roughly 12% of the time.
Price exceeded 175% of ADR10 roughly 6% of the time.
Price exceeded 200% of ADR10 roughly 3% of the time.
Price exceeded 225% of ADR10 roughly 2% of the time.
As you can see from the levels above if price gets to 150% of it's normal ADR the odds of it going further are only 12% giving you a massive advantage. Wait for price action to show you signs of a turn at that level and jump in on the pullback!
Dashboard Settings:
- Adjust position of the dashboard and change the size of the boxes and text.
- Select the pairs you want to monitor and enter your brokers prefix or suffix if required.
- Select which ADR number to use for the levels (ADR10 is default and what the data analysis is based on).
- Choose which levels you would like to be alerted to when hit.
- Select the type of alerts you want to receive from pop-ups, emails or push alerts.
- Choose the text alert you would like for each level.
Entry Strategy Idea:
Wait for price to get to a specific level and receive an alert. The higher the level the better the chance of a reversal but the fewer alerts you will receive. When you get an alert you can either wait for a good price action candlestick pattern to form (engulfing, hammer, shooting star etc...) or you may want to use a tight EMA like EMA9 and jump in. M5 or M15 are the best timeframes to use.
For best results wait for a confirmed break in market structure on the M5 chart using the Market Reversal Alerts Indicator. (available here: https://www.mql5.com/en/market/product/46295)
These trades are meant to be scalping trades so ideally target the most recent high or low that is likely to act as a level of support or resistance. Often these ADR alerts happen in the London or NY sessions so targeting highs and lows of the Asian session is often a good idea.
Grid Trading ADR Levels:
Many people grid trade using ADR. Enter small positions at selected ADR levels (100%, 150%, 200% etc) and then as price moves over the levels you gain a position with a higher average each time a new trade triggers. This then allows more profit to be made on the pullback and a higher average price entry than just the first position taken.
Other Notes on ADR:
Be careful of ADR extensions that happen after fundamental news events.
Look out for price levels when you get an ADR alert. If there is a recent level that has just been breached it's often an indicator of a stop hunt. The market is just pushing to take out peoples stops and pullbacks or reversals are much more likely.


Great tool and very well made 5/5