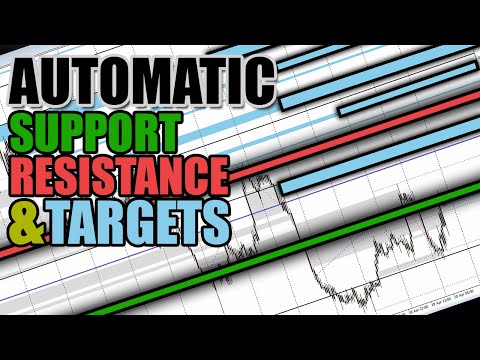
Support Resistance Propulsion Targets MT5

3.5

💲LIMITED TIME SALE - 30% OFF!💲
👉WAS $50 - NOW JUST $35!👈

Automatically draw support and resistance levels PLUS propulsion candle gaps on your chart, so you can see where price is likely to head next and/or potentially reverse.

This indicator is designed to be used as part of the position trading methodology taught on my website (The Market Structure Trader) and displays key information for targeting and potential entries.

MT4 Version: https://www.mql5.com/en/market/product/97246/

There are 2 CORE features in the indicator and 4 additional ones:

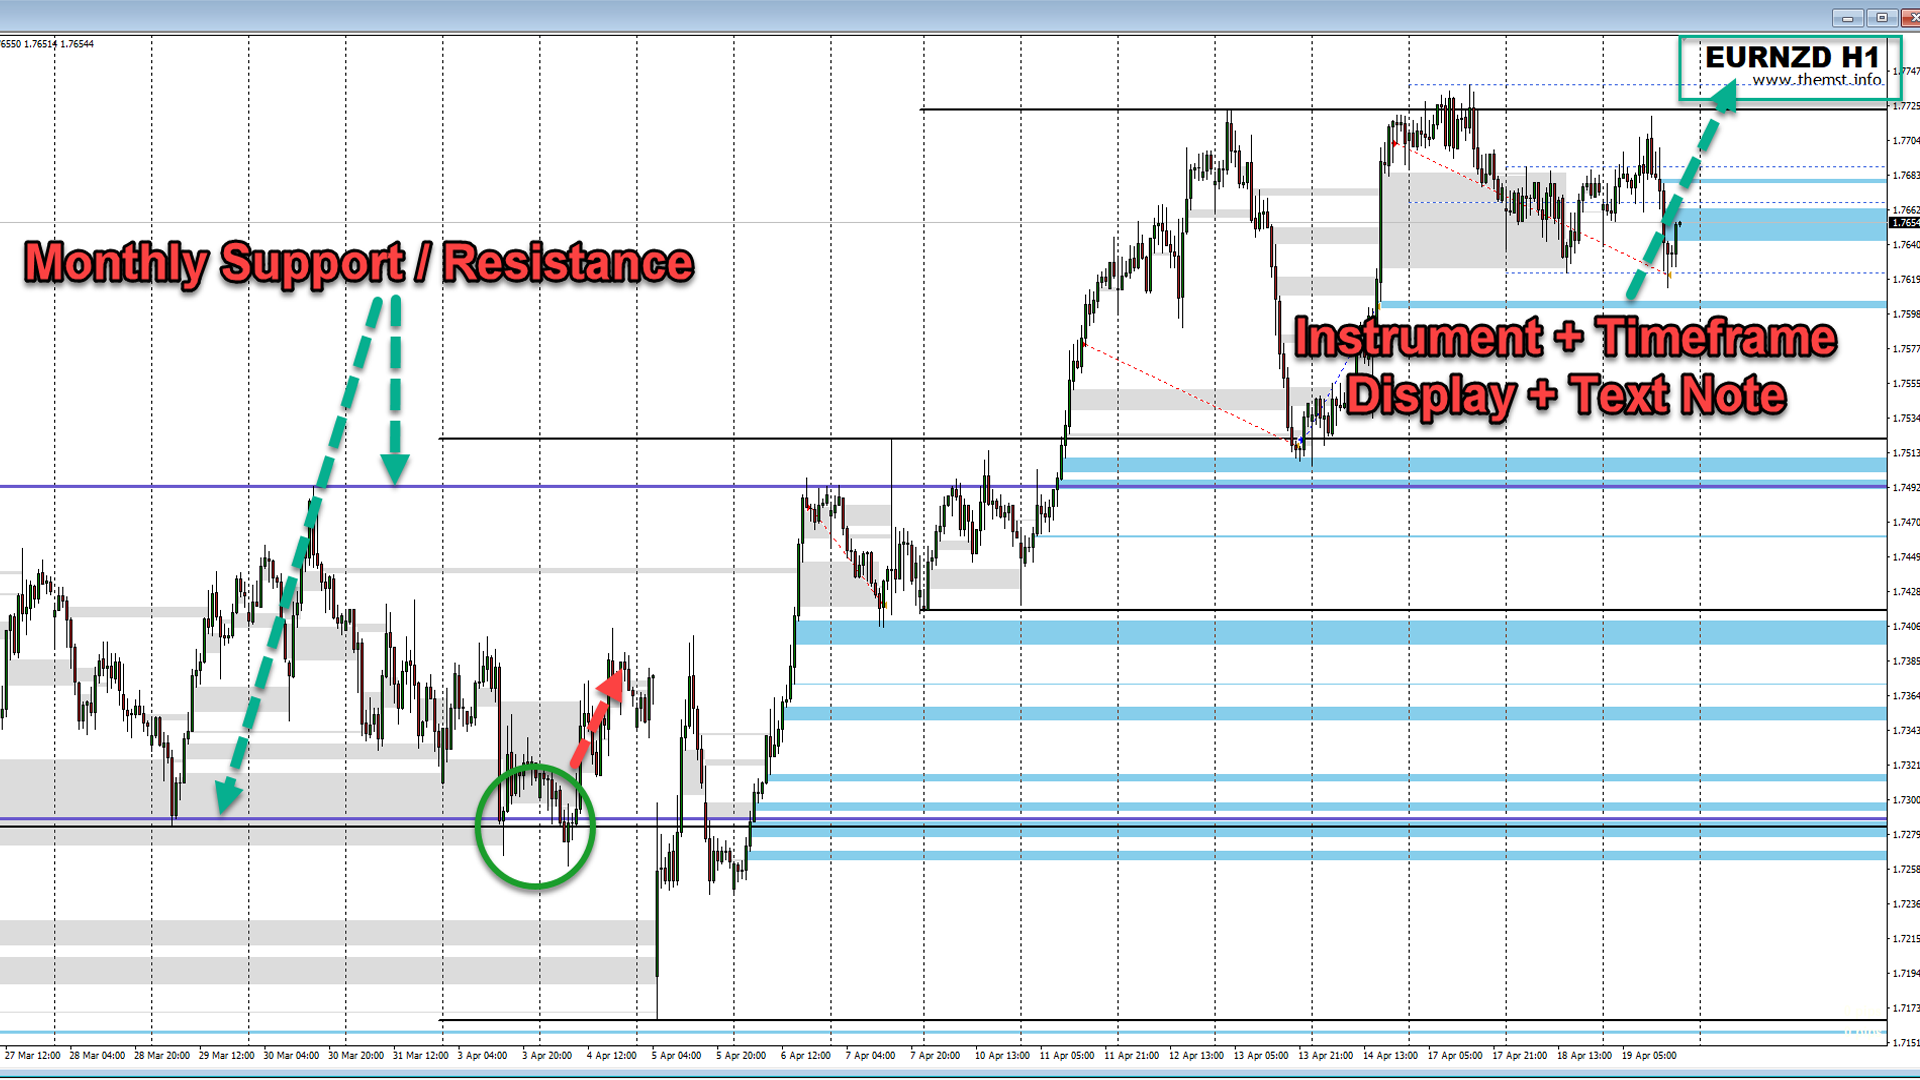
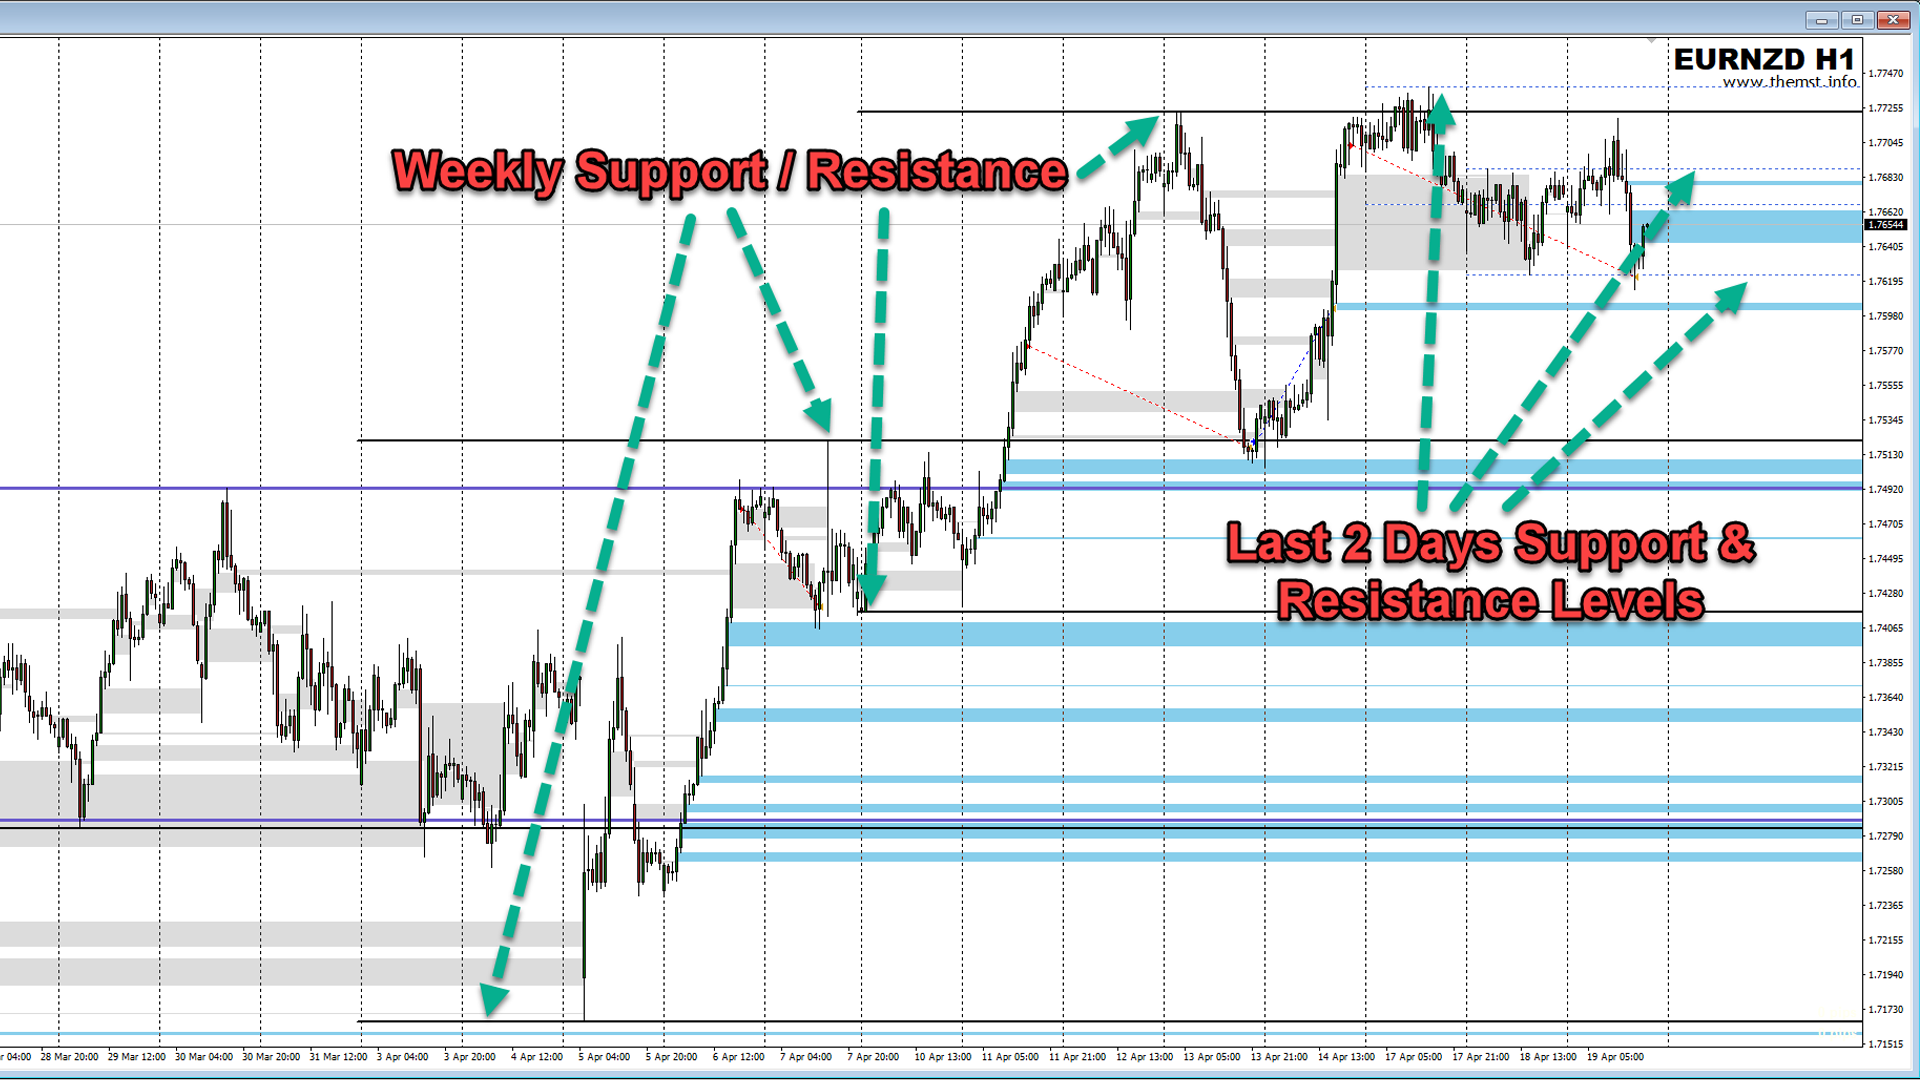
CORE FEATURE 1 - Automatic Support & Resistance Lines For Daily, Weekly & Monthly Timeframes

The indicator draws in the most recent support and resistance levels automatically from the last 2 days and up to 6 weeks and months ago for you. You can fully customize the look of these levels to suit you and display how many are shown. These key levels often act as major support and resistance zones where price will turn and either pull back from or reverse. They are also targets that price will head to, so you can quickly see the potential distance available for a trade before it is likely to turn.

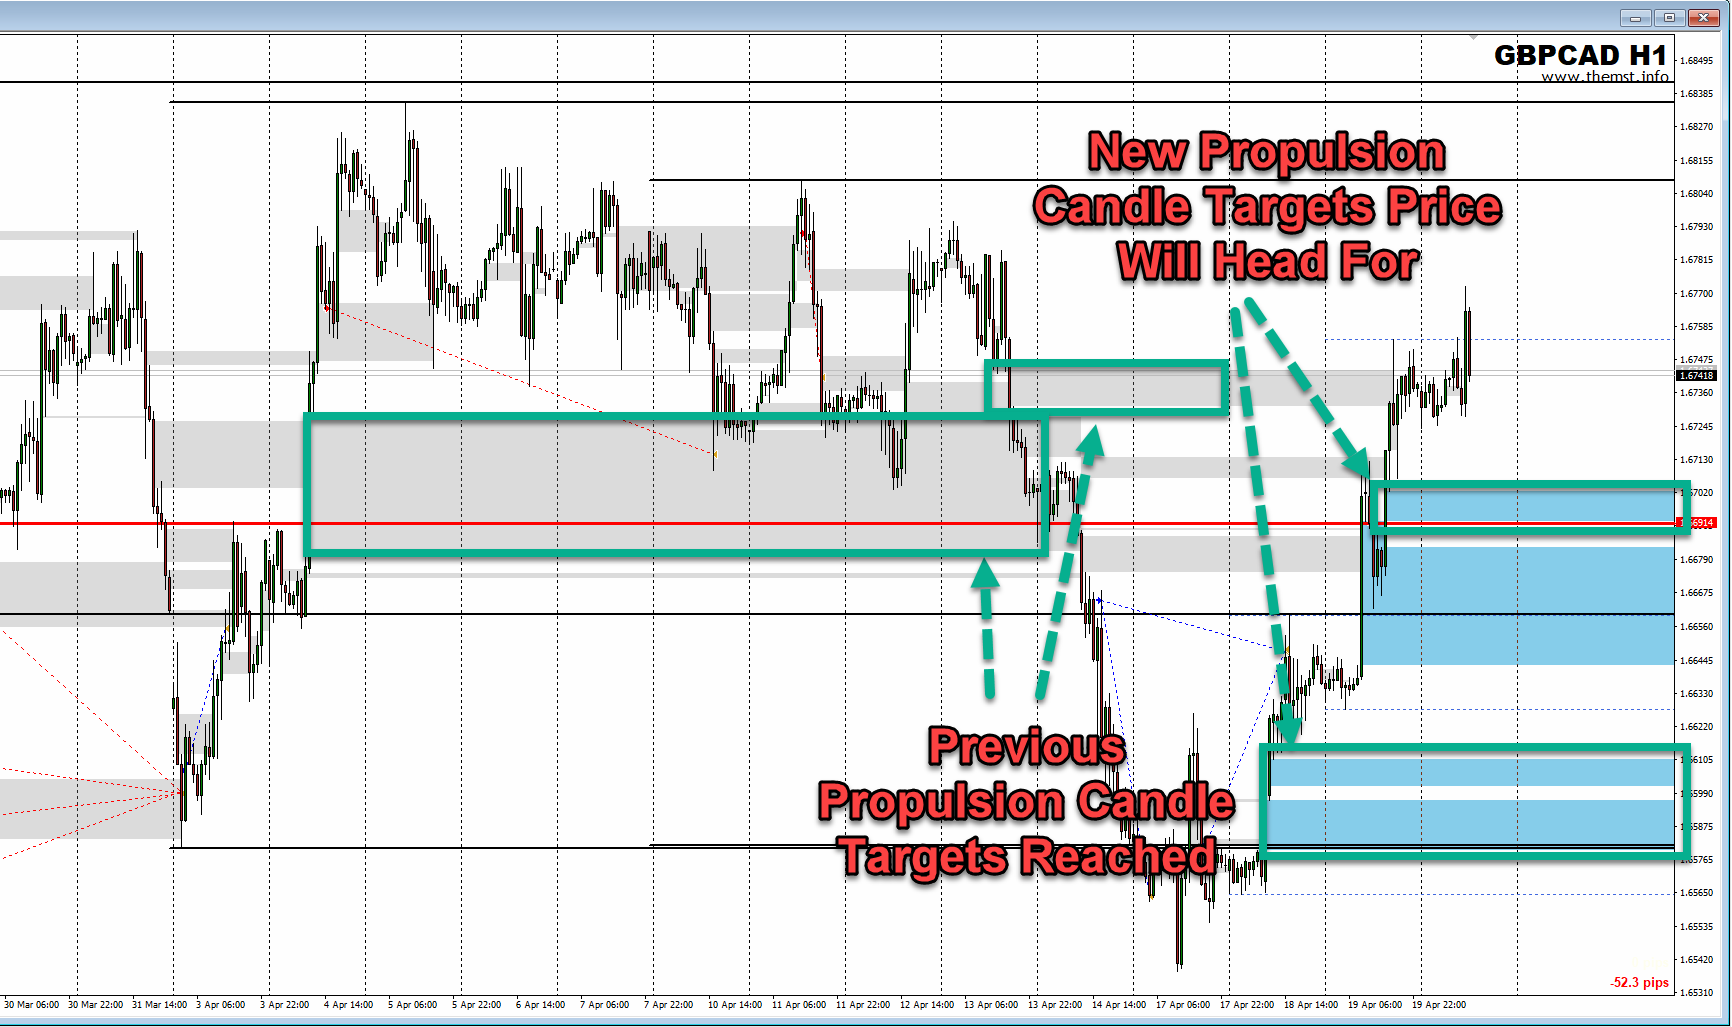
CORE FEATURE 2 - Propulsion Candle Gap Targets

Propulsion gap candles are strong, fast moves created by banks and institutions by executing large positions in any market. These large candles serve two key purposes once they have formed.

1. They act as a directional signal, as the large market participants have chosen a direction which price will often continue to move in for a period of time once they have happened.

2. More importantly, they act as targets as these areas will often leave other big player caught "offside" in their positions and price will retrace back to these levels the vast majority of the time (see screenshots).

Propulsion candle gaps are useful when entering trades, mainly for targeting purposes, so you can see where the most probable finishing point of a move will be. We know these areas are re-tested more than 90% of the time within a short period. Regardless of your reason for entering a trade, it can be hugely beneficial to KNOW WHERE PRICE IS HEADING with a high degree of certainty. You can use them for making important decisions if you trade based on risk:reward too. If you are targeting a certain risk:reward ratio with your trading, but you cannot see a potential propulsion candle gap target within your range, or you see one which is too close, this can help you decide whether a trade is viable to take or not.

***ADDITIONAL FEATURES***

Display The Instrument & Timeframe On Your Chart

Show the symbol and timeframe on the chart of the instrument you are trading, this is useful for future analysis of your trades if taking screenshots, so you can easily identify what was being traded and the time frame for analysis.

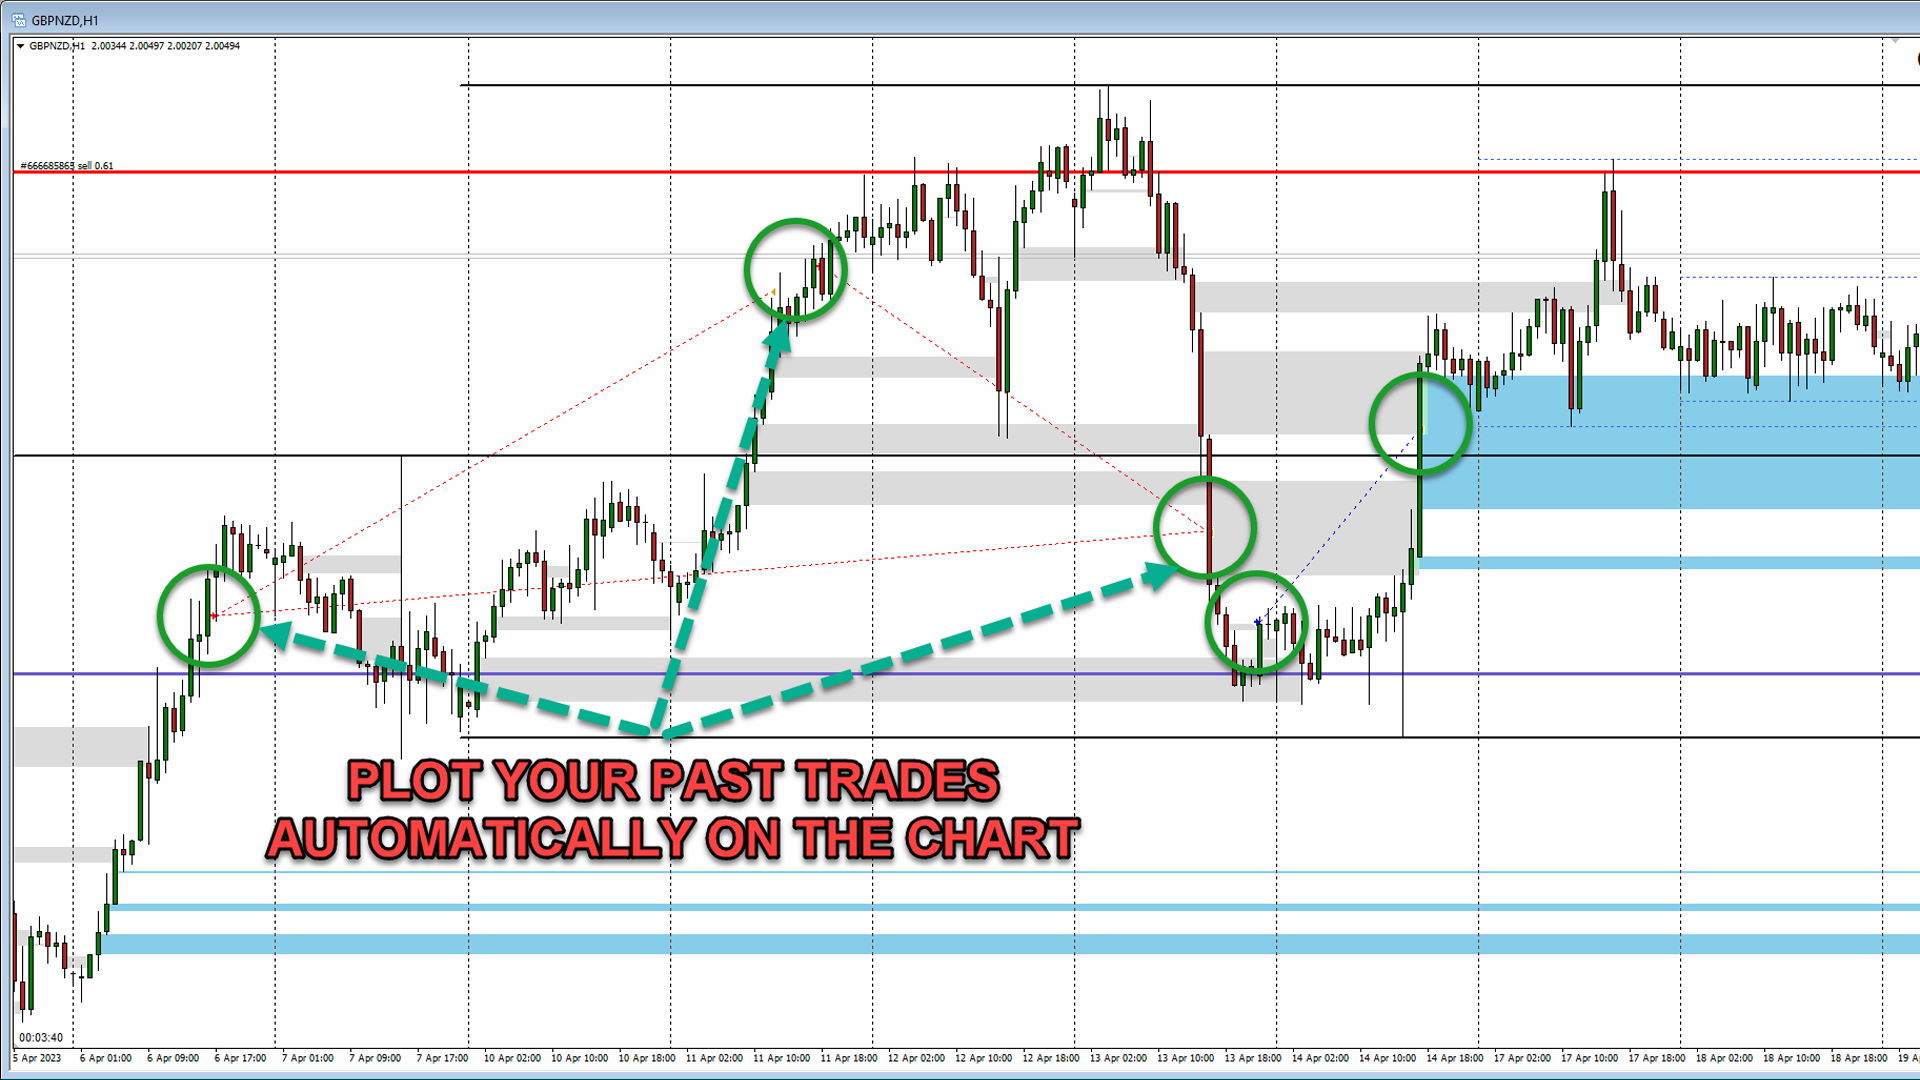
Display Trade History On Your Chart

Automatically plot your past trades plotted on your chart, so you can analyse past performance and see how good your entries and exits were to help you improve.

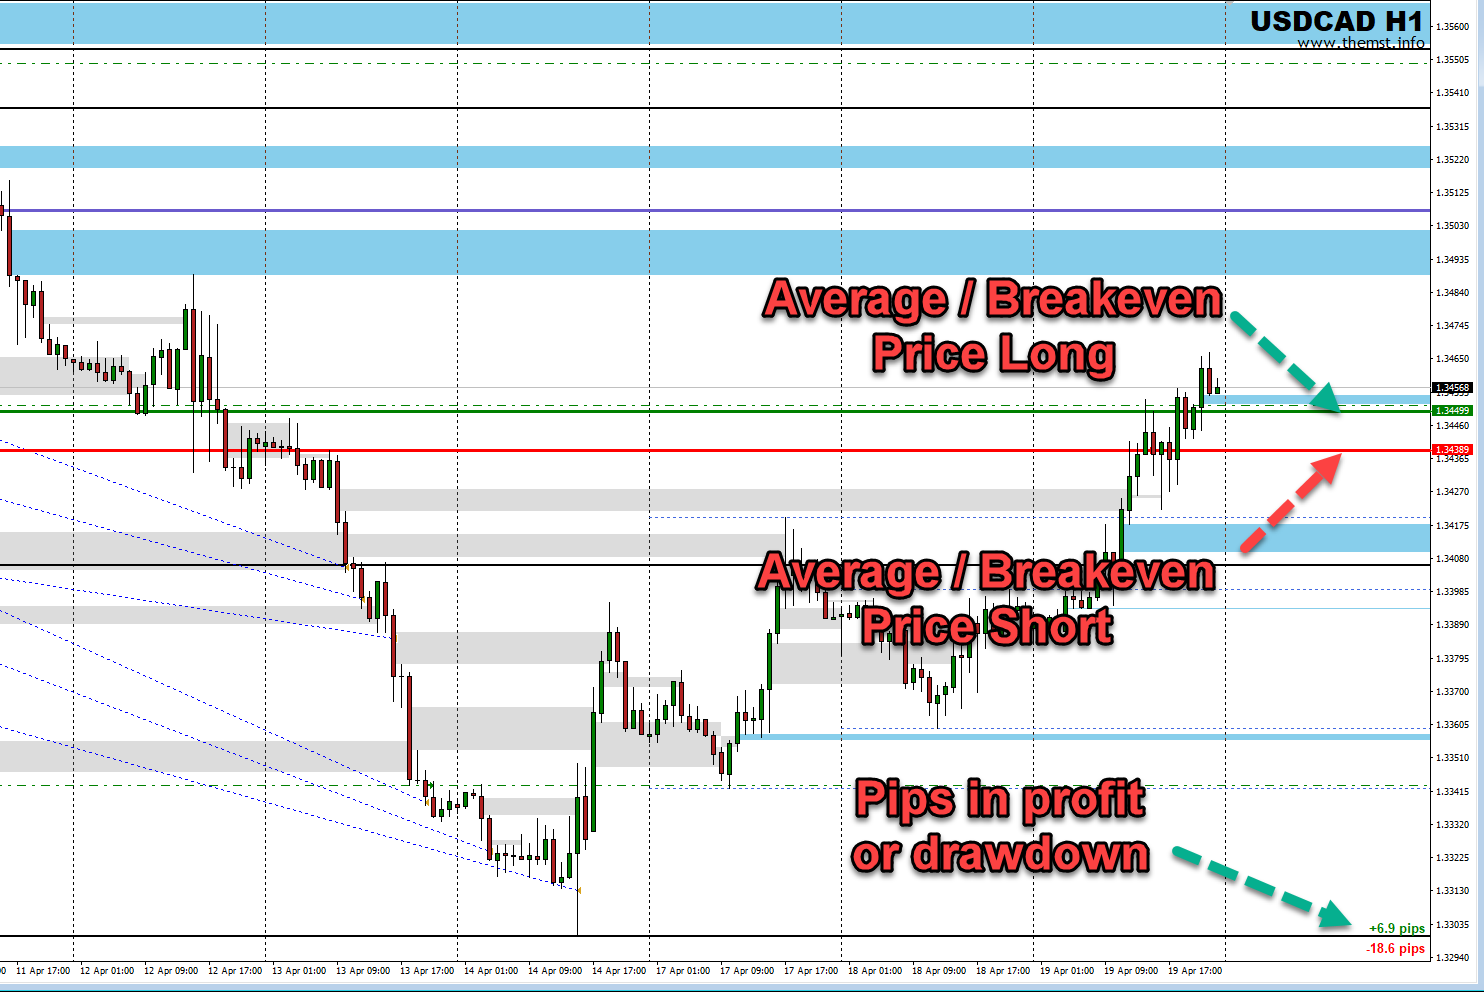
Show Your Breakeven or Average Price Level + Pips in Profit

This feature is useful for traders that scale into and out of positions with multiple trades. The breakeven line plots your average price for long and short positions separately. If you are Dollar cost averaging while you trade, hedging or using a martingale style entry method, you can instantly see where you will be back to break even on your trades. The amount of pips your trades are in either profit or drawdown is also displayed on the chart, so you can see your positions in pips too.

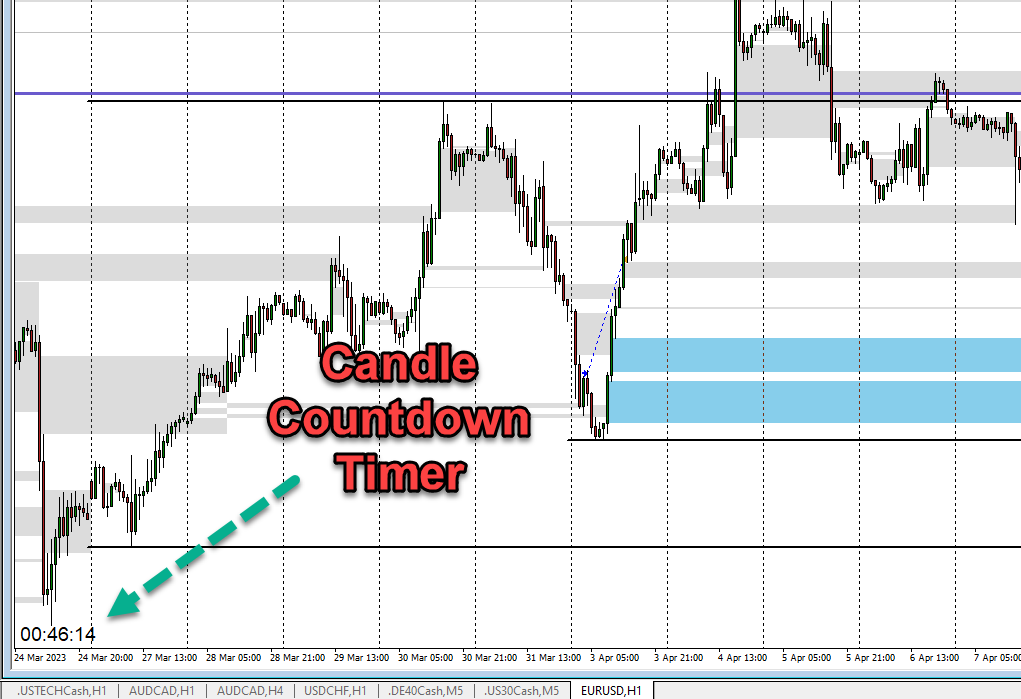
Candle Countdown Timer

Displays the amount of time left before the current candle closes on the time frame you are looking at on your chart. Very useful for scalpers or those that only enter trades when a candle has closed, so you can easily see when the next signal may occur.


Reviews 4
Betatester69
199
Betatester69 2024.05.06 20:22 
 

Quite useful indicator, shows fvg's, important highs/lows, candle timer and a few other useful things. Takes a while to load on mt5 but that is just mt5...much better on mt4 I hear but I had already bought this. Part and parcel now of the position trading strategy that I use thanks to the author.

camira
223
camira 2023.06.02 18:07 
 

absolutely good tool! Is highly recommended! Thanks Lee ;))

Recommended products
All Harmonics 26
Alexey Isavnin
3.5 (4)
Harmonic patterns are characteristic series of price movements with respect to Fibonacci levels, which statistically precede price reversals. This indicator searches for harmonic patterns. It is capable of recognising 26 classical and non-classical harmonic patterns : Classical Gartley Butterfly Alternate Butterfly Bat Alternate Bat Crab Deep Crab Three Drives Non-classical Shark Alternate Shark Cypher 5-0 Anti Gartley Anti Butterfly Anti Alternate Butterfly Anti Bat Anti Alternate Bat Anti Crab
Harmonic Pattern Hunter Harmonic Pattern Hunter is a technical indicator for MetaTrader 5 that automatically identifies and draws high-probability harmonic patterns directly on the chart. It is designed to assist traders who use harmonic analysis as part of their trading methodology. How It Works The indicator scans historical and live price data for completed XABCD harmonic structures using Fibonacci ratio validation. When a valid pattern is detected, it draws the full pattern geometry, marks t
CosmiCLab SMC FIBO CosmiCLab SMC FIBO is a professional trading indicator designed for traders who use Smart Money Concepts (SMC), market structure analysis and Fibonacci retracement levels. The indicator automatically detects market swings and builds Fibonacci levels based on the latest impulse movement. It also identifies market structure changes such as BOS (Break of Structure) and CHOCH (Change of Character), helping traders understand the current market direction. CosmiCLab SMC FIBO also pr
Trade smarter, not harder: Empower your trading with Harmonacci Patterns This is arguably the most complete harmonic price formation auto-recognition indicator you can find for the MetaTrader Platform. It detects 19 different patterns, takes fibonacci projections as seriously as you do, displays the Potential Reversal Zone (PRZ) and finds suitable stop-loss and take-profit levels. [ Installation Guide | Update Guide | Troubleshooting | FAQ | All Products  ] It detects 19 different harmonic pric
PZ Support Resistance MT5
PZ TRADING SLU
3.71 (7)
Unlock key market insights with automated support and resistance lines Tired of plotting support and resistance lines? This is a multi-timeframe indicator that detects and plots supports and resistance lines in the chart with the same precision as a human eye would. As price levels are tested over time and its importance increases, the lines become thicker and darker, making price leves easy to glance and evaluate. [ Installation Guide | Update Guide | Troubleshooting | FAQ | All Products  ] Boo
Overview Harmonic Patterns MT5 is a technical analysis indicator designed for the MetaTrader 5 platform. It identifies and displays harmonic price patterns, such as Butterfly, Cypher, Crab, Bat, Shark, and Gartley, in both bullish and bearish directions. The indicator calculates key price levels, including entry, stop loss, and three take-profit levels, to assist traders in analyzing market movements. Visual elements and customizable alerts enhance usability on the chart. Features Detects six ha
This is an MTF indicator of support and resistance levels based on Advanced ZigZag Dynamic and/or Extended Fractals indicator extremums with price labels (can be disabled). More higher TFs can be selected for MTF mode. By default, the levels are generated based on ZigZag indicator dots. Fractals indicator dots can also be used together with ZigZag or instead of it. In order to simplify the use and save CPU time, calculation is performed once per each bar at its opening. Parameters: ForcedTF - ch
The indicator automatically identifies and labels essential elements of market structure shift, including: Break of Structure (BoS): Detected when there is a significant price movement breaking previous structural points. It mark possible uptrend and downtrend lines(UP & DN, It means constantly update high and low ), and once the price breaks through these lines, mark the red (BEAR) and green (BULL) arrows. BoS typically occurs when the price decisively moves through swing lows or swing highs t
Support & Resistance indicator is a modification of the standard Bill Williams' Fractals indicator. The indicator works on any timeframes. It displays support and resistance levels on the chart and allows setting stop loss and take profit levels (you can check the exact value by putting the mouse cursor over the level). Blue dashed lines are support level. Red dashed lines are resistance levels. If you want, you can change the style and color of these lines. If the price approaches a support lev
Official BlueDigitsFx Ecosystem Access Get infrastructure updates, workflow resources, product releases, and ecosystem access through the official BlueDigitsFx ecosystem. Telegram Ecosystem Website MT4 Version BlueDigitsFx Spike And Strike Reversal MT5 — Mixed Oscillator for Market Reversal & Momentum Analysis BlueDigitsFx Spike And Strike Reversal is a composite oscillator that combines multiple indicator signals to help traders identify possible market reversals, momentum shifts, and exhau
HAS RSI Signal — Professional Trend Indicator with SL/TP Calculation HAS RSI Signal is a powerful trading tool that combines time-tested classics with modern noise-filtering algorithms. The indicator analyzes the market through the prism of Heiken Ashi Smoothed candles and the RSI oscillator, providing clear entry signals at trend reversals or when exiting overbought/oversold zones. Key Advantages: Double Filtration: Using Heiken Ashi Smoothed eliminates market "noise," while RSI confirms the mo
The SMC Venom Model BPR indicator is a professional tool for traders working within the Smart Money (SMC) concept. It automatically identifies two key patterns on the price chart: FVG   (Fair Value Gap) is a combination of three candles, in which there is a gap between the first and third candles. It forms a zone between levels where there is no volume support, which often leads to a price correction. BPR   (Balanced Price Range) is a combination of two FVG patterns that form a “bridge” - a zon
Cumulative Volume Delta MA-X MTF with Gradient Momentum This indicator performs multi-timeframe volume delta analysis for MetaTrader5. It calculates the net difference between buying and selling pressure by analyzing tick or real volume data, providing a visual representation of order flow sentiment. Indicator Logic and Features The indicator uses a mathematical approach to volume analysis: Data Sourcing: Supports both Real Volume (for Exchange assets) and OHLC Wick Proxy calculations (for Forex
Overview The Market Perspective Structure Indicator is a comprehensive MetaTrader indicator designed to provide traders with a detailed analysis of market structure across multiple timeframes. It identifies and visualizes key price action elements, including swing highs and lows, Break of Structure (BOS), Change of Character (CHOCH), internal structures, equal highs/lows, premium/discount levels, previous levels from higher timeframes, and trading session zones. With extensive customization opt
MySNR - Precision Support & Resistance Line Indicator Discounted   Price   $50  !!     Secure your lifetime access   now   before it switches to   subscription-only ! Tired of drawing levels manually or guessing where the price will react inside a thick, messy zone? Now you can save time and trade with absolute confidence using the MySNR Indicator . Unlike traditional tools that plot broad and ambiguous zones, MySNR is engineered to automatically plot exact, pinpoint Support and Resistance lines
Auto Optimized RSI   is a smart and easy-to-use arrow indicator designed for precision trading. It automatically finds the most effective RSI Buy and Sell levels for your selected symbol and timeframe using real historical data simulations. The indicator can be used as a standalone system or as part of your existing trading strategy. It is especially useful for intraday trading. Unlike traditional RSI indicators that rely on fixed 70/30 levels,   Auto Optimized RSI   dynamically adjusts its lev
Double HMA MTF for MT5
Pavel Zamoshnikov
4 (4)
This is an advanced multi-timeframe version of the popular Hull Moving Average (HMA) Features Two lines of the Hull indicator of different timeframes on the same chart. The HMA line of the higher timeframe defines the trend, and the HMA line of the current timeframe defines the short-term price movements. A graphical panel with HMA indicator data from all timeframes at the same time . If the HMA switched its direction on any timeframe, the panel displays a question or exclamation mark with a tex
"Impulses and Corrections 5" is created to help traders navigate the market situation. The indicator shows multi-time frame upward and downward "Impulses" of price movements. These impulses are the basis for determining the "Base" , which is composed of zones of corrections of price movements, as well as "Potential" zones for possible scenarios of price movement. Up and down impulses are determined based on a modified formula of Bill Williams' "Fractals" indicator. The last impulse is always "U
The   Fibonacci Confluence Toolkit   is a technical analysis tool designed to help traders identify potential price reversal zones by combining key market signals and patterns. It highlights areas of interest where significant price action or reactions are anticipated, automatically applies Fibonacci retracement levels to outline potential pullback zones, and detects engulfing candle patterns. Its unique strength lies in its reliance solely on price patterns, eliminating the need for user-define
Price Magnet — Price Density and Attraction Levels Indicator Price Magnet is a professional analytical tool designed to identify key support and resistance levels based on statistical Price Density. The indicator analyzes a specified historical period and detects price levels where the market spent the most time. These zones act as “magnets,” attracting price action or forming a structural base for potential reversals. Unlike traditional Volume Profile tools, Price Magnet focuses on price-time d
Noize Absorption Index - is the manual trading system that measures the difference of pressure between bears forces and bulls forces. Green line - is a noize free index that showing curent situation. Zero value of index shows totally choppy/flat market.Values above zero level shows how powerfull bullish wave is and values below zero measures bearish forces.Up arrow appears on bearish market when it's ready to reverse, dn arrow appears on weak bullish market, as a result of reverse expectation.
Support & Resistance Zone Indicator This indicator dynamically identifies and draws support and resistance zones based on recent price action and fractal patterns. By analyzing ZigZag pivot points and tracking price reactions (touches, bounces, and breaks), the indicator determines the strength and validity of each zone. Key Features: Multi-Timeframe Support: Can work across different timeframes. Fractal-Based Detection: Utilizes both fast and slow fractal detection to find significant swing po
Extreme Breakout Signal is a trading strategy based on price breaking key support and resistance levels. It helps identify potential trend changes and capture new upward or downward movements. Parameter Extreme Radius : A customizable parameter that can be set differently for each timeframe Key Principles Support & Resistance : Price often reacts at these levels; a breakout may indicate a new trend. Confirmation : Use volume or other indicators to confirm breakout validity. Signal Types Buy Sig
This Indicator enhances the default Relative Strength Index (RSI) by introducing several improvements. First, it visually highlights overbought and oversold regions by changing the RSI color from white to red. Second, it includes additional reference lines at 20, 40, 50, 60, and 80, providing a clearer framework for assessing RSI values. The most notable feature is the use of the middle 50-line to indicate the current market cycle. The color of the 50-line dynamically reflects the cycle: green f
Monster Harmonics Indicator is a harmonic pattern indicator. It recognizes Gartley, Bat, Crab, Butterfly, Cypher, White Swan, Black Swan, Shark and AB=CD patterns. Projected patterns that are not yet completed are recognized, too. Monster even shows the PRZ (Potential Reversal Zone). Users can add their own user defined patterns to Monster. Besides the current pattern, Monster also shows all patterns in the symbols history. Monster will provide alerts for developing patterns. Introduced by H.M.
**   All Symbols   x   All Timeframes   scan just by pressing scanner button ** Discount: The price is $50$, But now it is just $39, Limited time offer is active. *** Contact me  to send you instruction and add you in "Trend Reversal group" for sharing or seeing experiences with other users. Introduction: Trendlines are the most famous technical analysis in trading . Trendlines continually form on the charts of markets across all the different timeframes providing huge opportunities for traders
Qauters Theory GBPJPY
Brighton Mufaro Mudzingwa
QT PRO Quarters Theory GBPJPY · London Open Breakout Plots 250-pip major quarters, 125-pip half-quarters, and 25-pip minor levels on GBPJPY. Monitors the London session open (08:00 GMT) and fires a single buy or sell arrow when price breaks and closes beyond the first key level — one signal per day, no repainting How it works now: Arrows only appear between 08:00–12:00 GMT (London session) — nothing outside that window 1 arrow per day maximum — once the first valid break is found, that day is
Harmonic Patterns are utilized for predicting market turning points with precision. These patterns offer a high win rate and numerous trade opportunities within a single trading day. Our indicator identifies the most prominent Harmonic Patterns based on principles outlined in Harmonic Trading literature. **IMPORTANT NOTES:** - The indicator does not repaint, lag, or redraw. It accurately identifies patterns at the D point, ensuring reliability in pattern detection.    **HOW TO USE:** 1. Drag
Welcome to the Ultimate Harmonic Patterns recognition indicator that is focused to detect advanced patterns. The Gartley pattern, Bat pattern, and Cypher pattern  are popular technical analysis tools used by traders to identify potential reversal points in the market. Our Ultimate Harmonic Patterns recognition Indicator is a powerful tool that uses advanced algorithms to scan the markets and identify these patterns in real-time. With our Ultimate Harmonic Patterns recognition Indicator, you ca
Harmonic Pattern Structure Harmonic Pattern Structure is a professional MetaTrader 5 indicator that automatically detects classic harmonic patterns using strict Fibonacci ratio validation and XABCD price structure. Designed for traders who value precision, clean visuals, and structured analysis, the indicator highlights potential reversal zones based on price geometry, supporting consistent and objective decision-making. SUPPORTED HARMONIC PATTERNS Gartley (222) Butterfly Bat Crab Shark Cy
Buyers of this product also purchase
Neuro Poseidon MT5
Daria Rezueva
4.97 (34)
Neuro Poseidon is a new indicator by Daria Rezueva. It combines precise trading signals with adaptive TP/SL levels - creating best possible trades as a result! Message me and get  Neuro Poseidon Assistant  as a gift to automize your trading process! What makes it stand out? 1. Proven profitability on all assets and timeframes 2. Only confirmed BUY and SELL signals present on the chart 3. Adaptive TP & SL levels generated by the software for each trade 4. Easy to understand - suitable for al
SuperScalp Pro
Van Minh Nguyen
4.65 (26)
SuperScalp Pro – Advanced Multi-Filter Scalping Indicator System SuperScalp Pro is an advanced scalping indicator that combines the classic Supertrend with multiple intelligent confirmation filters to help identify trading opportunities. It works efficiently across multiple timeframes from M1 to H4, with optimized performance on XAUUSD, BTCUSD, and major Forex pairs. The indicator provides clear Buy and Sell signals, along with automatically calculated entry price, stop loss, and take profit lev
Price will increase by $20 every 10 buyers to maintain premium value. After purchase, contact via   MQL5 inbox   to receive your buyer kit and bonus. Let's be honest first. No indicator will make you profitable on its own. If someone tells you otherwise, they're selling you a dream. Every indicator that shows perfect buy/sell arrows can be made to look flawless — just zoom into the right window of history and screenshot the winners. We won't do that. SMC Intraday Formula is a tool. It reads the
Divergence Bomber
Ihor Otkydach
4.9 (90)
Each buyer of this indicator also receives the following for free: The custom utility "Bomber Utility", which automatically manages every trade, sets Stop Loss and Take Profit levels, and closes trades according to the rules of this strategy Set files for configuring the indicator for various assets Set files for configuring Bomber Utility in the following modes: "Minimum Risk", "Balanced Risk", and "Wait-and-See Strategy" A step-by-step video manual to help you quickly install, configure, and s
Entry In The Zone and SMC Multi Timeframe is a real-time 2-in-1 market analysis tool that combines market structure analysis and a No Repaint BUY / SELL signal system into a single indicator, built on Smart Money Concepts (SMC) — a widely adopted framework used by professional traders to understand market structure. This indicator helps you see the market more clearly, make decisions based on structure rather than guesswork, and focus on high-probability zones where price is more likely to react
Quantum TrendPulse
Bogdan Ion Puscasu
5 (25)
Introducing Quantum TrendPulse , the ultimate trading tool that combines the power of SuperTrend , RSI , and Stochastic into one comprehensive indicator to maximize your trading potential. Designed for traders who seek precision and efficiency, this indicator helps you identify market trends, momentum shifts, and optimal entry and exit points with confidence. Key Features: SuperTrend Integration: Easily follow the prevailing market trend and ride the wave of profitability. RSI Precision: Detect
This product was updated for the 2026 market and optimized for the latest MT5 builds . PRICE UPDATE NOTICE: Smart Trend Trading System is currently available for $99. The price will increase to $199 after the next 30 purchases. SPECIAL OFFER:  After purchasing Smart Trend Trading System, send me a private message to claim the Smart Universal EA for FREE and turn your Smart Trend signals into automated trades. Smart Trend Trading System is a complete non-repainting, non-redrawing, and non-laggi
M1 Quantum MT5
Hamed Dehgani
5 (1)
M1 Quantum is a professional M1 trading system that provides fast and accurate trading signals with built-in Stop Loss, Take Profit, and smart money management. M1 Quantum is contain professional money management designed to grow up account fast by focusing on continues win . Key features of M1 Quantion Indicator Designed for M1 Time Frame and all Major Pairs All trade has stop loss and take profit Money Management implement and guide trader how to trade by that much easy. High win rate , high r
SignalTech is an unique fully rule based trading system delivers an Institutional approach for both Independent Traders and Prop Firm Challengers. Never Repaint. Push Notification available. No over-optimization. All the winning trades with chart setups are published on the comments page. 2026-05 4107 Pips (Until 05-29 NY Closed) 2026-04 2243 Pips 2026-03 2165 Pips 2026-02 2937 Pips 2026-01 2624 Pips 2025-12 1174 Pips It can generate signals with Buy/Sell Arrows, Push Notification (To Mobile) an
Trend Catcher ind mt5
Ramil Minniakhmetov
5 (5)
TREND CATCHER INDICATOR Trend Catcher Indicator analyzes market price movements, using a combination of the author’s proprietary and customized adaptive trend-analysis indicators.  It identifies the true market direction by filtering out short-term noise and focusing on underlying momentum strength, volatility expansion, and price structure behavior.  It also uses a combination of smoothing and trend-filtering customized indicators such as moving averages, RSI, and volatility filters.   Real ope
PrimeScalping
Temirlan Kdyrkhan
PrimeScalping is a powerful trading companion designed to generate high-probability entry signals with dynamic TP/SL/DP levels based on volatility. Built-in performance tracking shows win/loss stats, PP1/PP2 hits, and success rates — all updated live. Key Features: Buy/Sell signals with adaptive volatility bands Real-time TP/SL/DP levels based on ATR Built-in MA Filter with optional ATR/StdDev volatility Performance stats panel (Success, Profit/Loss, PP1/PP2) Alerts via popup, sound, push, or e
Power Candles MT5
Daniel Stein
5 (8)
Power Candles V3 - Self-Optimizing Strength Indicator Power Candles V3 turns currency and instrument strength into an actionable trade plan on every chart it is attached to. Instead of just coloring candles, it runs a live auto-optimization in the background and hands you the best Stop Loss, Take Profit and signal threshold for the symbol in front of you. One click adopts it for live trading - entry, Stop Loss and Take Profit rays appear on the chart at the exact prices, and alerts fire with dir
FX Trend MT5 NG
Daniel Stein
5 (6)
FX Trend NG: The Next Generation Multi-Market Trend Intelligence Overview FX Trend NG is a professional multi-timeframe trend and market monitoring tool designed to give you a complete structural overview of the market in seconds. Instead of switching between dozens of charts, you instantly see which symbols are trending, where momentum is fading, and where strong alignment exists across timeframes. This tool is part of the Stein Investments ecosystem - 18+ tools plus Max, your 1-on-1 AI tradi
GoldenX Entry MT5
Kareem Abbas
5 (11)
Price will increase by $20 every 10 buyers to maintain premium value. After purchase, contact via   MQL5 inbox   to receive your buyer kit and bonus. You have probably tested dozens of indicators before. But we are not here to be “just another signals indicator.” Behind GoldenX Entry is intensive research & development focused on building sophisticated algorithms designed to adapt to the real behavior of every instrument — not generic signals recycled everywhere else. From advanced Auto Optim
The  UZFX {SSS} Scalping Smart Signals MT5  is a Non Repaint high-performance trading indicator designed for S calpers, Day Traders, and Swing Traders  who demand  accurate, real-time signals  in fast-moving markets. Developed by  (UZFX-LABS) , this indicator combines  price action analysis, trend confirmation, and smart filtering  to generate high-probability  buy and sell signals  across all currency pairs and timeframes. I RECOMMENDED*  BEST   TIME FRAMES : 15M AND ABOVE. {1H} IS MY FAVORITE.
Meridian Pro
Ottaviano De Cicco
5 (2)
Meridian Pro 2.00: Professional Multi-Timeframe Trend Matrix for MT5 Meridian Pro 2.00 is a professional adaptive trend matrix for MetaTrader 5. It combines the original Meridian trend engine, a clean chart ribbon, closed-bar signal arrows, an 8-timeframe dashboard, Fuel momentum, weighted consensus, synthetic HTF processing and chart-native higher-timeframe context lines. The goal is simple: read current trend, multi-timeframe structure, strength, momentum and EA-ready state from one discipline
Gann Made Easy   is a professional and easy to use Forex trading system which is based on the best principles of trading using the theory of W.D. Gann. The indicator provides accurate BUY and SELL signals including Stop Loss and Take Profit levels. You can trade even on the go using PUSH notifications. PLEASE CONTACT ME AFTER PURCHASE TO GET TRADING  INSTRUCTIONS   AND GREAT EXTRA INDICATORS   FOR FREE! Probably you already   heard   about the Gann trading methods before. Usually the Gann theory
FX Power MT5 NG
Daniel Stein
5 (32)
FX Power: Analyze Currency Strength for Smarter Trading Decisions Overview FX Power is your go-to tool for understanding the real strength of currencies and Gold in any market condition. By identifying strong currencies to buy and weak ones to sell, FX Power simplifies trading decisions and uncovers high-probability opportunities. Whether you’re looking to follow trends or anticipate reversals using extreme delta values, this tool adapts seamlessly to your trading style. Don’t just trade—trade
SmartScalping
Temirlan Kdyrkhan
SmartScalping is a powerful trading companion designed to generate high-probability entry signals with dynamic TP/SL/DP levels based on volatility. Built-in performance tracking shows win/loss stats, PP1/PP2 hits, and success rates — all updated live. Key Features: Buy/Sell signals with adaptive volatility bands Real-time TP/SL/DP levels based on ATR Built-in MA Filter with optional ATR/StdDev volatility Performance stats panel (Success, Profit/Loss, PP1/PP2) Alerts via popup, sound, push, or e
ARIPoint
Temirlan Kdyrkhan
1 (1)
ARIPoint is a powerful trading companion designed to generate high-probability entry signals with dynamic TP/SL/DP levels based on volatility. Built-in performance tracking shows win/loss stats, PP1/PP2 hits, and success rates all updated live. Key Features: Buy/Sell signals with adaptive volatility bands Real-time TP/SL/DP levels based on ATR Built-in MA Filter with optional ATR/StdDev volatility Performance stats panel (Success, Profit/Loss, PP1/PP2) Alerts via popup, sound, push, or email Cu
TrendProMaster
Temirlan Kdyrkhan
MasterTrend Indicator for MT5 A powerful trend-following and signal-evaluation tool MasterTrend   is a custom MT5 indicator that combines Moving Averages and ATR-based risk/reward logic to generate clear buy/sell signals. It visualizes dynamic SL/TP levels, evaluates past trade outcomes, and displays win/loss statistics in a clean on-chart panel. Key features include: Buy/Sell signals based on MA crossovers ATR-based SL/TP1/TP2/TP3 levels with visual lines and labels Signal outcome tracking wit
Crystal Heikin Ashi Signals
Muhammad Jawad Shabir
5 (2)
Crystal Heikin Ashi Signals - Professional Trend & Signal Detection Indicator Advanced Heikin Ashi Visualization with Intelligent Signal System for Manual & Automated Trading Final Price: $149 ---------> Price goes up $10 after every 10 sales . Limited slots available — act fast . Overview Crystal Heikin Ashi Signals is a professional-grade MetaTrader 5 indicator that combines pure Heikin Ashi candle visualization with an advanced momentum-shift detection system. Designed for both manual traders
Atomic Analyst MT5
Issam Kassas
4.26 (35)
This product was updated for the 2026 market and optimized for the latest MT5 builds. PRICE UPDATE NOTICE: Atomic Analyst is currently available for $99. The price will increase to $199 after the next 30 purchases . SPECIAL OFFER:  After purchasing Atomic Analyst, send me a private message to claim the Smart Universal EA for FREE and turn your Atomic Analyst signals into automated trades. Atomic Analyst is a non-repainting, non-redrawing, and non-lagging price action trading indicator designed
Azimuth Pro
Ottaviano De Cicco
5 (7)
Azimuth Pro V2: Synthetic Fractal Structure and Confirmed Entries for MT5 Overview Azimuth Pro is a multi-level swing structure indicator by Merkava Labs . Four nested swing layers, swing-anchored VWAP, ABC pattern detection, three-timeframe structural filtering, and closed-bar confirmed entries — one chart, one workflow from micro-swings to macro-cycles. This is not a blind signal product. It is a structure-first workflow for traders who care about location, context, and timing. V2 Launch Offe
ScalpPoint
Temirlan Kdyrkhan
ScalpPoint is a powerful trading companion designed to generate high-probability entry signals with dynamic TP/SL/DP levels based on volatility. Built-in performance tracking shows win/loss stats, PP1/PP2 hits, and success rates — all updated live. Key Features: Buy/Sell signals with adaptive volatility bands Real-time TP/SL/DP levels based on ATR Built-in MA Filter with optional ATR/StdDev volatility Performance stats panel (Success, Profit/Loss, PP1/PP2) Alerts via popup, sound, push, or emai
Reversion King Indicator
Eugen-alexandru Zibileanu
5 (4)
A new King in town - Indicator + Order management indications(tp1+tp2+tp3) + Optional Telegram Signal sender   INCLUDED (FREE) ( FULL TRADING  and SIGNAL SYSTEM ) Our best EA for Gold: Gold Slayer  This indicator includes an advanced Strategy, a trading system with customisable order management and a mean reversion system that combines envelope extensions, backed by multiple intelligent confirmation filters like RSI to catch high probability reversal entries with BUY and SELL signals . The indi
Market Structure Order Block Dashboard MT5 is an MT5 indicator designed for traders who want to read market structure and the main price reaction zones directly on the chart. It combines BOS, ChoCH, Order Blocks, Fair Value Gaps (FVG), Liquidity, Kill Zones, Volume Profile, and a compact dashboard for quick analysis. This indicator targets traders who use market structure, ICT and Smart Money concepts as a decision framework. It can help spot trend continuations, possible reversals, price imbala
Quant Direction MT5
Georgios Kalomoiropoulos
Quant Direction is a 3 dimensional market analysis tool. It provides a purely objective, algorithmic view of the market by calculating exact percentage-based biases across multiple dimensions simultaneously. Developed utilizing advanced AI modeling tools and subjected to thorough testing, this algorithm is engineered to read the market with unique precision. It can analyze any currency pair or financial instrument available on your platform.  Quant Direction is the ideal tool whether you are a S
Meravith MT5
Ivan Stefanov
5 (1)
MERAVITH provides complete liquidity map of the analyzed market. Hedge funds tool. It performs all calculations automatically using a proprietary volume-weighted average price methodology, eliminating subjective interpretation entirely. Meravith will: Analyze all timeframes and display the current trend in force. Highlight liquidity zones (volume equilibrium) where bullish and bearish volumes are equal. Display all liquidity levels across different timeframes directly on your chart. Generate an
This product was  updated  for the  2026 market  and  optimized  for the  latest MT5 builds . PRICE UPDATE NOTICE: MENA Trend Scanner Pro  is currently available for $99. The price will  increase to $199  after the next  30 purchases. SPECIAL OFFER: After purchasing , send me a private message to claim the Smart Universal EA for FREE and turn your Smart Trend signals into automated trades. First of all Its worth emphasizing here that this Trading System is  Non-Repainting , Non Redrawing and
More from author
Stop Guessing. Start Trading with a Statistical Edge. Stock indices don't trade like forex. They have defined sessions, they gap overnight, and they follow predictable statistical patterns. This indicator gives you the probability data you need to trade indices like the DAX, S&P 500, and Dow Jones with confidence. What Makes This Different Most indicators show you what happened. This one shows you what's likely to happen next.  Every trading day, the indicator analyses your current setup against
LIMITED TIME SALE - 30% OFF! WAS $50 - NOW JUST $35! Profit from market structure changes as price reverses and pulls back. The market structure reversal alert indicator identifies when a trend or price move is approaching exhaustion and ready to reverse. It alerts you to changes in market structure which typically occur when a reversal or major pullback are about to happen. The indicator identifies breakouts and price momentum initially, every time a new high or low is formed near a po
The Market Reversal Alerts EA is powered by the indicator of the same name ( available here ) and trades based on market structure shifts. The EA will by default take a trade every time a market reversal alert is sent by the indicator and will trade those alerts based on the conditions and filters you set in the EA settings. It draws support rectangles as price moves in it's current trend direction and trades when price reverses sharply and signals a market structure shift or a re-test of the re
LIMITED TIME SALE - 30% OFF! WAS $50 - NOW JUST $35! Profit from market structure changes as price reverses and pulls back. The market structure reversal alert indicator identifies when a trend or price move is approaching exhaustion and ready to reverse. It alerts you to changes in market structure which typically occur when a reversal or major pullback are about to happen. The indicator identifies breakouts and price momentum initially, every time a new high or low is formed near a po
LIMITED TIME SALE - 30% OFF! WAS $50 - NOW JUST $35! The ADR Reversal Indicator shows you at a glance where price is currently trading in relation to it's normal average daily range. You will get instant alerts via pop-up, email or push when price exceeds it's average range and levels above it of your choosing so you can jump into pullbacks and reversals quickly. The indicator draws horizontal lines on the chart at the average daily range extremes and also extensions above those levels
Take advantage of the opening volatility of the major stock indexes and profit from the sudden moves created at those times when the market breaks away at the opening bell. The strategies' goal is to simply benefit from those days when the market moves fast and hard in one direction at the open and bank that move. If the market opens weak and directionless, the EA locks in a hedge loss and waits for the market to decide on a direction before exiting the positions. The stock index hedge EA analys
LIMITED TIME SALE - 30% OFF! WAS $50 - NOW JUST $35! The ADR Reversal Indicator shows you at a glance where price is currently trading in relation to it's normal average daily range. You will get instant alerts via pop-up, email or push when price exceeds it's average range and levels above it of your choosing so you can jump into pullbacks and reversals quickly. The indicator draws horizontal lines on the chart at the average daily range extremes and also extensions above those levels
The Market Reversal EA is powered by the indicator of the same name ( available here ) and trades based on market structure shifts. The EA will by default take a trade every time a market reversal alert is sent by the indicator and will trade those alerts based on the conditions and filters you set in the EA settings. It draws support rectangles as price moves in it's current trend direction and trades when price reverses sharply and signals a market structure shift or a re-test of the reversal.
Monitor every symbol and every timeframe with your favourite indicators from a single chart. The Ultimate Indicator Dashboard gives you a complete multi-symbol, multi-indicator, multi-timeframe view — all in one clean, draggable panel. Stop flipping between charts. See RSI, MACD, Bollinger Bands, Ichimoku, ATR, volume, and more across all your instruments at a glance. Colour-coded signals show you exactly where the opportunities are, and smart alerts tell you when conditions change — so you neve
LAUNCH OFFER 30% OFF! $49 instead of $69! The Risk/Reward Tool is a professional-grade Expert Advisor designed to revolutionise the way you plan, visualise, and execute trades in MetaTrader 5. Whether you're a discretionary trader who values precise risk management or a strategy developer who needs to test trade setups visually, this tool provides everything you need in one elegant, intuitive interface. Unlike basic position calculators, the Risk/Reward Tool combines visual trade planning with
Position Trader EA
LEE SAMSON
4.64 (11)
Turn any trading strategy into a position trading strategy or trade the proven RSI & ADR based position trading strategies, including automated drawdown control system for positions that move against you. This EA is an evolution and a simplification of the MRA EA that has been used for position trading strategies taught on the Market Structure Trader website for many years. See my profile for a link to the website, free position trading course and other products. The EA will automatically scale
LAUNCH OFFER 30% OFF! $49 instead of $69! The Risk/Reward Tool is a professional-grade Expert Advisor designed to revolutionise the way you plan, visualise, and execute trades in MetaTrader 4. Whether you're a discretionary trader who values precise risk management or a strategy developer who needs to test trade setups visually, this tool provides everything you need in one elegant, intuitive interface. Unlike basic position calculators, the Risk/Reward Tool combines visual trade planning with
Turn any trading strategy into a position trading strategy or trade the proven RSI & ADR based position trading strategies, including automated drawdown control system for positions that move against you. This EA is an evolution and a simplification of the MRA EA that has been used for position trading strategies taught on the Market Structure Trader website for many years. See my profile for a link to the website, free position trading course and other products. The EA will automatically scale
LIMITED TIME SALE - 30% OFF! WAS $50 - NOW JUST $35! A symmetrical triangle chart pattern represents a period of contraction & consolidation before the price is forced to breakout to the upside or breakdown. A breakdown from the lower trendline marks the start of a new bearish trend, while a breakout from the upper trendline indicates the start of a new bullish trend. Get the dashboard to monitor all instruments and time frames you trade for symmetrical triangle patterns at once! https:
LIMITED TIME SALE - 30% OFF! WAS $50 - NOW JUST $35! This dashboard is an alert tool for use with the market structure reversal indicator. It's primary purpose is to alert you to reversal opportunities on specific time frames and also to the re-tests of the alerts (confirmation) as the indicator does. The dashboard is designed to sit on a chart on it's own and work in the background to send you alerts on your chosen pairs and timeframes. It was developed after many people requested a da
LIMITED TIME SALE - 30% OFF! WAS $50 - NOW JUST $35! The RSI / TDI alert dashboard allows you to monitor RSIs at once (selectable by you) on every major pair you trade. You can use it in two ways: 1.   Select multiple time frames and the dash will show you when there are multiple time frames extended beyond normal trading conditions. A great indicator that price has pushed hard recently as it has achieved an overbought or oversold level across multiple time frames so a pullback or rever
LIMITED TIME SALE - 30% OFF! WAS $50 - NOW JUST $35! Automatically draw support and resistance levels PLUS propulsion candle gaps on your chart, so you can see where price is likely to head next and/or potentially reverse. This indicator is designed to be used as part of the position trading methodology taught on my website (The Market Structure Trader) and displays key information for targeting and potential entries. MT5 version available here:  https://www.mql5.com/en/market/product/9
LIMITED TIME SALE - 30% OFF! WAS $50 - NOW JUST $35! A symmetrical triangle chart pattern represents a period of contraction & consolidation before the price is forced to breakout to the upside or breakdown. A breakdown from the lower trendline marks the start of a new bearish trend, while a breakout from the upper trendline indicates the start of a new bullish trend. MT4 Version Available Here:  https://www.mql5.com/en/market/product/68709/ This indicator identifies these patterns and
Automatic Trade Protection EA For MT5 Overview Trade Equity Guardian is a lightweight, always-on Expert Advisor that continuously monitors all open positions on your account and automatically closes any trade that breaches your predefined risk thresholds. It acts as a safety net — protecting your account from oversized positions, runaway losses, or locking in profits when targets are hit. Attach it to any chart and let it run in the background. It works alongside your other EAs and manual trades
FREE
Profit from the explosive moves that occur at the open of stock indices and give yourself an actionable edge every day. The opening range breakout EA can be tweaked to your liking to capture the trends that form just after the open every day on the main stock indices like the DAX, DOW, NASDAQ and S&P500. These opens happen at the same time every day, so you know when volatility will occur, and often just after the open strong trends form which you can capture with this EA. The opening range is t
Profit from the explosive moves that occur at the open of stock indices and give yourself an actionable edge every day. The opening range breakout EA can be tweaked to your liking to capture the trends that form just after the open every day on the main stock indices like the DAX, DOW, NASDAQ and S&P500. These opens happen at the same time every day so you know when volatility will occur and often just after the open strong trends form which you can capture with this EA. The opening range is typ
Stop Guessing. Start Trading with a Statistical Edge. Stock indices don't trade like forex. They have defined sessions, they gap overnight, and they follow predictable statistical patterns. This indicator gives you the probability data you need to trade indices like the DAX, S&P 500, and Dow Jones with confidence. What Makes This Different Most indicators show you what happened. This one shows you what's likely to happen next.  Every trading day, the indicator analyses your current setup against
AT LAST! A stochastic indicator for MT4 that shows multiple time frames on one chart ! See the actual position of the main and signal lines in 4 separate time frames instantly to help you make educated trading decisions.A true MTF stochastic indicator for traders that need to see visually what the indicator is telling them on multiple time frames, no arrows that just point up or down or numbers displayed. No more flicking between time frames to see where other stochastics are positioned! Stay on
FREE
The Strat Dashboard - Multi-Symbol Pattern Scanner for Rob Smith's Strat Strategy Transform Your Trading with Real-Time Multi-Symbol Strat Analysis The Strat Dashboard   is a powerful, professional-grade indicator designed specifically for traders using Rob Smith's renowned "Strat" trading methodology. Monitor unlimited symbols across multiple timeframes simultaneously, identify high-probability setups instantly, and never miss another actionable pattern. MT4 Version :- https://www.mql5.com/en/m
Instantly see your closed trade history by day and week, your current open trades, and forex exposure on one chart! Use the heatmap to identify profitable trades and where your current drawdown is within your trading portfolio. MT5 Version -  https://www.mql5.com/en/market/product/132613 Quick Close Buttons Use the quick close buttons to close every trade on a single symbol, close out individual trades in full, or take partial profits or losses at the click of a button. No more hunting for trade
LIMITED TIME SALE - 30% OFF! WAS $50 - NOW JUST $35! The ADR Alert Dashboard shows you at a glance where price is currently trading in relation to it's normal average daily range. You will get instant alerts via pop-up, email or push when price exceeds it's average range and levels above it of your choosing so you can jump into pullbacks and reversals quickly. The dash is designed to be placed on a blank chart and just sit in the background and alert you when levels are hit so you do no
LIMITED TIME SALE - 30% OFF! WAS $50 - NOW JUST $35! The RSI / TDI alert dashboard allows you to monitor RSIs at once (selectable by you) on every major pair you trade. You can use it in two ways: 1. Select multiple time frames and the dash will show you when there are multiple time frames extended beyond normal trading conditions. A great indicator that price has pushed hard recently as it has achieved an overbought or oversold level across multiple time frames so a pullback or reversa
ADR Alert Dashboard
LEE SAMSON
3.73 (11)
LIMITED TIME SALE - 30% OFF! WAS $50 - NOW JUST $35! The ADR Alert Dashboard shows you at a glance where price is currently trading in relation to it's normal average daily range. You will get instant alerts via pop-up, email or push when price exceeds it's average range and levels above it of your choosing so you can jump into pullbacks and reversals quickly. The dash is designed to be placed on a blank chart and just sit in the background and alert you when levels are hit so you do no
LIMITED TIME SALE - 30% OFF! WAS $50 - NOW JUST $35! Take control of your forex portfolio. See instantly where you stand, whats working and whats causing you pain! MT4 VERSION AVAILABLE HERE:  https://www.mql5.com/en/market/product/58375 The Trade Manager Dashboard is designed to show you at a glance where each position you have in the forex market currently is, and make risk management and exposure to currencies easier to understand.   For traders that scale into the market gradually
LIMITED TIME SALE - 30% OFF! WAS $50 - NOW JUST $35! Take control of your forex portfolio. See instantly where you stand, whats working and whats causing you pain! MT5 VERSION AVAILABLE HERE:  https://www.mql5.com/en/market/product/58658 The Trade Manager Dashboard is designed to show you at a glance where each position you have in the forex market currently is, and make risk management and exposure to currencies easier to understand. For traders that scale into the market gradually wi
Filter:
adrazz
98
adrazz 2024.12.21 10:57 
 

This takes forever to load

LEE SAMSON
73034
Reply from developer LEE SAMSON 2024.12.21 11:22
Try reducing the number of bars back you are looking at for propulsion gaps, Your PC is probably not powerful enough to go too far back.
Blobini
54
Blobini 2024.07.09 16:41 
 

Doesn't work. Prints a lot of false targets. Also the performance is very bad. No support from developer whatsoever ("well, no problems with it on my end...").

LEE SAMSON
73034
Reply from developer LEE SAMSON 2024.07.09 16:59
Yes works fine. I think you were the person who had an issue with their terminal in the Discord support. If you try another terminal/broker maybe that will help identify the issue, but working fine for my terminal and no other purchasers have an issue so it's isolated your end unfortunately. :(
Betatester69
199
Betatester69 2024.05.06 20:22 
 

Quite useful indicator, shows fvg's, important highs/lows, candle timer and a few other useful things. Takes a while to load on mt5 but that is just mt5...much better on mt4 I hear but I had already bought this. Part and parcel now of the position trading strategy that I use thanks to the author.

camira
223
camira 2023.06.02 18:07 
 

absolutely good tool! Is highly recommended! Thanks Lee ;))

Reply to review