UPD1 Impulse Candle

5

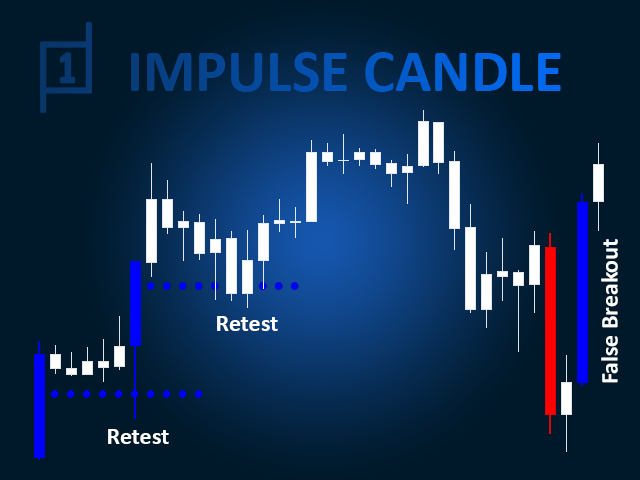
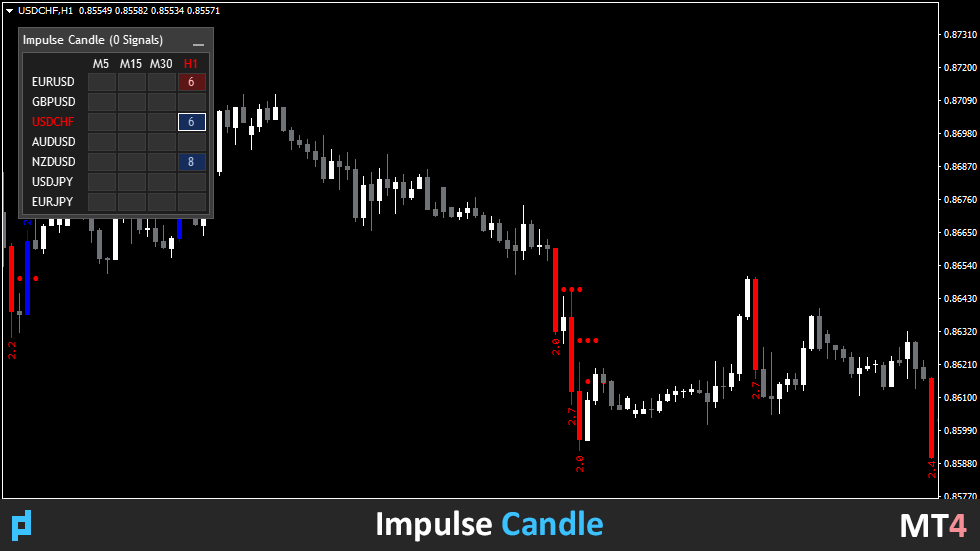
The indicator searches for impulse candles and displays them on the chart.

It includes a shadow filter. It also finds breakout levels of Bollinger Bands.

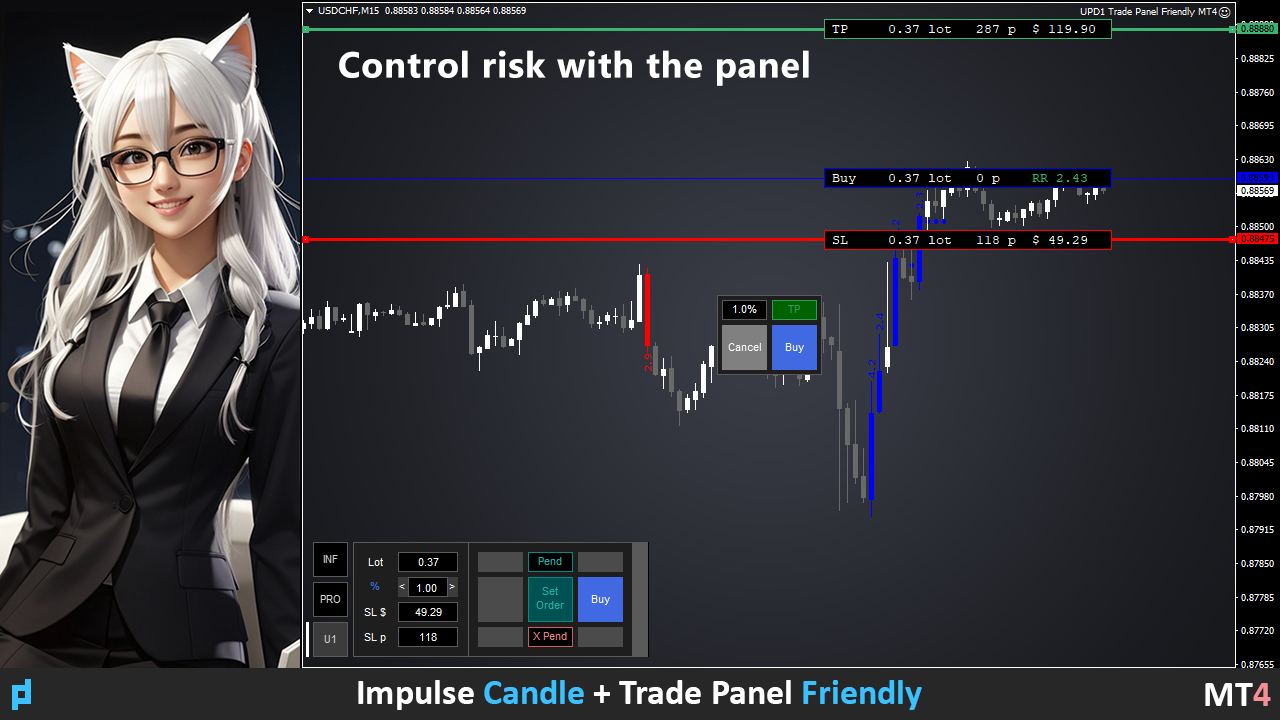
You can enable multi-currency dashboard in the settings.

Alerting choose between the current chart or the entire list.

Blog-Link - Retest and Fake Breakout with UPD1


Trading patterns:

  • Trend retest.
  • False Breakout.
  • Others.


EURUSD, GBPUSD, XAUUSD, ...

M15, M30, H1.


Input parameters.


Basic.

Bars Count - the number of history bars on which the indicator will work.

Coeff Period - period for calculation.

Min HL Coeff - coefficient above which candles are searched. The default value is 2.0, but for more signals on higher timeframes you can set 1.5.

Shadow Filter - the higher the value, the larger the size of shadows can be on candlesticks. It is desirable to set 50 and lower.


    Visual of candlesticks.

    Color Bar - enable/disable candle filling.

    Width Color Bar (-1 auto) - fill thickness. The default is -1 auto, at which the fill corresponds to the candlestick thickness.

    Show Arrows On Chart - display numeric values above large candlesticks. They mean how many times the candle is larger than the average value.

    UP Label Color - the color of the Buy candle.

    DN Label Color - the color of the Sell candle.

    Indent Coeff - indentation of the number from the candle.

    Size - font size.


      Bollinger Bands Settings.

      BB Filter - when enabled, displays only those large candles that have closed behind the channel.

      MA Period - moving average period.

      MA Price - price parameters.

      MA Deviation - deviation setting.

      MA Shift - offset setting.


      BB Cross OC Candle - to show or not to show the crossing of a large candle of the channel (by closing).

      BB Cross Extend Bars - line length.

      BB Cross Arrow Code - icon code.

      BB Cross Arrow Size - icon size.


        Dashboard Settings.

        Dashboard - enable / disable multicurrency dashboard.

        Scan Bars - how many candles to monitor per history.

        Dashboard Zoom % (0 -auto) - choose any zoom.

        Color Theme - automatic or manual selection of the panel color theme (light and dark).

        Symbol Lyst - write down the instruments to be monitored.

        View M1-MN - enter the timeframes to be monitored.


        Alert Settings.

        Alert - enable / disable notification settings.

        Current Chart – alert only on the current chart, ignoring dashboard signals.

        Dashboard List – alert when new signals appear in the dashboard.

        Alert Work Time - specify the time period when the alert will be active.

        Alert Pop Up - enable / disable alert popup.

        Alert Push - enable / disable notification to phone.

        Alert E-mail - enable / disable email notification.

        Alert Sound - enable / disable sound notification.

        Alert Sound Name - select sound alert file.


        Reviews 1
        Iurie Lupasco
        296
        Iurie Lupasco 2025.08.11 20:37 
         

        полезный индикатор

        Recommended products
        Just Currency Strength
        Pankom Sriboonlue
        5 (1)
        Just Currency Strength is a simple, and easy to use as a market analysis tool. It could helps trader to understand the broder view of the market and forcasting the movemt of each currency symbol and trend direction of each specific currency pair. Parameters Timeframe (Move Timeframe box to move the pannel) Currency (Must NOT be less than 5 currencies) Refreshtime in second Colors Strong//Weak//Neutrial Alerts setting Alert On/Off Push notification On/Off Happy Trading...
        FREE
        Overview The Williams VIX Fix Indicator is a MetaTrader 4 tool designed to help traders identify potential market tops and bottoms. By analyzing price extremes relative to recent highs and lows, it highlights overbought and oversold conditions using two histograms displayed in a separate window. The indicator combines the Williams VIX Fix calculation with Bollinger Bands and percentile-based thresholds to provide clear signals for potential reversals.  Key Features Market Tops and Bottoms Market
        SignalFxPro Breakout — Non-Repainting Indicator Overview: The SignalFxPro Breakout is a non-repainting breakout arrow indicator designed to capture explosive price moves after consolidation. It automatically marks Buy (green arrow) and Sell (red arrow) signals directly on the chart, giving traders a clear and reliable visual cue for potential entries. Key Features Non-Repainting Logic – signals confirmed only on closed bars, ensuring reliability. Dynamic Breakout Detection – identifies
        Dark Breakout
        Marco Solito
        4.89 (9)
        Dark Breakout   is an Indicator for intraday trading. This Indicator is based on Trend Following  strategy, providing an entry signal on the breakout. The signal is provided by the arrow, which confirms the breaking of the level. We can enter in good price with this Indicator, in order to follow the main trend on the current instrument. It is advised to use low spread ECN brokers. This Indicator does Not repaint and N ot lag . Recommended timeframes are M5, M15 and H1. Recommended working pairs
        EForex 2 EMAs Cross Over
        Veridiana Adorno Kendrick
        Become a constantly profitable 5-star forex trader!  We offer a few indicators to support you understand and analyse the market! With our strategies you will improve your trading system and bacome an expert... We have indicators for trend direction, market direction and others.. for multi-time frames and that covers all majors or your favorite trading symbols! Some of them offer a customizable calculation parameters... or Graph features! See how powerful they are! The are also easy-to-use tr
        Triple MA Scanner
        Reza Aghajanpour
        5 (2)
        ** All Symbols x All Time frames scan just by pressing scanner button ** *** Contact me to send you instructions and add you in "Triple MA scanner group" for sharing or seeing experiences with other users. Introduction: The triple moving average strategy involves planning three different moving averages to generate buy and sell signals.  The third moving average is used in combination with the other two moving averages to confirm or deny the signals they generate. This reduces the probability t
        OBV Trend mt4
        Natasha Diedericks
        This indicator takes input from the OBV and a trend filter, and presents the output in a separate indicator window as a histogram. Great for scalping. Settings: TrendPeriod Features Alerts. How to use: Simply attach to any chart with default setting, or set the TrendPeriod to your preference. Zoom chart in to get a better view of the histo color. Buy:  Blue histo color on multiple timeframes. (e.g., M15-M30-H1-H4) Sell: Red histo color  on multiple timeframes. Or backtest and use as you see fit
        Candle close countdown indicator. Almost all indicators work by ticks and therefore stop counting when the price stops in moments of little volatility. This indicator does not stop and remains synchronized with the broker's clock. It also has other functions that can help the trader. All features are configurable and you can choose if you want to use it or not: - Volume control:                         the counter changes color when the current candle has a higher volume of contracts than the pr
        Separated Volume
        Ivan Stefanov
        5 (1)
        This indicator effectively separates the tick volume in the forex market into bullish and bearish categories. Additionally, it provides the functionality to calculate and display the sum of bullish and bearish tick volumes for any selected period of your choice. You can easily adjust the period by moving the two blue lines on the chart, allowing for customizable and precise volume analysis tailored to your trading needs. If you find it usefull your reviews will be appreciated! Happy trading!
        FREE
        Final neutral bottom pro
        Saqr Mohammad Yousef Almasarweh
        The Final Neutral Bottom indicator by saqr studio is a powerful technical analysis tool designed for MetaTrader 4 (MT4). It meticulously analyzes price action within a recent range to identify strong momentum shifts, providing clear, actionable trading signals with pre-calculated risk management zones. Core Features Momentum Analysis Box: The indicator automatically draws a box around a user-defined number of recent candles to establish the current trading range (high and low). Clear Buy/Sell S
        Momentum Jurik
        Augustine Kamatu
        Introducing Momentum Jurik—an innovative indicator designed to optimize your forex trading strategy by incorporating custom moving averages based on the Momentum indicator with the MetaTrader 4 indicator, Momentum. Jurik moving averages are renowned for their precision and reliability in analyzing price movements in the forex market. They provide traders with smoother representations of price action, reducing noise and offering clearer signals for identifying trends and potential reversals. T
        FREE
        KT Psar Arrows
        KEENBASE SOFTWARE SOLUTIONS
        KT Psar Arrows plots the arrows on chart using the standard Parabolic SAR indicator. A bullish arrow is plotted when the candle's high touch the SAR. A bearish arrow is plotted when the candle's low touch the SAR. The signals are generated in the real-time without waiting for the bar close.  Features A beneficial tool for traders who want to experiment with the trading strategies that include the use of Parabolic Sar indicator.  Can be used to find turning points in the market. Use custom PSAR
        BBandsEx
        Andrej Nikitin
        Advanced Bollinger Bands (BB) indicator. The standard Bands.mq4 indicator was complemented with a range of upper/lower band and signal of possible reverses. Parameters: BandsPeriod - indicator period. BandsRange - period of determining a range. BandsDeviations - number of standard deviations. Averaging Fast Period - fast period of averaging. Averaging Slow Period - slow period of averaging. Buffer indexes: 0 - Middle line, 1 - Upper line, 2 - Lower line, 3 - Upper range, 4 - Lower range, 5 -
        Pro Trader mt4
        Natasha Diedericks
        This indicator takes input from the RSI and a trend filter, and presents the output in a separate indicator window as a histogram. Great for scalping. Settings: No need to set up the indicator. Features Alerts. How to use: Simply attach to any chart Zoom chart in to get a better view of the histo color. Buy:  Blue histo color on multiple timeframes. (e.g,. M30-H1-H4) Sell: Red histo color  across on multiple timeframes. Or backtest and use as you see fit for your strategy. Best results on Major
        Dragon Trend
        Marco Fornero Monia
        Trend indicator with Multi-level Take Profit indication. Possibility to setting in normal or Aggressive mode. Fully customizable in color and alarm. Very useful to understand the trend and where price could go No need to explain, see the images. You'll se the trend, 3 possibly target and stop loss (or other take profit) when the trend change. You can adopt various strategy, for example. 1) Open trade and try to close it at target 1 2) Open 2 trade, close 1 at target 1, stop in profit for 2 and t
        IVolX 2 DPOC
        Denis Chebatarev
        Vol 2 DPOC volume vol 2 DOC-dynamic horizontal volume indicator for any time periods Main settings of the indicator: Volume Source -selecting data for volumes (tick or real) DPOCOn -enabling / disabling the indicator DPOCFrom -calculation start date DPOCTo -settlement end date The indicator allows you to manually select areas on the chart to analyze changes in the maximum volume over time. You can do this by using vertical lines and moving them along the chart. Or by setting specific dates in
        Elephant Candle
        David Leander Tschacher
        The Elephant Candle is an indicator for MT4. It draws arrows when strong bullish or bearish candles appear. Strong candles frequently initiate a new trend. The arrows can be used in expert advisors. This indicator can improve already existing trading strategies. The indicator is very fast and doesn't repaint. Inputs Period Candle Multiplier Candle Niceness [%] Arrow Size Enable Alert Enable Push Notification Enable Email
        This indicator shows the high volume zone. From the last minutes that you set yourself, the image of the volume zone is generated on an ongoing basis. The indicator also shows the V-Poc, Average Volumen and V-WAP lines. if you are using high intervals you must enter a large number of minutes. the zone builds itself up as the chart moves. if you want to build a zone from:  last day - 1440 minutes,    last week - 10080 minutes, ... etc. If you need an indicator that shows the constant volume zone
        Vertex Point Indicator MetaTrader 4 The Vertex Point Indicator for MetaTrader 4 is a powerful oscillator that evaluates volume flow and price action to detect key market conditions. It displays color-coded histogram bars around a central zero line, where blue bars indicate buying pressure and red bars reflect selling pressure. «Indicator Installation & User Guide» MT4 Indicator Installation  |  Vertex Point Indicator MT5   | ALL Products By  TradingFinderLab  | Best MT4 Indicator:  Refined Order
        FREE
        Session Kill zones with panel for quick changes. Asia Killzone London Killzone New York Killzone London Close Killzone In this indicator GMT+2 timings are used that are most common among many brokers. read the image attached in the screenshots to know more about sessions adjustments Session timings can be changed according to your broker timings and day light savings. Thank you :) Always open to feedback and criticism if it helps me provide you more value. - Rahul  My other indicators you may l
        Trend Forecasting
        Mohamed Hassan
        4.76 (17)
        Summer Sale: 50% OFF!!! Promotion is valid until 08 August 2025!  This indicator is unstoppable when combined with our other indicator called Katana. After purchase, send us a message and you could get Katana for FREE as a BONUS After purchase, send us a private message for your instructions.  The Trend Forecasting indicator is a very unique & easy tool that is able to make prediction about future price movement based on the signals generated by MACD . It helps you have an estimation on the are
        KT Forex Trend Rider MT4
        KEENBASE SOFTWARE SOLUTIONS
        KT Forex Trend Rider uses a trend following algorithm developed specifically for the Forex market to provide reliable buy & sell signals across the major currency pairs. It works best on major FX pairs and all time-frames. Features It comes with a Multi-Timeframe scanner that can search for upcoming signals across all the time-frames. It comes with four preset profiles to facilitate trading for scalpers, tick-trend, swing, and trend traders. It marks the potential reversal points in the market.
        " Valiant Strong Trend " - Your Ultimate MT4 Signal Indicator Are you ready to elevate your trading game to new heights? Look no further than the "Valiant Strong Trend" MT4 signal indicator, your indispensable tool for navigating the complex world of financial markets. Key Features: Precise Trend Identification : "Valiant Strong Trend" employs advanced algorithms to accurately identify market trends, whether they are bullish or bearish. Say goodbye to guesswork and hello to informed trading deci
        MACD Level Alert MT4
        Prafull Manohar Nikam
        This is a simple arrow system based on MACD indicators Main/Base line and MACD Levels. It gives you alerts when MACD's Main Line crosses above/below certain level. Which type of alerts available? 1. It paints on chart Up/Down Arrows. 2. Popup message and sound alert in trading terminal window. 3. Push notification or Alert on your android and ios mobile phones (requires MT4 or MT5 app installed!)
        Entry Point
        Thushara Dissanayake
        Introducing the Entry Point , a powerful technical indicator designed to provide Buy/Sell notifications. This indicator analyzes 5 moving averages, CCI, RSI, Stochastic, Bill Williams, and volume indicators across 3 different time frames to generate accurate signals. It offers unlimited customization options for professional traders, allowing them to tailor the indicator based on their experience and strategies. The Entry Point sends signals to users via mobile devices, email, and pop-up alerts
        TMA-Centered Bands Indicator MetaTrader 4 The TMA Centered Bands Indicator for MetaTrader 4 leverages Moving Averages to identify the overall trend direction, which is visually represented by the bands on the chart. This indicator is composed of three bands: the upper band in red, the middle band in a red-blue gradient, and the lower band in blue. In an uptrend, the middle band changes to blue, and in a downtrend, it switches to red. When the price moves beyond the upper or lower bands, it tend
        FREE
        Pacific Breakout
        Anton Karabeinikov
        "PACIFIC BREAKOUT" — Catch a Wave of Profit on Breakouts of Sessions!   Are You Tired Of Missing Key Breakouts? Manual calculation of levels, dozens of indicators and missed signals will be a thing of the past!   What Does Pacific Breakout Do? This is your personal analytical robot that: The pulse accumulation range of the Pacific session is automatically determined (1:00 GMT+3 Sydney).  - We analyze the second candle after the market opens, because the extended spread does not giv
        USD Macro Strength Index
        Pieter Gerhardus Van Zyl
        The USD Macro Strength Index is a custom indicator designed to assess and visualize the overall strength or weakness of the US Dollar (USD) across major currency pairs. It achieves this by calculating a weighted average of USD-related price changes over a defined lookback period and displaying the results as a color-coded histogram with optional smoothed index and signal lines. Key Features: Macro USD Sentiment Analysis: Uses six major USD pairs ( EURUSD , USDJPY , GBPUSD , AUDUSD , USDCAD
        REMINDER: Early buyers hot price discount: Price subject to rise after first 20 copies. Starting price $65 and final price will be $1275. Secure your discounted copy Now! Smart Money Analyser Indicator User Manual 1. Introduction Welcome to the   Smart Money Analyser Indicator This powerful tool provides traders with comprehensive market analysis by combining various technical indicators to generate actionable trading signals. Designed to be user-friendly, this indicator helps traders of all
        Hello Guys! I want to share with you a very simple but very effective indicator, which I use a lot in my daily trading. Bollinger bands are one of the most effective tools in trading, especially for those who like to operate on low time frames and prefer fast operations. The indicator detects fast reversals: when the price close above or below the Bollinger Bands, but then re-enters in the Bands on the next candle, the indicator sends a signal and draws an arrow on the newly opened candle! It i
        Buyers of this product also purchase
        Gann Made Easy
        Oleg Rodin
        4.82 (142)
        Gann Made Easy is a professional and easy to use Forex trading system which is based on the best principles of trading using the theory of W.D. Gann. The indicator provides accurate BUY and SELL signals including Stop Loss and Take Profit levels. You can trade even on the go using PUSH notifications. PLEASE CONTACT ME AFTER PURCHASE TO GET MY TRADING TIPS PLUS A GREAT BONUS! Probably you already heard about the Gann trading methods before. Usually the Gann theory is a very complex thing not only
        M1 Sniper
        Oleg Rodin
        4.76 (17)
        M1 SNIPER is an easy to use trading indicator system. It is an arrow indicator which is designed for M1 time frame. The indicator can be used as a standalone system for scalping on M1 time frame and it can be used as a part of your existing trading system. Though this trading system was designed specifically for trading on M1, it still can be used with other time frames too. Originally I designed this method for trading XAUUSD and BTCUSD. But I find this method helpful in trading other markets a
        SMC Easy Signal
        Mohamed Hassan
        5 (11)
        SMC Easy Signal was built to remove the confusion around the smart money concept by turning structural shifts like BOS (Break of Structure) and CHoCH (Change of Character) into simple buy and sell trading signals. It simplifies market structure trading by automatically identifying breakouts and reversals as they happen, allowing traders to focus on execution rather than analysis. Whether the market is continuing its trend or preparing to reverse, the indicator translates complex price action in
        Scalper Inside PRO
        Alexey Minkov
        4.7 (69)
        An exclusive indicator that utilizes an innovative algorithm to swiftly and accurately determine the market trend. The indicator automatically calculates opening, closing, and profit levels, providing detailed trading statistics. With these features, you can choose the most appropriate trading instrument for the current market conditions. Additionally, you can easily integrate your own arrow indicators into Scalper Inside Pro to quickly evaluate their statistics and profitability. Scalper Inside
        Dynamic Forex28 Navigator
        Bernhard Schweigert
        5 (6)
        Specials Discount now. The Next Generation Forex Trading Tool. Dynamic Forex28 Navigator is the evolution of our long-time, popular indicators, combining the power of three into one: Advanced Currency Strength28 Indicator (695 reviews) + Advanced Currency IMPULSE with ALERT (520 reviews) + CS28 Combo Signals (recent Bonus) Details about the indicator  https://www.mql5.com/en/blogs/post/758844 What Does The Next-Generation Strength Indicator Offer? Everything you loved about the originals, now
        Currently 20% OFF ! Best Solution for any Newbie or Expert Trader! This dashboard software is working on 28 currency pairs plus one. It is based on 2 of our main indicators (Advanced Currency Strength 28 and Advanced Currency Impulse). It gives a great overview of the entire Forex market plus Gold or 1 indices. It shows Advanced Currency Strength values, currency speed of movement and signals for 28 Forex pairs in all (9) timeframes. Imagine how your trading will improve when you can watch the e
        Day Trader Master is a complete trading system for traders who prefer intraday trading. The system consists of two indicators. The main indicator is the one which is represented by arrows of two colors for BUY and SELL signals. This is the indicator which you actually pay for. I provide the second indicator to my clients absolutely for free. This second indicator is actually a good trend filter indicator which works with any time frame. THE INDICATORS DO NOT REPAINT AND DO NOT LAG! The system is
        Advanced Supply Demand
        Bernhard Schweigert
        4.91 (296)
        CURRENTLY 26% OFF !! Best Solution for any Newbie or Expert Trader! This indicator is a unique, high quality and affordable trading tool because we have incorporated a number of proprietary features and a new formula. With this update, you will be able to show double timeframe zones. You will not only be able to show a higher TF but to show both, the chart TF, PLUS the higher TF: SHOWING NESTED ZONES. All Supply Demand traders will love it. :) Important Information Revealed Maximize the potentia
        Italo Arrows Indicator
        Italo Santana Gomes
        5 (2)
        BUY INDICATOR AND GET NEW EXCLUSIVE EA FOR FREE AS A BONUS! ITALO ARROWS INDICATOR  is the best reversal indicator ever created, and why is that? Using extreme reversal zones on the market to show the arrows and Fibonacci numbers for the Take Profit, also with a panel showing all the information about the signals on the chart, the Indicator works on all time-frames and assets, indicator built after 8 years of experience on forex and many other markets. You know many reversal indicators around t
        Trend Screener
        STE S.S.COMPANY
        4.79 (95)
        Unlock the Power of Trends Trading with the Trend Screener Indicator: Your Ultimate Trend Trading Solution powered by Fuzzy Logic and Multi-Currencies System! Elevate your trading game with the Trend Screener, the revolutionary trend indicator designed to transform your Metatrader into a powerful Trend Analyzer. This comprehensive tool leverages fuzzy logic and integrates over 13 premium features and three trading strategies, offering unmatched precision and versatility. LIMITED TIME OFFER : Tre
        Supply and Demand Dashboard PRO
        Bernhard Schweigert
        4.8 (20)
        Currently 20% OFF ! This dashboard is a very powerful piece of software working on multiple symbols and up to 9 timeframes. It is based on our main indicator (Best reviews:   Advanced Supply Demand ). The dashboard gives a great overview. It shows: Filtered Supply and Demand values including zone strength rating, Pips distances to/and within zones, It highlights nested zones, It gives 4 kind of alerts for the chosen symbols in all (9) time-frames. It is highly configurable for your personal n
        GOLD Impulse with Alert
        Bernhard Schweigert
        4.64 (11)
        This indicator is a super combination of our 2 products  Advanced Currency IMPULSE with ALERT  and  Currency Strength Exotics . It works for all time frames and shows graphically impulse of strength or weakness for the 8 main currencies plus one Symbol! This Indicator is specialized to show currency strength acceleration for any symbols like Gold, Exotic Pairs, Commodities, Indexes or Futures. Is first of its kind, any symbol can be added to the 9th line to show  true currency strength accelerat
        FX Power MT4 NG
        Daniel Stein
        4.95 (19)
        FX Power: Analyze Currency Strength for Smarter Trading Decisions Overview FX Power is your go-to tool for understanding the real strength of currencies and Gold in any market condition. By identifying strong currencies to buy and weak ones to sell, FX Power simplifies trading decisions and uncovers high-probability opportunities. Whether you’re looking to follow trends or anticipate reversals using extreme delta values, this tool adapts seamlessly to your trading style. Don’t just trade—trade
        Stratos Pali
        Michela Russo
        5 (4)
        Stratos Pali Indicator   is a revolutionary tool designed to enhance your trading strategy by accurately identifying market trends. This sophisticated indicator uses a unique algorithm to generate a complete histogram, which records when the trend is Long or Short. When a trend reversal occurs, an arrow appears, indicating the new direction of the trend. Important Information Revealed Leave a review and contact me via mql5 message to receive My Top 5 set files for Stratos Pali at no cost! Dow
        Support Resistance screnner
        STE S.S.COMPANY
        4.95 (37)
        Support And Resistance Screener  Breakthrough unique Solution With All Important levels analyzer and Markets Structures Feature Built Inside One Tool! Our indicator has been developed by traders for traders and with one Indicator you will find all Imporant market levels with one click. LIMITED TIME OFFER : Support and Resistance Screener Indicator is available for only 50 $ and lifetime. ( Original price 125$ )  (offer extended) The available tools ( Features ) in our Indicator are :  1. HH-LL
        FX Volume
        Daniel Stein
        4.6 (35)
        FX Volume: Experience Genuine Market Sentiment from a Broker’s Perspective Quick Overview Looking to elevate your trading approach? FX Volume provides real-time insights into how retail traders and brokers are positioned—long before delayed reports like the COT. Whether you’re aiming for consistent gains or simply want a deeper edge in the markets, FX Volume helps you spot major imbalances, confirm breakouts, and refine your risk management. Get started now and see how genuine volume data can
        First of all Its worth emphasizing here that this Trading Tool is Non-Repainting Non-Redrawing and Non-Lagging Indicator Which makes it ideal for professional trading . Online course, user manual and demo. The Smart Price Action Concepts Indicator is a very powerful tool for both new and experienced traders . It packs more than 20 useful indicators into one combining advanced trading ideas like Inner Circle Trader Analysis and Smart Money Concepts Trading Strategies . This indicator focuses on
        Gold Stuff
        Vasiliy Strukov
        4.85 (263)
        Gold Stuff is a trend indicator designed specifically for gold and can also be used on any financial instrument. The indicator does not redraw and does not lag. Recommended time frame H1. At it indicator work full auto  Expert Advisor EA Gold Stuff. You can find it at my profile. Contact me immediately after the purchase to get   personal bonus!  You can get a free copy of our Strong Support and Trend Scanner indicator, please pm. me! Settings  and manual here  Please note that I do not sell my
        Currency Strength Exotics
        Bernhard Schweigert
        4.88 (33)
        CURRENTLY 20% OFF ! Best Solution for any Newbie or Expert Trader! This Indicator is specialized to show currency strength for any symbols like Exotic Pairs Commodities, Indexes or Futures. Is first of its kind, any symbol can be added to the 9th line to show true currency strength of Gold, Silver, Oil, DAX, US30, MXN, TRY, CNH etc. This is a unique, high quality and affordable trading tool because we have incorporated a number of proprietary features and a new formula. Imagine how your trading
        M1 Arrow
        Oleg Rodin
        5 (19)
        M1 Arrow is an indicator which is based on natural trading principles of the market which include volatility and volume analysis. The indicator can be used with any time frame and forex pair. One easy to use parameter in the indicator will allow you to adapt the signals to any forex pair and time frame you want to trade. The Arrows DO NOT REPAINT and DO NOT LAG! The algorithm is based on the analysis of volumes and price waves using additional filters. The intelligent algorithm of the indicator
        Gold Trend 4
        Sergei Linskii
        Gold Trend - this is a good stock technical indicator. The indicator algorithm analyzes the price movement of an asset and reflects volatility and potential entry zones. Live Signal of manual trading >>>   [ Click Here ] The best indicator signals: For SELL = red histogram + red SHORT pointer + yellow signal arrow in the same direction + red trend direction arrow. For BUY = blue histogram + blue LONG pointer + aqua signal arrow in the same direction + blue trend direction arrow. Benefits of the
        This dashboard shows the latest available harmonic patterns for the selected symbols, so you will save time and be more efficient / MT5 version . Free Indicator:   Basic Harmonic Pattern Comparison of "Basic Harmonic Pattern" vs. "Basic Harmonic Patterns Dashboard" Indicators Feature Basic Harmonic Pattern Basic Harmonic Patterns Dashboard Functionality Detects and displays harmonic patterns on a single chart Searches multiple symbols and timeframes for harmonic patterns, displays results on
        Official release price is 65$ ,only for the first 15 copies ( only 3 left ).                Next price is 95$ , final price will be 250$. Sniper Delta Imbalance is a professional tool for deep delta analysis — the difference between buyer and seller volumes. It takes volume analysis to the next level, allowing traders to see in real time who controls the price — buyers or sellers — and to find precise entry points based on the actions of major market participants. This tool repre
        "The Squeeze indicator attempts to identify periods of consolidation in a market. In general the market is either in a period of quiet consolidation or vertical price discovery. By identifying these calm periods, we have a better opportunity of getting into trades with the potential for larger moves. Once a market enters into a "squeeze," we watch the overall market momentum to help forecast the market direction and await a release of market energy." Modified TTM Squeeze Indicator is a modifica
        FX Levels MT4
        Daniel Stein
        5 (2)
        FX Levels: Exceptionally Accurate Support & Resistance for All Markets Quick Overview Looking for a reliable way to pinpoint support and resistance levels across any market—currencies, indices, stocks, or commodities? FX Levels merges our traditional “Lighthouse” method with a forward-thinking dynamic approach, offering near-universal accuracy. By drawing from real-world broker experience and automated daily plus real-time updates, FX Levels helps you identify reversal points, set profit targe
        AW Trend Predictor
        AW Trading Software Limited
        4.62 (34)
        The combination of trend and breakdown levels in one system. An advanced indicator algorithm filters market noise, determines the trend, entry points, as well as possible exit levels. Indicator signals are recorded in a statistical module, which allows you to select the most suitable tools, showing the effectiveness of the signal history. The indicator calculates Take Profit and Stop Loss marks. Manual and instruction -> Here / MT5 version -> Here How to trade with the indicator:  Trading with T
        Daily Candle Predictor is an indicator that predicts the closing price of a candle. The indicator is primarily intended for use on D1 charts. This indicator is suitable for both traditional forex trading and binary options trading. The indicator can be used as a standalone trading system, or it can act as an addition to your existing trading system. This indicator analyzes the current candle, calculating certain strength factors inside the body of the candle itself, as well as the parameters of
        Cycle Sniper
        Elmira Memish
        4.39 (36)
        Please contact us after your purchase and we will send you the complimentary indicators to complete the system Cycle Sniper is not a holy grail but when you use it in a system which is explained in the videos, you will feel the difference. If you are not willing to focus on the charts designed with Cycle Sniper and other free tools we provide, we recommend not buying this indicator. We recommend watching the videos about the indiactor and system before purchasing. Videos, settings  and descri
        Reversal Master
        Alexey Minkov
        4.8 (15)
        The Reversal Master is an indicator for determining the current direction of price movement and reversal points. The indicator will be useful for those who want to see the current market situation better. The indicator can be used as an add-on for ready-made trading systems, or as an independent tool, or to develop your own trading systems. The Reversal Master indicator, to determine the reversal points,  analyzes a lot of conditions since the combined analysis gives a more accurate picture of t
        RelicusRoad Pro
        Relicus LLC
        4.63 (106)
        How many times have you bought a trading indicator with great back-tests, live account performance proof with fantastic numbers and stats all over the place but after using it, you end up blowing your account? You shouldn't trust a signal by itself, you need to know why it appeared in the first place, and that's what RelicusRoad Pro does best! User Manual + Strategies + Training Videos + Private Group with VIP Access + Mobile Version Available A New Way To Look At The Market RelicusRoad is th
        More from author
        UPD1 Volume Pixel
        Vitaliy Kuznetsov
        5 (3)
        The indicator finds the low, high, extreme volume based on the specified coefficients and paints them in the specified colors. This replaces the standard volume drawing function in the metatrader terminal. Bars can also be painted in the color of the volume. On bars with extreme volume, the maximum horizontal volume (cluster/POC) is determined. Depending on its location (pushing, neutral, stopping), the cluster also has its own color. If the cluster is in the shadow, and the bar has an extreme
        The meaning of this indicator is to   find Murray levels on all timeframes   and combine them into   combo levels , including signal levels based on strong Murray levels (+2, +1, 8, 4, 0, -1, -2). The lower the timeframe, the more chances you have to see the combo level immediately. It will be highlighted in color. When you hover over any number, a hint will pop up to which timeframe the level belongs to. But you will always see the current timeframe as the leftmost one. A  smart alert  will he
        UPD1 Volume Cluster
        Vitaliy Kuznetsov
        4.81 (16)
        The algorithm finds the zones of reduced volatility based on the UPD1 Trend Direction Indicator and builds the maximum horizontal volume based on the UPD1 Volume Box Indicator . As a rule, a strong trend movement occurs when exiting accumulation. If the price has left the accumulation, then it can test its maximum horizontal volume (POC). Smart alerts are available in the settings. Input parameters. Main Settings. Bars Count – the number of history bars on which the indicator will work. Timef
        FREE
        UPD1 Trend Direction
        Vitaliy Kuznetsov
        4.63 (8)
        This indicator is used to display the places of the flat and trend. The construction is based on an oscillator. It is used as an additional filter, both for trading on a regular chart and for binary options. Flat places are used in the UPD1 Volume Cluster indicator for trading according to the concept of smart money The built-in alert signals the places of the greatest overbought/oversold. Input parameters. Main Settings. Bars Count - indicate the number of bars on which the trend direction w
        FREE
        UPD1 Volume Footer
        Vitaliy Kuznetsov
        4.85 (13)
        The indicator shows the vertical volume. In the settings there are 2 coefficients for determining high and extreme volume and 1 for determining low volume. A similar algorithm is also used in the UDP1 Volume Pixel indicator . When the specified volume is detected, the histogram is painted in the appropriate color. The width of the histogram is selected automatically, depending on the scale. As a rule, the price reacts to the maximum and minimum volume. But it is necessary to use confirmation si
        FREE
        UPD1 Volume TimeFrame POC
        Vitaliy Kuznetsov
        4.4 (5)
        The indicator display the maximum horizontal volume on the selected timeframe. Based on the UPD1 Volume Box indicator . The lines can be connected or separated. In the settings, you can enable smart touch alert. Such an indicator will be useful for those who trade according to the market profile and the concept of smart money. Input parameters. Main Settings. Bars Count - indicate the number of bars on which the TF POC will be drawn. Data Source - the time frame from which the ticks will be u
        FREE
        UPD1 Rsi Dots Dashboard
        Vitaliy Kuznetsov
        5 (1)
        The indicator shows signals based on the terminal RSI oscillator on the chart. It is possible to filter out repeated signals. Here the oscillator is used to search for a reverse signal. It is recommended as an entry point in swing strategies and trading from levels. A multi-currency dashboard is available. With it, you can easily switch between charts. In product discussions, you can suggest an algorithm in which you can embed a dashboard. Input parameters. Main Settings. Bars Count – the n
        FREE
        UPD1 Watermark MT4
        Vitaliy Kuznetsov
        5 (1)
        The indicator shows any text and any image on the chart, and can also output the information requested by macros. There are three text blocks and one block for images. Available font selection, size, color, indentation and positioning. If you want to brand your screenshots or display the necessary information on a graph, then UPD1 Watermark will be a very useful tool. Description of settings. Text Settings (3 blocks). Text 1, 2, 3 – enter the text and, or a macro. Font Name – write the font n
        FREE
        UPD1 X00 Levels
        Vitaliy Kuznetsov
        5 (9)
        The indicator shows   round levels   on the chart. They are also called   psychological , banking, or levels of major players. At these levels, there is a real fight between bulls and bears, the accumulation of many orders, which leads to increased volatility. The indicator   automatically   adjusts to any instrument and timeframe. When the   level 80   is broken through and then tested, we   buy. When   level 20   is broken through and then tested, we   sell. The target is 00. Attention. Due t
        FREE
        UPD1 Murrey Math Levels
        Vitaliy Kuznetsov
        5 (7)
        Murray's mathematical levels are based on observations by Gann and his theory of the squareness of prices. According to Gann, the price moves in 1/8 of the range. These 1/8 allow us to get different resistance and support levels for a given chart, which have their own characteristics. After a breakout of -2 or +2 levels, or with a decrease in volatility, they are rebuilt. You can choose which period to display (current or entire history). All lines are drawn through buffers. Blog-Link -   Murrey
        FREE
        UPD1 Volume BOX
        Vitaliy Kuznetsov
        4.93 (15)
        The indicator displays the horizontal volume profile in the specified area (BOX) and the maximum volume (POC). Product Features. 1. You can use ticks or just price. 2. Adaptive grid spacing (M1-MN). 3. Adaptive high volume (median) search step depending on box size. 4. Automatic chameleon color for box lines and buttons. 5. Multiple boxes, easy to create and delete. 6. 70% volume area (enable in settings). 7. There is an alert for touching the maximum horizontal volume line (POC). 8. VWAP. 9. C
        Trading panel with preset orders and automatic lot calculation for the MT4 terminal. Attention, the Trading Panel does not work in the strategy tester (only trailing stop testing). Manual, Description, Download Light Demo. Successful traders are distinguished by self-discipline and competent money management. If you use a fixed lot, then you are at risk. After all, there are different distances on different timeframes and one unprofitable transaction can cover several profitable ones. If you use
        UPD1 Fibo Levels
        Vitaliy Kuznetsov
        5 (2)
        The indicator analyzes the specified number of candles and plots Fibonacci levels based on the high-low. Since the levels are rearranging, we are interested in the right side of the range. The price magnetizes the levels and reacts to the touch. Use this tool to find a trend entry point after a correction. If on the left we see that the levels have risen perfectly, then we can assume that we have found the end of the movement at the extreme point. All lines are drawn through buffers or objects (
        FREE
        The Average True Range ( ATR ) is a measure of market volatility over a specified number of days. You should not expect a big continuation move when the price has reached the end of the range. The market is considered to have run out of fuel. If the price has not reached the edge, it still has a range. The indicator formula allows you to calculate High-Low levels both in aggregate and individually. You can also use these levels as support/resistance and target. Input parameters. Start Day - f
        FREE
        The indicator shows   round levels   on the chart. They are also called   psychological , banking, or levels of major players. At these levels, there is a real fight between bulls and bears, the accumulation of many orders, which leads to increased volatility. The indicator   automatically   adjusts to any instrument and timeframe. When the   level 80   is broken through and then tested, we   buy. When   level 20   is broken through and then tested, we   sell. The target is 00. Attention. Due to
        FREE
        The indicator builds a three-period semaphore and reversal pattern 123 from the extremum. The signal comes at the opening of the second candle. This pattern can be traded in different ways (test point 3, breakout and others). Exit from the channel or breakout of the trendline is the main trigger for finding an entry point. Icons are colored according to Fibonacci levels. Yellow icons indicate a test of a level at which the signal is amplified. Using the multi-currency dashboard, you can track w
        UPD1 Pivot Levels
        Vitaliy Kuznetsov
        5 (2)
        The indicator shows on the chart the classic pivot levels calculated on the basis of the previous day . You can choose from what hour to calculate the formula. Trade on reversal levels in a flat. In a trending market, use them as a target. Combine with your strategies for successful trading. The levels are drawn using   buffers and displayed on the entire available quote   history. Input parameters. Start Hour - Choose from what hour to start building levels. 00 - Default. Show Mid Pivots - M
        FREE
        UPD1 Impulse Channel
        Vitaliy Kuznetsov
        5 (8)
        The channel indicator is trending and does not repaint. It creates an ATR price channel with the opposite volatility border. The indicator has proven itself well in the strategy of trading on impulse levels and fake breakout. The entry point should be looked for on the correction to the indicator line, and the take profit should be set on the opposite border. Blog-Link -   Retest and Fake Breakout with UPD1 . Input parameters. Bars Count - history to display. ATR - average true range period.
        FREE
        UPD1 D Levels
        Vitaliy Kuznetsov
        5 (2)
        Levels indicator based on the previous day. Mathematical formula determines entry and exit levels.  Trading recommendations. Levels are traded at the beginning of the European session when volatility appears. In case of insufficient volatility use half of take profit to exit. If the price reversed at half take profit, then on the reversal look for a target also at the level of half take profit. If the price bounced from the entry level, then in the opposite direction the price can reach the se
        FREE
        UPD1 Profile Levels
        Vitaliy Kuznetsov
        5 (5)
        The indicator finds the levels of the maximum and minimum price volume (market profile) on the working histogram for the specified number of bars.  Composite profile . The height of the histogram is fully automatic and adapts to any instrument and timeframe. The author's algorithm is used and does not repeat well-known analogues. The height of the two histograms is approximately equal to the average height of the candle. Smart alert will help you to inform about the price concerning the volume
        UPD1 Impulse Level
        Vitaliy Kuznetsov
        5 (7)
        The indicator finds impulse waves on the chart. Analyzes the breakdown of the fractal channel and builds impulse levels . In addition, it finds the alleged places of false breakouts and liquidity grabs . In the settings, you can enable a multi-currency dashboard and select any tools and timeframes. Notification Choose between the current schedule or the entire list. There are separate impulse and false breakdown signals. Blog-Link -  Retest and Fake Breakout with UPD1 . Trade Patterns: + Retes
        The indicator builds a three-period semaphore and reversal pattern 123 from the extremum. The signal comes at the opening of the second candle. This pattern can be traded in different ways (test point 3, breakout and others). Exit from the channel or breakout of the trendline is the main trigger for finding an entry point. Icons are colored according to Fibonacci levels. Yellow icons indicate a test of a level at which the signal is amplified. Using the multi-currency dashboard, you can track w
        UPD1 Pin Bar Dashboard
        Vitaliy Kuznetsov
        5 (3)
        An indicator that displays the Pin Bar candlestick pattern. With the help of coefficient settings, the ratio of shadow, body and size is easily adjusted. It is possible to filter by trend (2 moving averages) and by reversal (RSI and Bollinger Bands). This is the most popular price action pattern. A multi-currency dashboard is available. With it, you can easily switch between charts. Trading Patterns: Retest by trend. False breakout. Other. EURUSD, GBPUSD, XAUUSD, ... M15, M30, H1. Input para
        The indicator searches for and displays large shadows on the chart automatically based on volatility. Shadows are additionally filtered by the wave size. The algorithm analyzes the fractal breakdown by the shadow in the specified range and displays the level. In the settings, you can enable a multi-currency dashboard. The alert is selected between the current schedule or the entire dashboard sheet. Signals for large shadows and those that have broken through the fractal level can be turned on s
        The indicator displays the "Rails" pattern on the chart. This pattern consists of two multidirectional candles with identical bodies and small shadows. If on the current timeframe the pattern "Rails", then on the x2 timeframe it will look like a Pin Bar (Doji). This indicator was created to automatically find the pattern in the most efficient way with logically simple settings that you can easily change. There is an option to filter by trend (2 moving averages) and reversal (RSI and Bollinger B
        An indicator that displays the Engulfing candlestick pattern. In the settings, you can specify the type of engulfing (body, shadow and combination). It is possible to filter by trend (2 moving averages) and by reversal (RSI and Bollinger Bands). This is a very popular price action pattern. A multi-currency dashboard is available. With it, you can easily switch between charts. Trading Patterns: Retest by trend. False breakout. Order Block. Other. EURUSD, GBPUSD, XAUUSD, ... M15, M30, H1. Inpu
        The indicator shows a signal on the chart when the second candlestick is inside the first candlestick, i.e. has not gone beyond its limits. This candlestick pattern is called the Inside Bar. This pattern is not as popular as Pin Bar or Engulfing, but it is sometimes used by some traders. There is a possibility to filter by trend (2 moving averages) and by reversal (RSI and Bollinger Bands). Multicurrency panel is available. With its help you can easily switch between charts. Trading patterns:
        The meaning of this indicator is to   find Murray levels on all timeframes   and combine them into   combo levels , including signal levels based on strong Murray levels (+2, +1, 8, 4, 0, -1, -2). The lower the timeframe, the more chances you have to see the combo level immediately. It will be highlighted in color. When you hover over any number, a hint will pop up to which timeframe the level belongs to. But you will always see the current timeframe as the leftmost one. A  smart alert  will hel
        UPD1 Profile Levels MT5
        Vitaliy Kuznetsov
        5 (3)
        The indicator finds the levels of the maximum and minimum price volume (market profile) on the working histogram for the specified number of bars.  Composite profile . The height of the histogram is fully automatic and adapts to any instrument and timeframe. The author's algorithm is used and does not repeat well-known analogues. The height of the two histograms is approximately equal to the average height of the candle. Smart alert will help you to inform about the price concerning the volume l
        Filter:
        Iurie Lupasco
        296
        Iurie Lupasco 2025.08.11 20:37 
         

        полезный индикатор

        Vitaliy Kuznetsov
        42764
        Reply from developer Vitaliy Kuznetsov 2025.08.12 05:16
        Спасибо за высокую оценку
        Reply to review