Support Resistance screnner
- Indicators
-
STE S.S.COMPANY
 Hello,
my name is Ashraf a fintech Software Engineer.
I create amazing forex indicators and expert advisors for Metatrader 4 and Metatrader 5, the best trading platforms.
Use my service and let me build your trading strategies ( Indicator coding or EA coding ) by click on bellow link - Version: 13.20
- Updated: 13 December 2023
- Activations: 10
Support And Resistance Screener Breakthrough unique Solution With All Important levels analyzer and Markets Structures Feature Built Inside One Tool! Our indicator has been developed by traders for traders and with one Indicator you will find all Imporant market levels with one click.
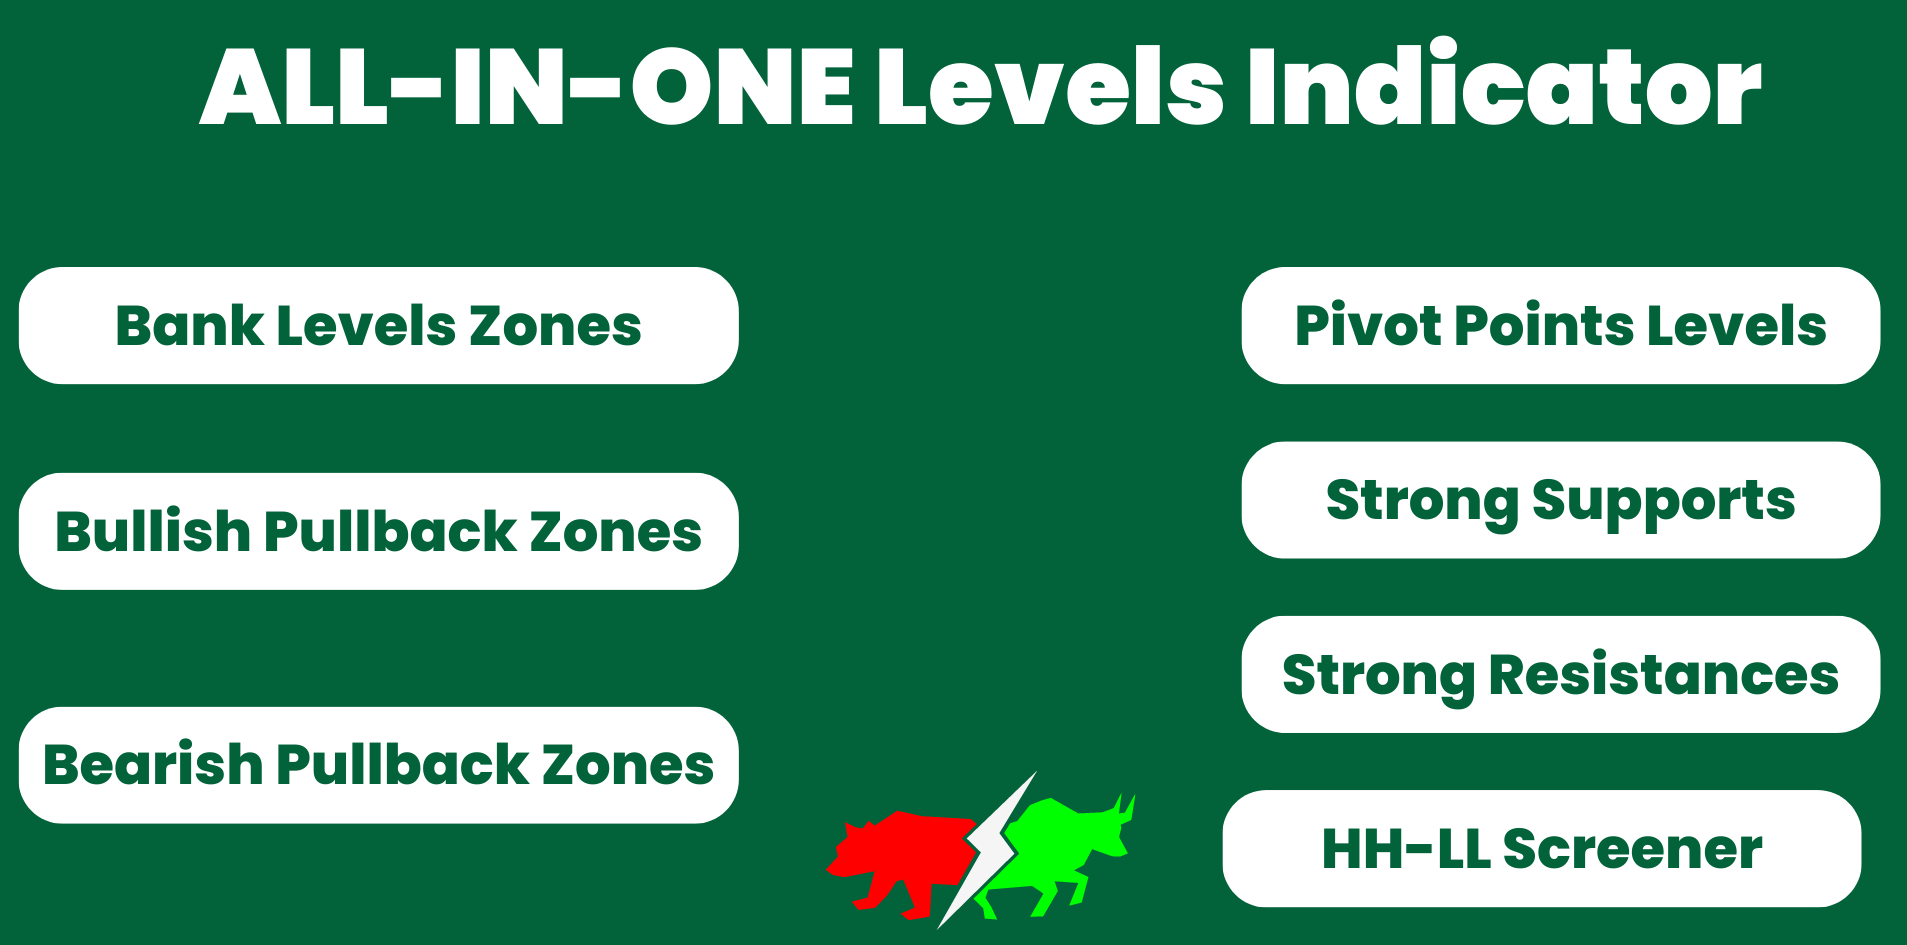
The available tools ( Features ) in our Indicator are :
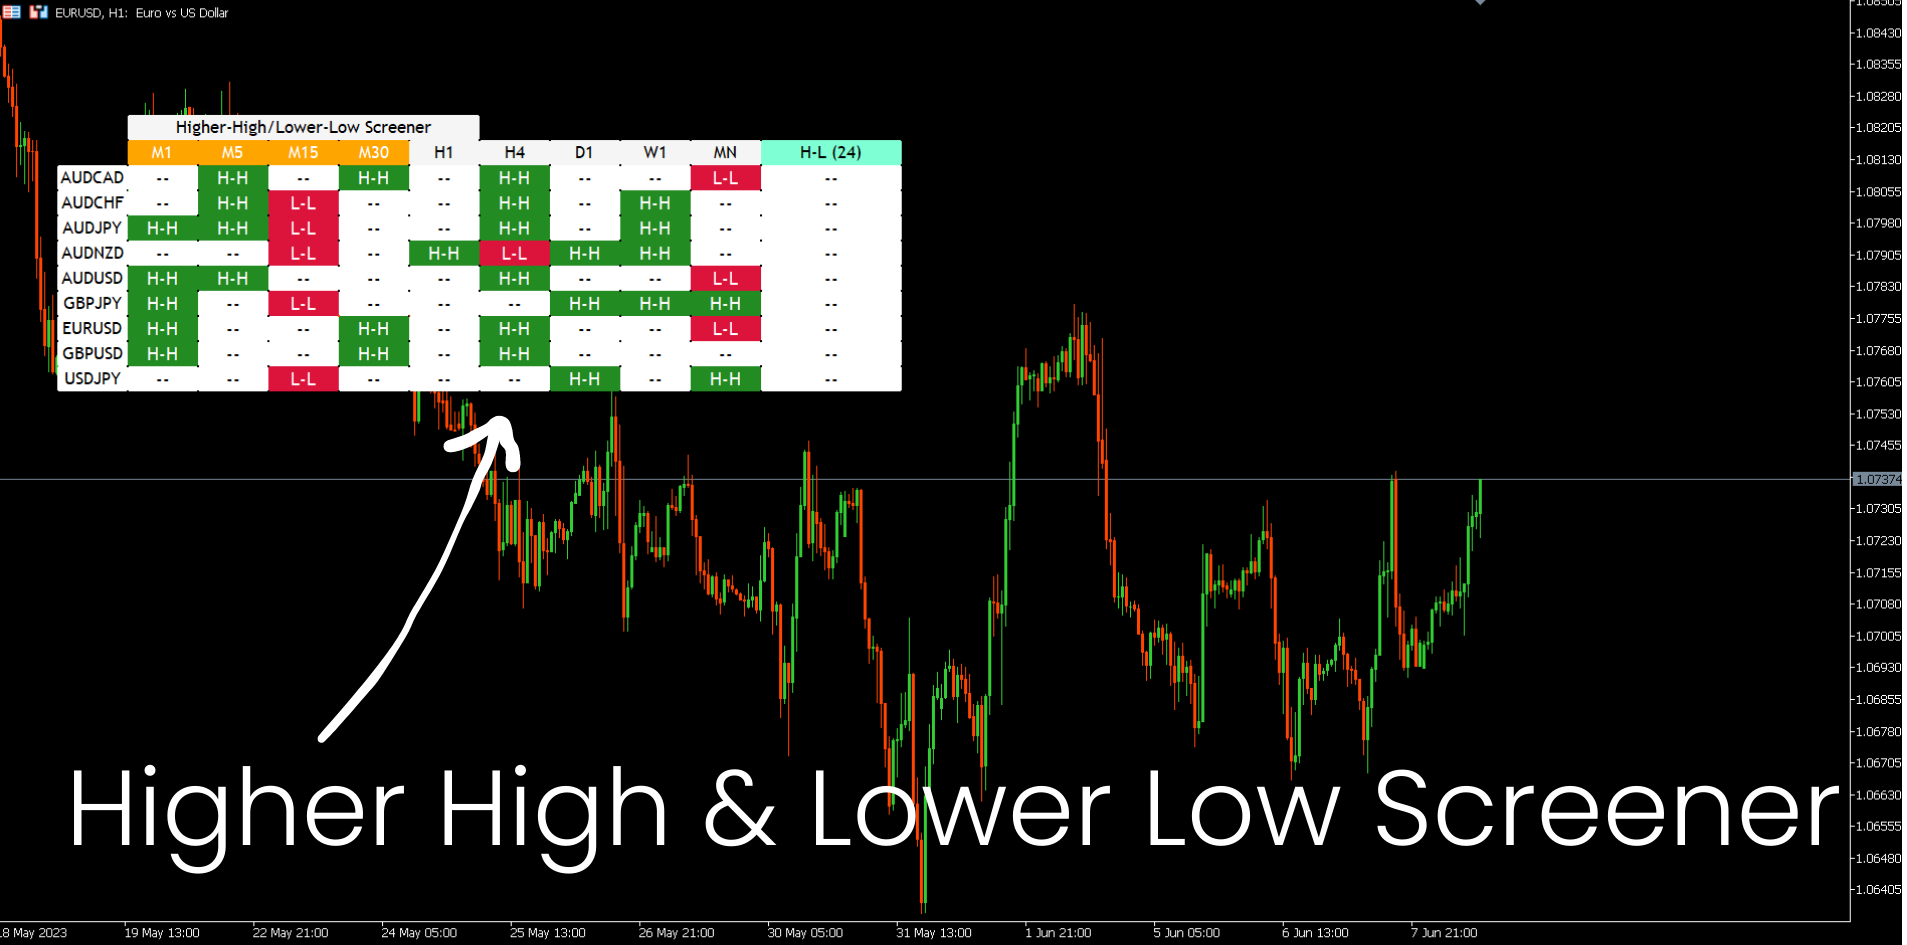
1. HH-LL Scanner( Multi-timeframe and multi-currencies scanner for higher highs and lower lows)
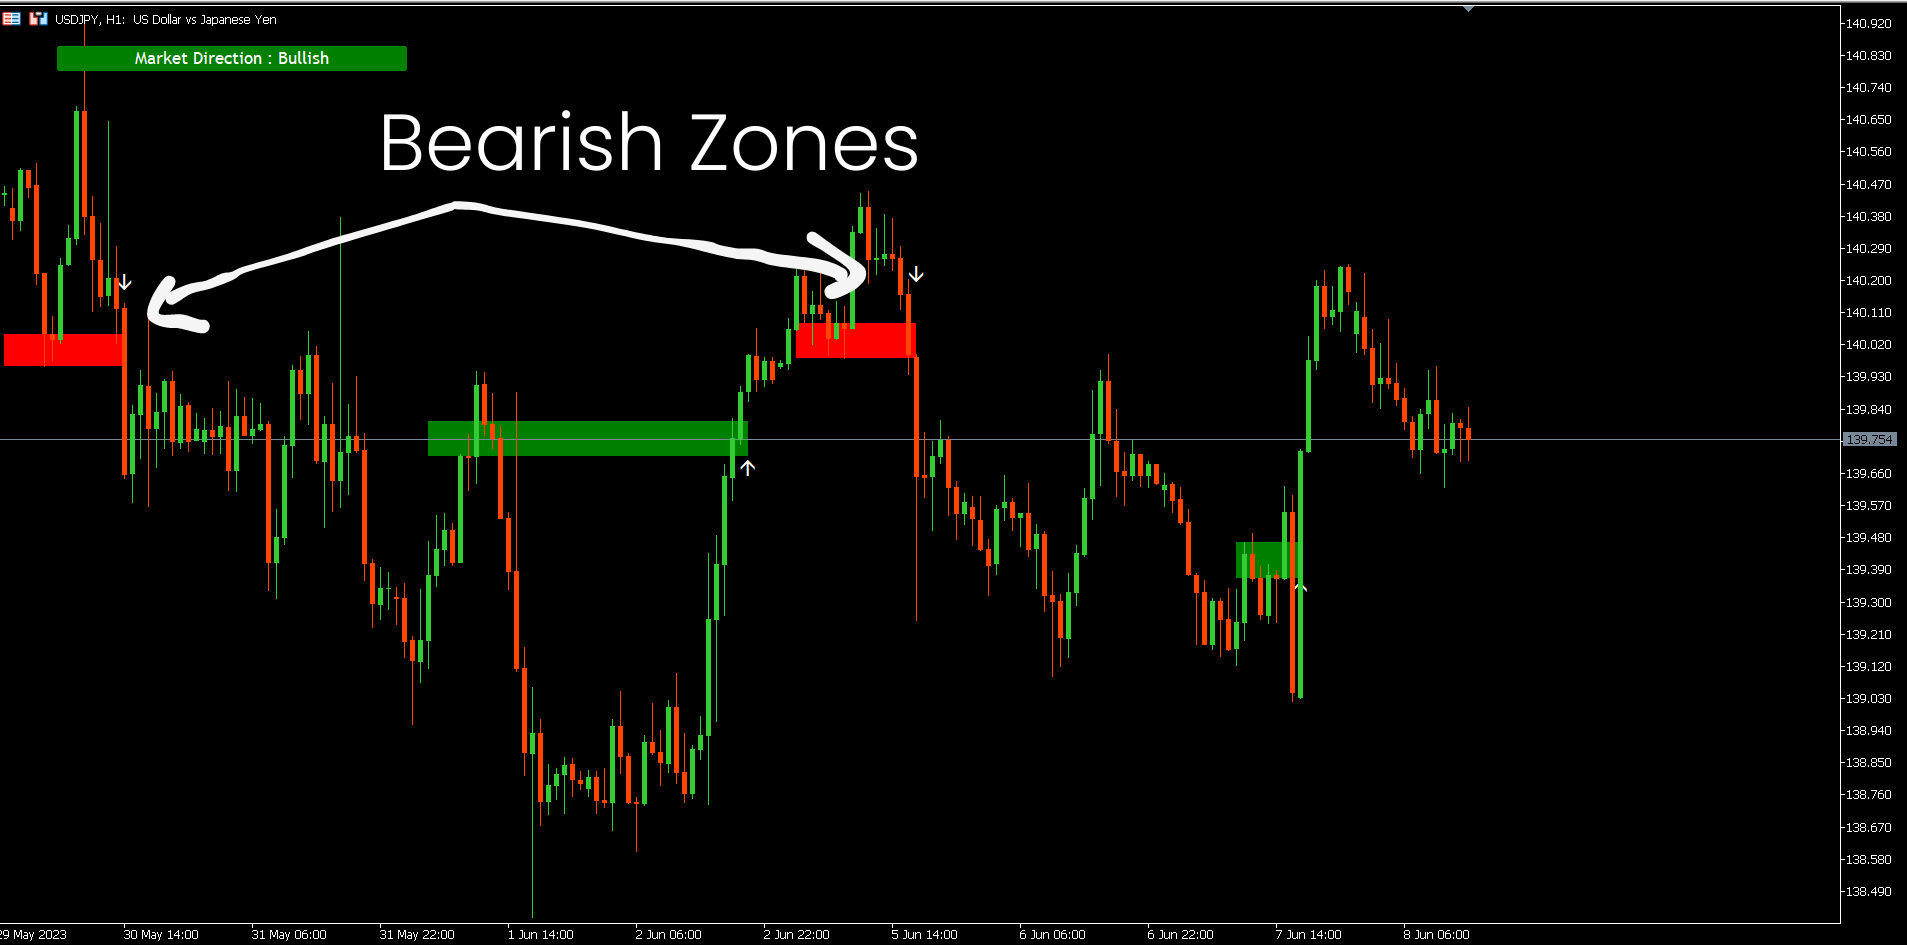
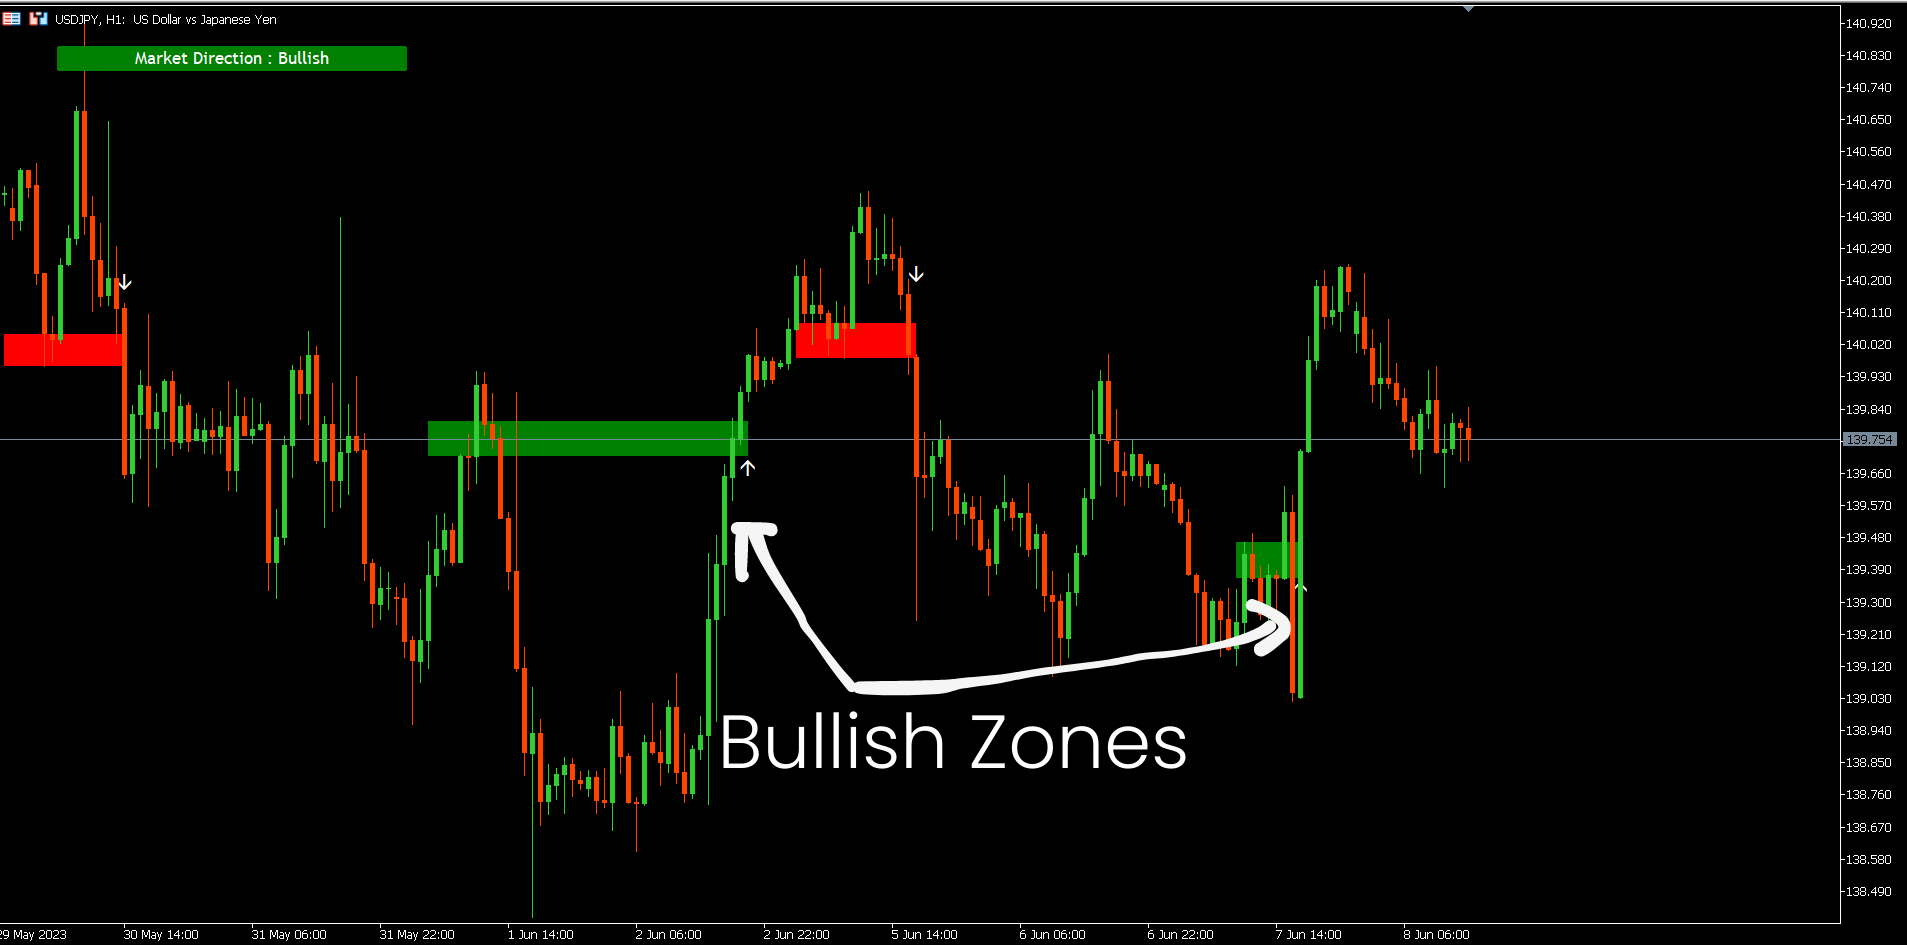
2. Pullback Zones with arrows.
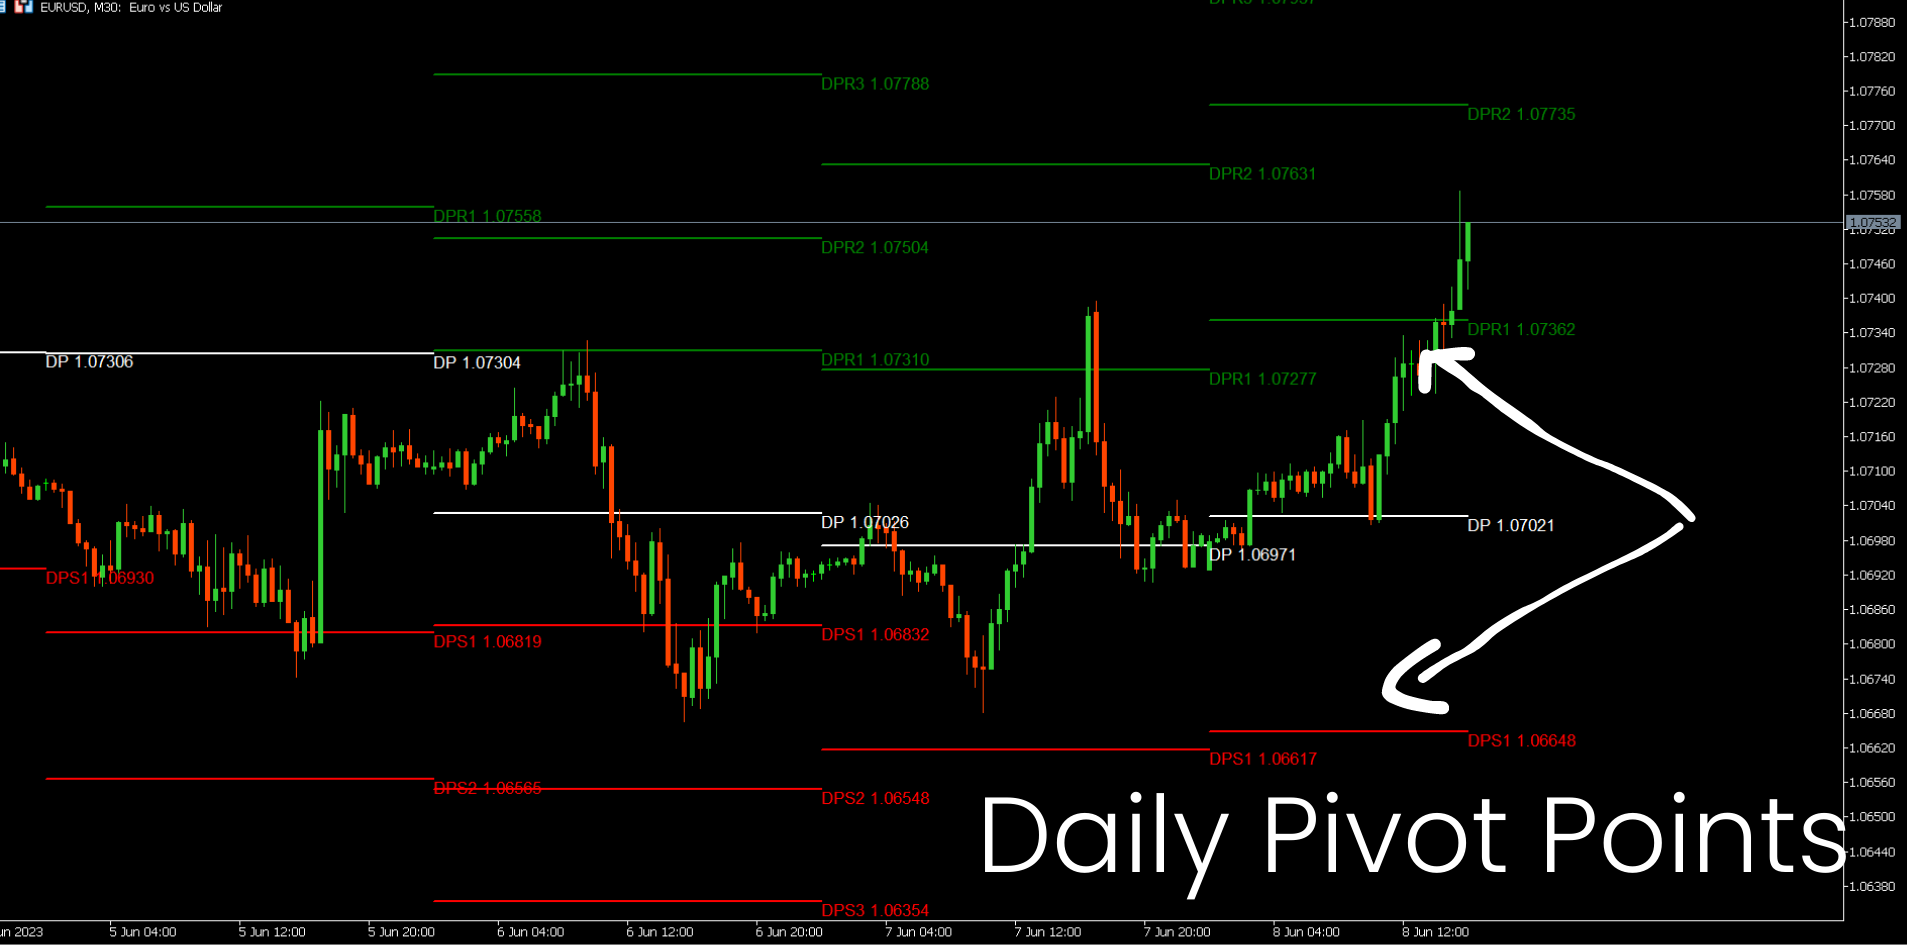
5. Intraday Pivots Points
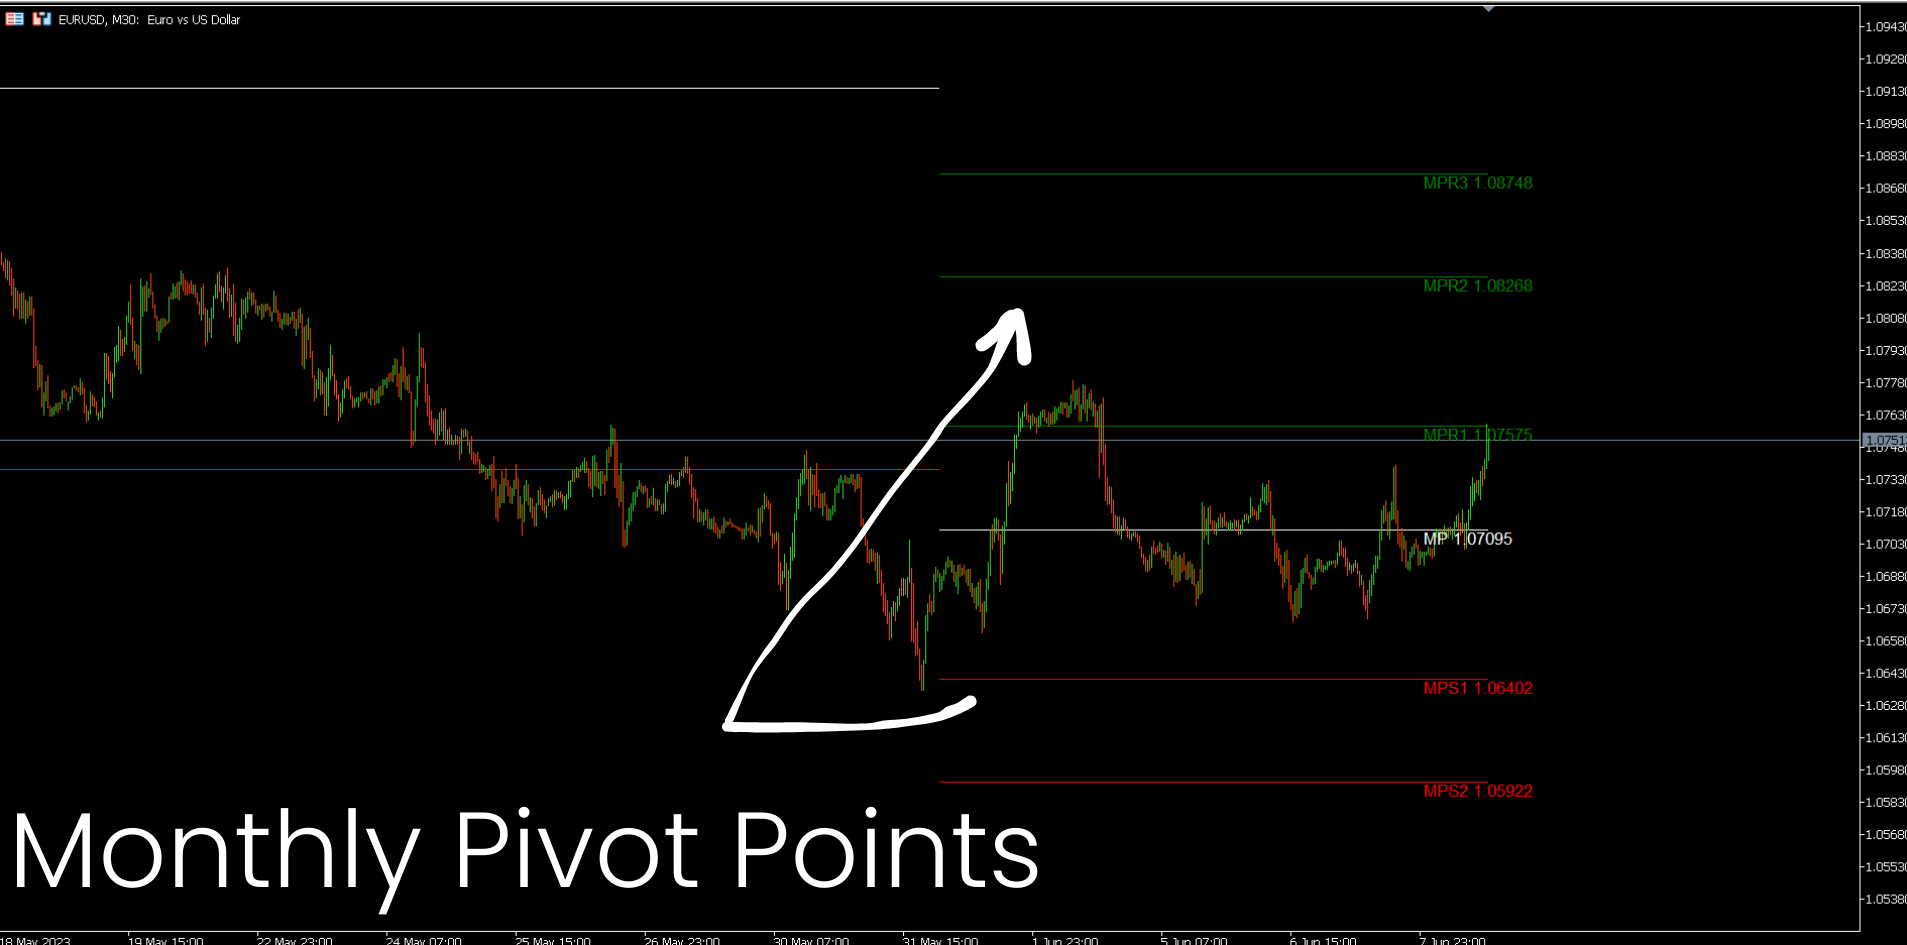
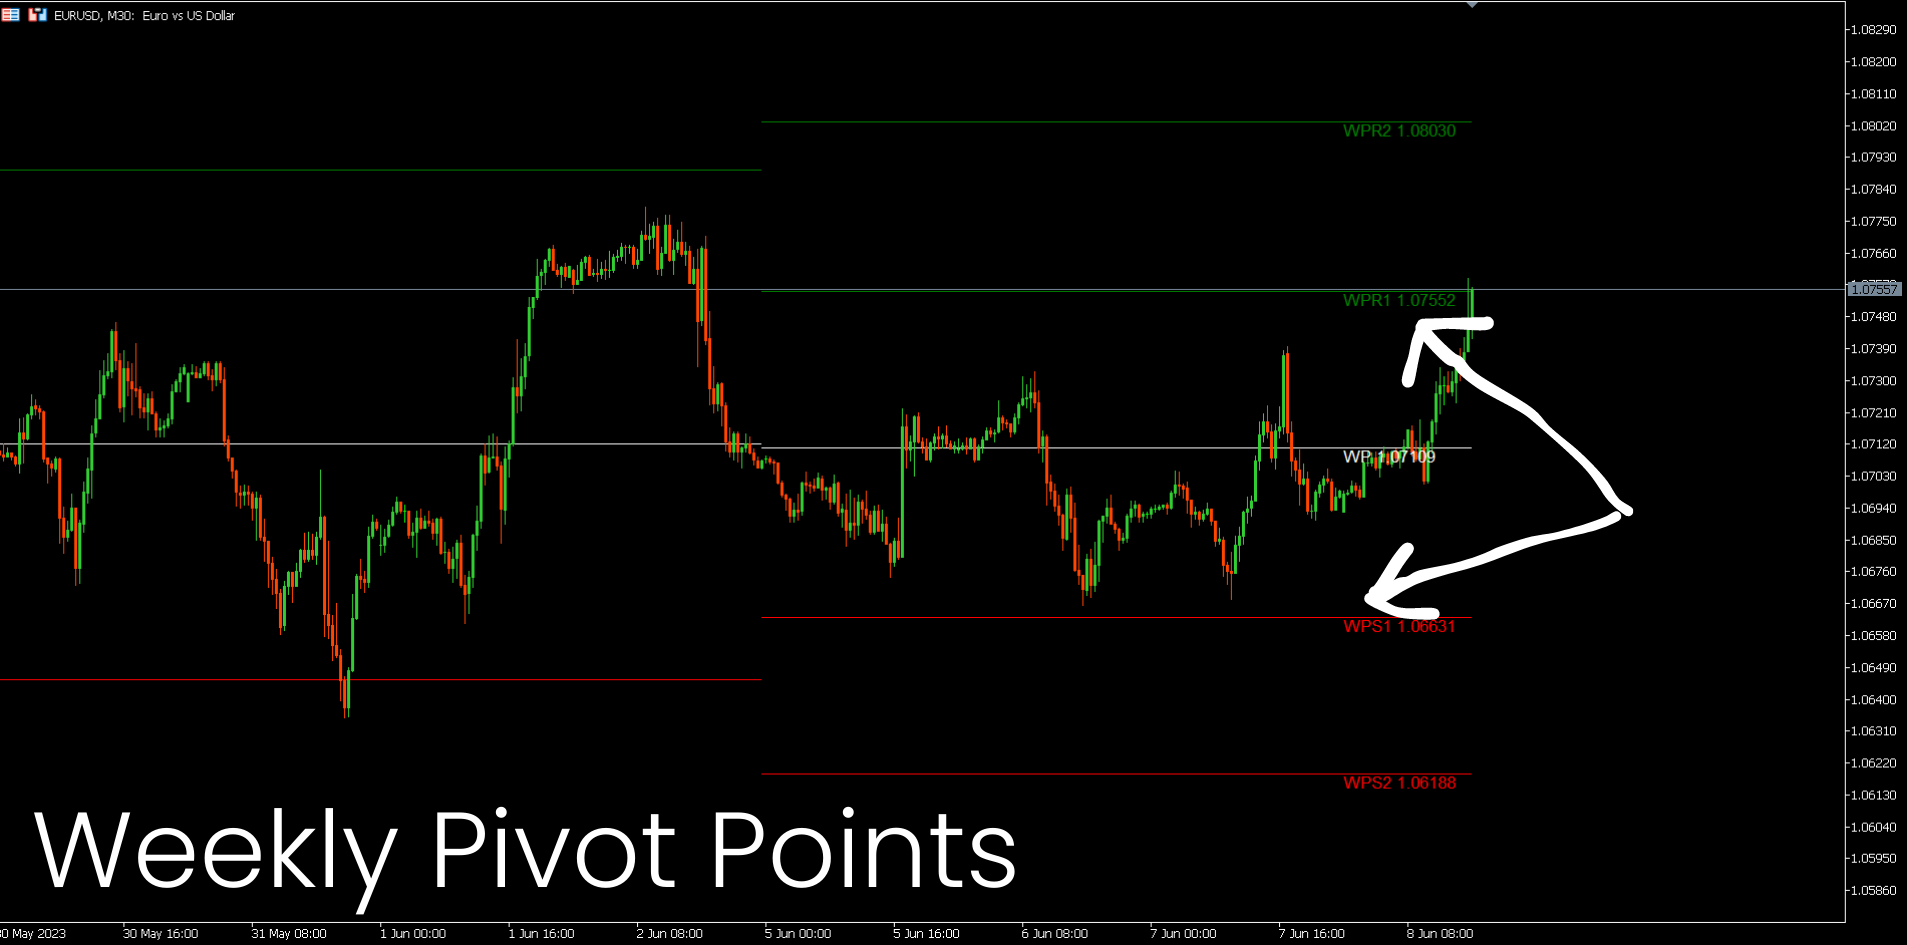
6. Swing Pivots Points
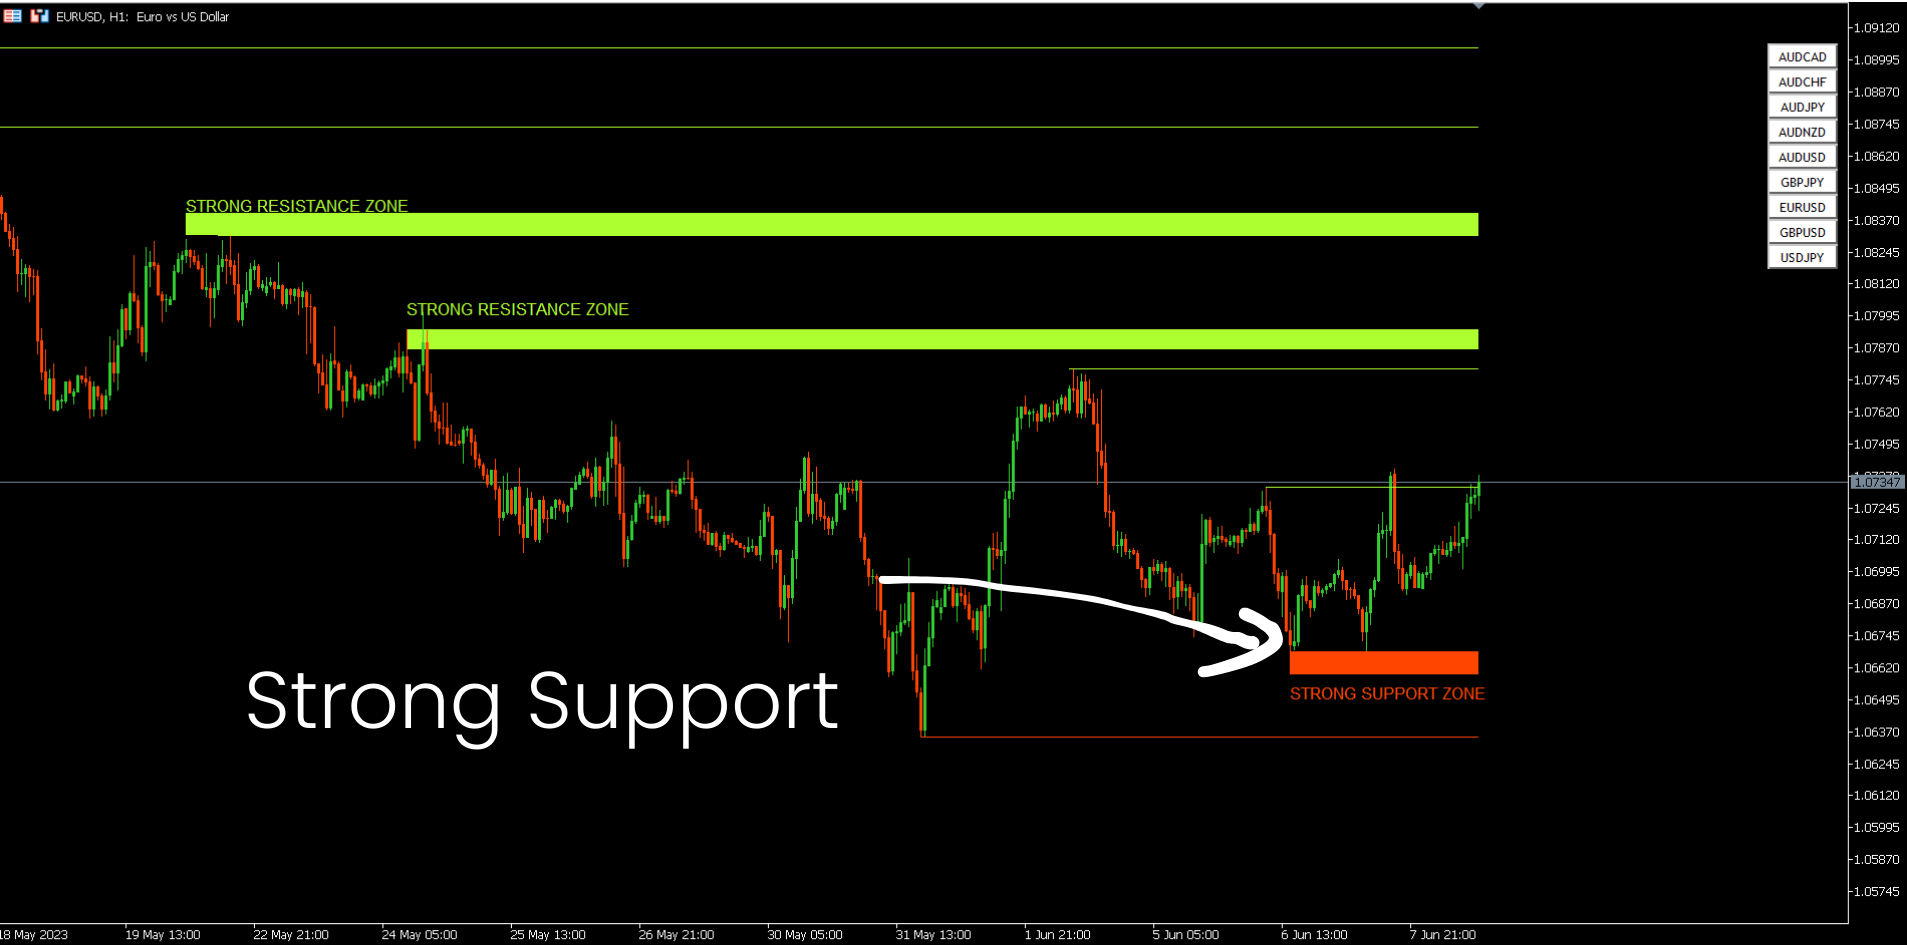
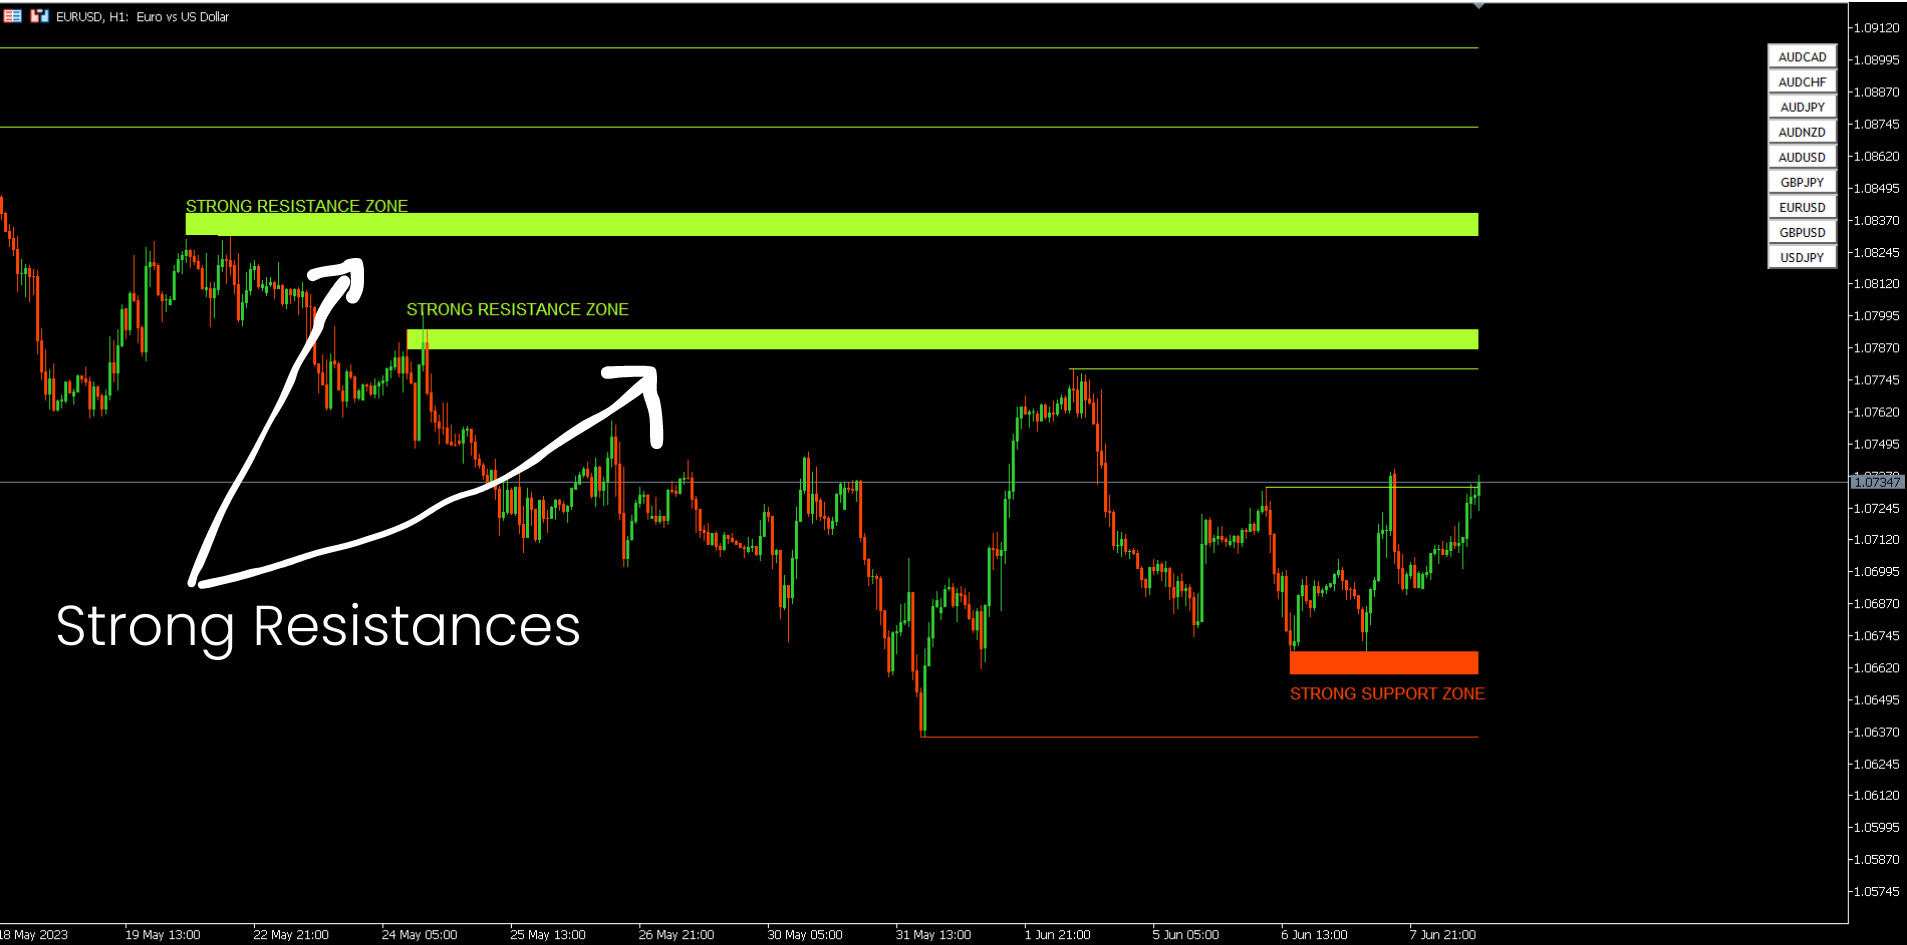
7. Strong Support and Resistance based on Harmonic Pattern and volume.
1. Youtube videos tutorials & real trading examples
By checking our MQL5 Blog, you will find many youtube video tutorials where we explain how to use and how trade with Level Indicator. Click here to find all videos.
It's highly recommended to check those tutorials above.
2. Key Features
- All in one level indicator.
- All types of alerts ( Pop-up alert, puss notification alerts...etc)
- Working with all pairs ( forex, indices, stocks, cryptos, metals...etc)
- Symbols navigator.
3. Documentations
All Support and Resistance Screener documentations ( Instructions ) and strategy details are available in this post in our MQL5 Blog : Click Here.
4. Free Demo version
You can download from here Free demo version to try the indicator without Metatrader Backester limitation : Click here to download free demo.
The free demo version work only USDCAD pair, doesn't have alerts and with limited number of pairs in the HH-LL screener.
5. Bestsellers indicators
You can find Below Our Bestsellers indicators:
| Indicator | Description | Download |
|---|---|---|
| Trend Screener Indicator | All in one tool trend analyzer tool ( Trend Dashboard, Trend reversal alerts...etc) | Click Here |
| Range Analyze Indicator | Range Analyze with Trading Zone breakout. | Click Here |
All the rest of the free and premium indicators are available in our MQL5 seller profile,Click here.
Attention! All our free and paid products can be found only and on exclusivity here, on the official MQL5 website.
6. Contact
If you have some questions or if you need help, Contact me via Private Message.
7. Risk warning
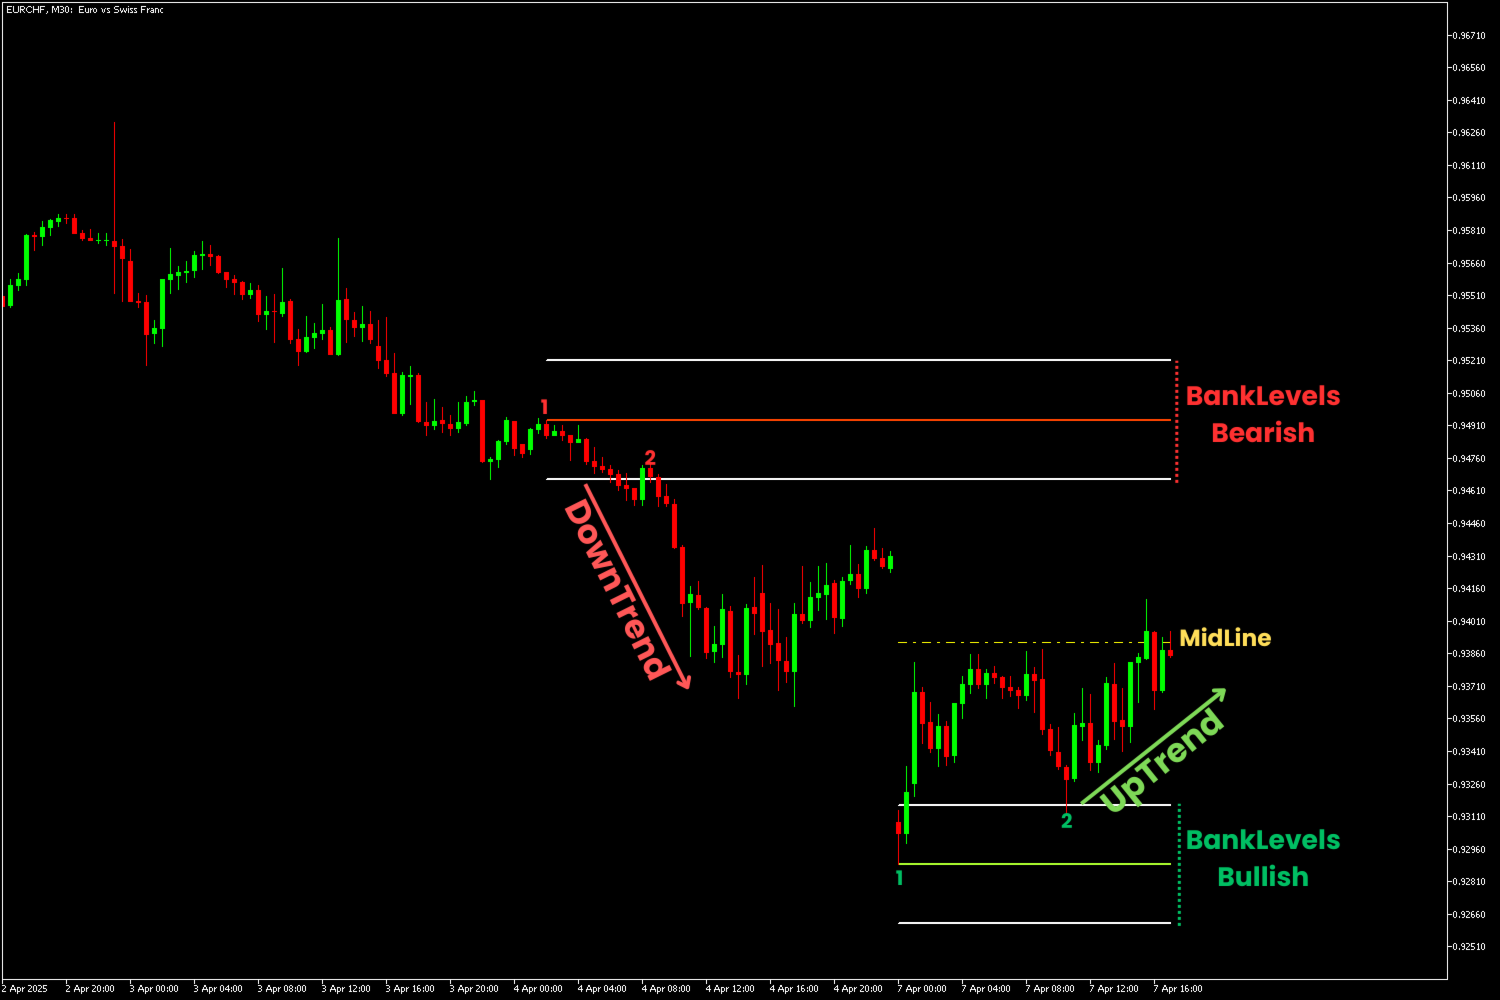
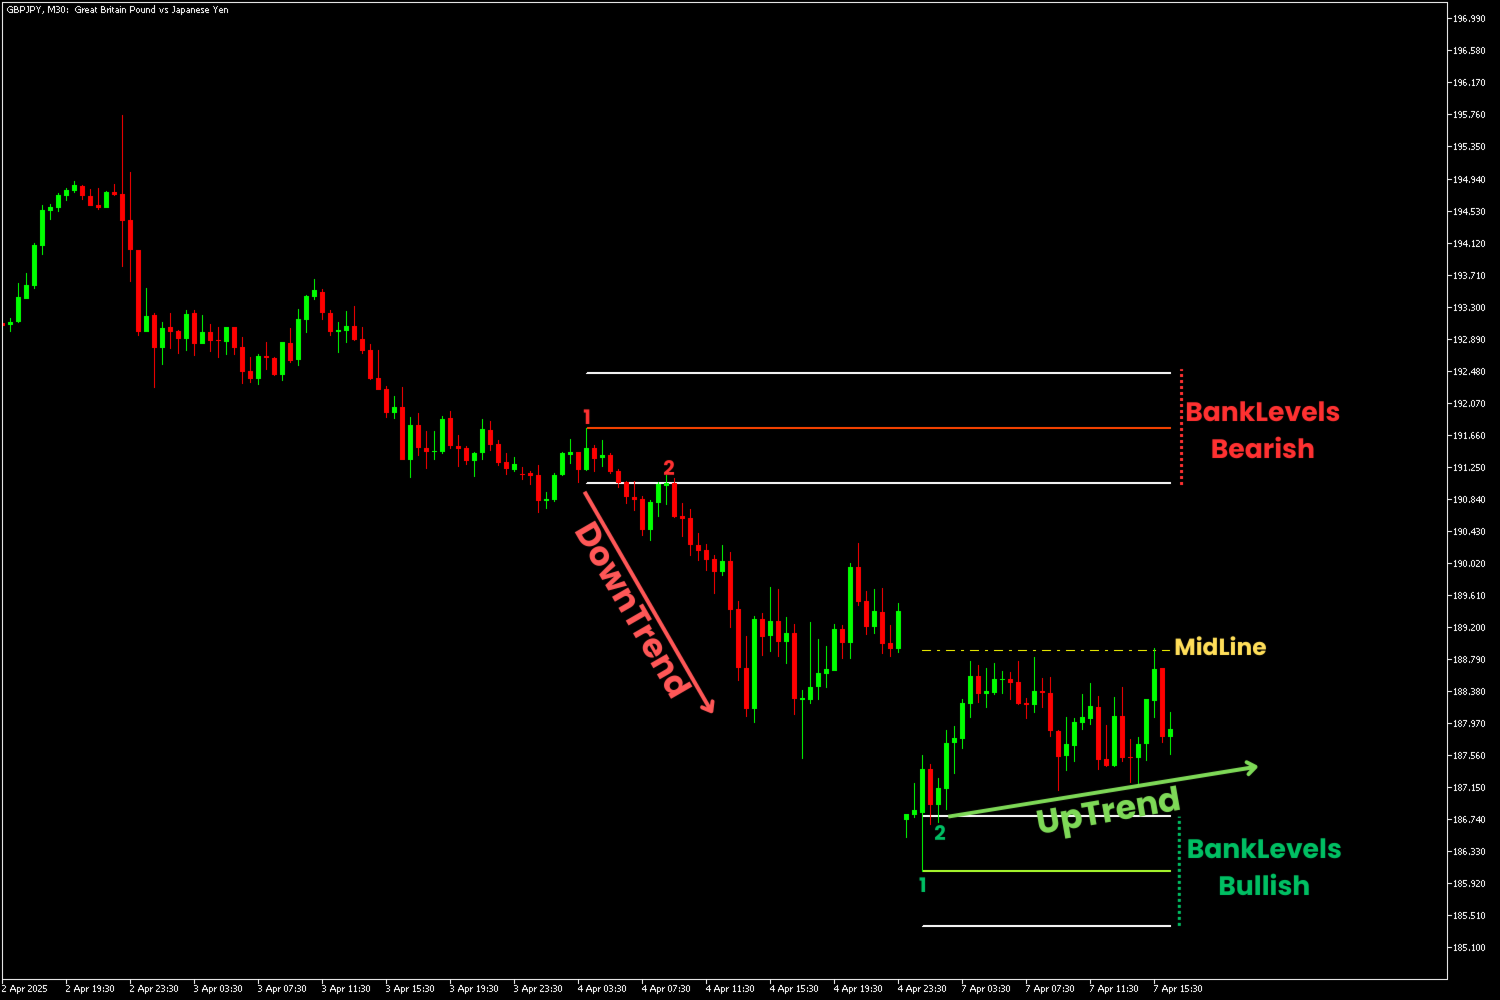
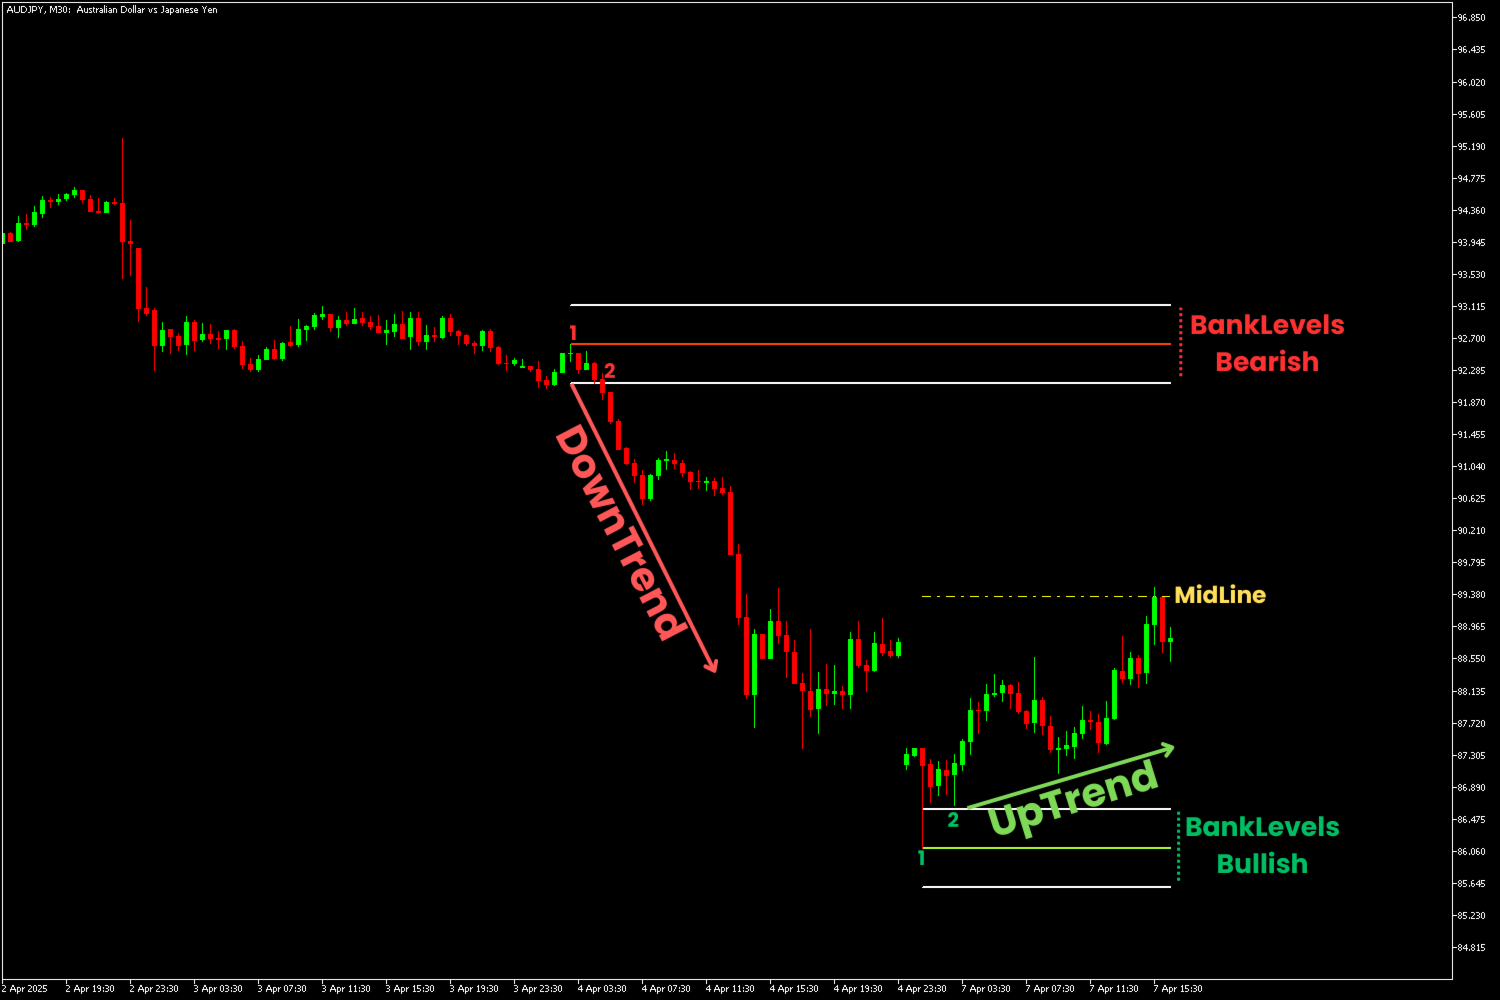
The indicator follows price movements and market structures when outlining Support & Resistance, Pullback Zones, and Bank Levels Zones. The indicator maintains only the valid zones on the chart. This implies that when a support zone, pullback zone, or bank level zone is breached, it will be removed from the chart as it is no longer valid.
8. Author
SAYADI ACHREF , fintech software engineer and founder of Finansya


I have been using this trading system for three years. I've found that having all three indicators is significantly more effective, as they create a complete and comprehensive system.