KT Psar Arrows

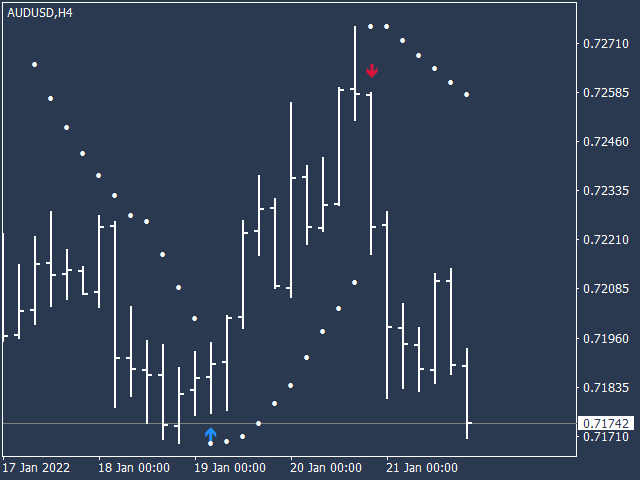
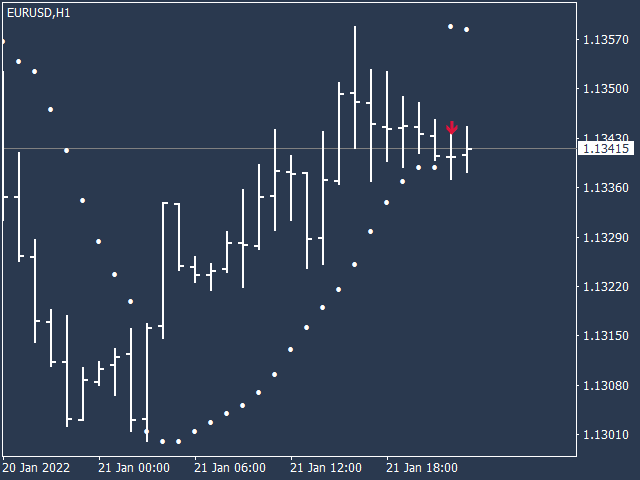
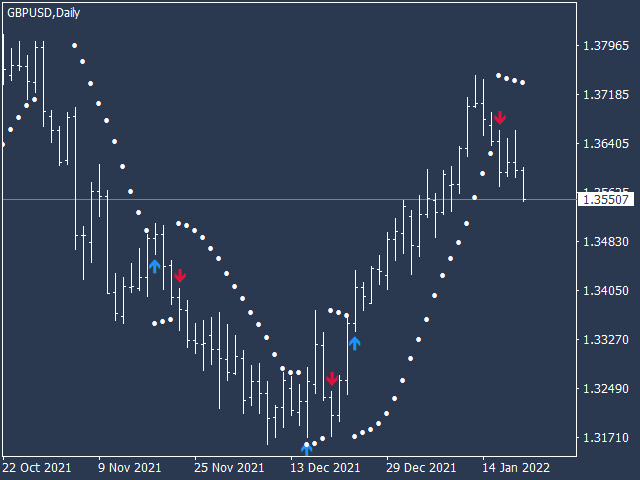
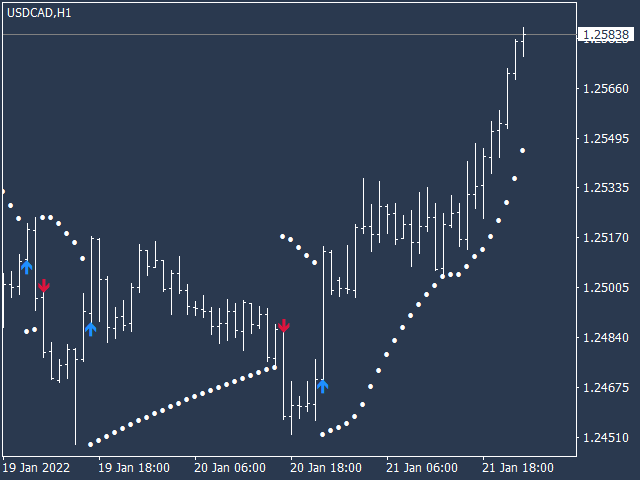
KT Psar Arrows plots the arrows on chart using the standard Parabolic SAR indicator. A bullish arrow is plotted when the candle's high touch the SAR. A bearish arrow is plotted when the candle's low touch the SAR. The signals are generated in the real-time without waiting for the bar close. 


Features

  • A beneficial tool for traders who want to experiment with the trading strategies that include the use of Parabolic Sar indicator. 
  • Can be used to find turning points in the market.
  • Use custom PSAR inputs.
  • All MT4 alerts are available.

A Word of Caution: The Parabolic SAR is a lagging and strict mechanical indicator. Every potential trade should be filtered by well-defined rules.  
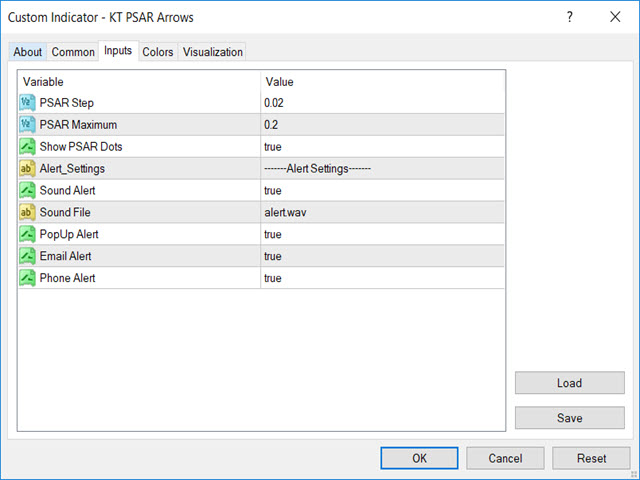
 
Input Parameters

  • PSAR Step: Insert the step value.
  • PSAR Maximum: Insert the maximum value.
  • Show PSAR Dots: Show/hide the PSAR dots. Arrows will work normally without the PSAR dots.
  • Rest of the inputs are self-explanatory.
Recommended products
Please contact me at telegram  https://t.me/smartforex7 After purchasing SmartForex Indicator then Use This Indicator...................... SMART EXIT PROFIT LINE Indicator is very Helpful with SmartForex Indicator ........................................ SMART EXIT PROFIT LINE Indicator Attach with SmartForex Indicator after then Red Line Show Exit buy Profit , Green Line show Exit Sell Profit................
FREE
What is the Super Ichi Indicator? Super Ichi is an advanced combination of Ichimoku Kinko Hyo and SuperTrend indicators. This powerful technical analysis tool is designed to identify market trends and generate trading signals. What Does It Do? Dual-Level Trend Analysis : Uses customized versions of Tenkan-sen and Kijun-sen lines Automatic Signal Generation : Displays visual markers (arrows) at crossover points Real-Time Alert System : Provides audio and visual alerts when new signals occur Dynam
FREE
BinaryMartini
Abdulkarim Karazon
an indicator for binary trading based on 3ma cross with macd , it gives buy and sell signals on bar open and it Doesn't Repaint or Back paint the indicator is not focused on high win rate as it is made for martingale trading , the indicator focus on lowest losing signal count in a row. Strategy : Minimum Deposit is 1000 unite , we start the trading with 1 unite (trade size is 1 unite for every 1000 capital) we double trade size on next signal if current signal lost , we only take indicator sett
" Valiant Strong Trend " - Your Ultimate MT4 Signal Indicator Are you ready to elevate your trading game to new heights? Look no further than the "Valiant Strong Trend" MT4 signal indicator, your indispensable tool for navigating the complex world of financial markets. Key Features: Precise Trend Identification : "Valiant Strong Trend" employs advanced algorithms to accurately identify market trends, whether they are bullish or bearish. Say goodbye to guesswork and hello to informed trading deci
ACB Breakout Arrows Scanner MT4
KEENBASE SOFTWARE SOLUTIONS
It's a multi-symbol and multi-timeframe scanner for our indicator - ACB Breakout Arrows . With default settings, it scans for the buy/sell signals on 28 currency pairs and 9 time-frames concurrently .  Features It can scan 252* combinations of symbols and time-frames from a single chart. Open the signal's chart loaded with a predefined template with a single click.  Easy drag n drop anywhere on the chart. Real-time alerts with popup, sound, push-notifications and email alerts.  Input Parameter
Boost binary option profesional
Sebastian Alejandro Merino Sepulveda
Binarias & Forex (+90% Ratio-Win Next Candle) Espere que el precio llegue a una buena zona (fuerte) sea soporte, resistencia, zona de oferta o demanda, fibonacci level key, cifra redonda. Haciendo lo anterior definitivamente habrá una reversión en el precio y obtendrá su ITM en primera vela dando una efectividad del 100% siguiendo la tendencia. Es muy importante estar atento a las noticias fundamentales en el mercado y estas no afecten tu trading. Sesiones comerciales: cualquiera (24 horas).
PTW NON REPAINT TRADING SYSTEM + HISTOGRAM Non-Repainting ,   Non-Redrawing   and   Non-Lagging  Trading System. Does the following: - Gives Accurate Entry and Exit Points - Scalping, Day and Swing Trading  - 95% Accuracy  - Targets, where to take profits. - Shows Trends, Support and resistance levels - Works on All Brokers - Works on All Currencies, CFDs and Stocks - It does not place trades for you, it only shows you what trades to place. - It works on All Timeframes - It is for Trend or ran
Session Kill zones with panel for quick changes. Asia Killzone London Killzone New York Killzone London Close Killzone In this indicator GMT+2 timings are used that are most common among many brokers. read the image attached in the screenshots to know more about sessions adjustments Session timings can be changed according to your broker timings and day light savings. Thank you :) Always open to feedback and criticism if it helps me provide you more value. - Rahul  My other indicators you may l
This indicator is an indicator for automatic wave analysis that is perfect for practical trading! Case... Note:   I am not used to the Western name for wave classification. Influenced by the naming habit of Chaos Theory (Chanzhongshuochan), I named the basic wave as   pen   , the secondary wave band as   segment   , and the segment with trend direction   as main trend segment   (this naming method will be used in future notes, let me tell you in advance), but the algorithm is not closely relat
IntraScalpermt4
Mangesh Popat Ubale
IntraScalpermt4 Indicator   is an advanced, dynamic level-providing strategy/ Signals built in proven price action principles. At the start of every trading session, it automatically calculates the decisive   Levels —a key point that DECIDER guides high-probability trade opportunities. Indicators Including:- 1.  Day Trading Levels. 2.  IntraTrend Line for Scalping using M1 TF. 3.  Dynamic IntraScalper providing supply or demand zone on chart. 4.  EA Setting/Documentation in Indicator=> About T
FREE
Niubility Trend  Niubility Trend displays the trend direction for all time frames in real time. You'll see at a glance at which direction the trends are running, how long they last and how powerful they are. All this makes it an easy-to-use trend trading system for beginners, advanced and professional traders. Features Easy to trade Customizable colors and sizes It is non-repainting and non-backpainting It is fantastic as a trailing stop method It implements alerts of all kinds
No Repaint Bext
Andrey Kozak
1 (1)
No Repaint Bext is a ready-made trading system. Shows when to open and when to close trades, as well as in which direction. Every time a green arrow appears, you need to open a buy trade. Close all buy trades when a red arrow appears. The same goes for the opposite direction, every time a red arrow appears, open sell trades and close them all when a green arrow appears. We use the M5 timeframe for trading. You can trade on any cozy pair. This indicator does not repaint and practically does not
The R Scalper Arrows indicator delivers easy to read buy and sell signal arrows for any forex pair. It works good for short-term trend predictions: Up arrows suggest the pair is short-term trending up. Down arrows suggest the pair is short-term trending down. For long trades, place your stop-loss below the dots. For short trades, place your stop-loss above the dots. Tip You can use this indicator together with a longer term period trend-following forex indicator such as a simple moving average o
Crypto_Forex Indicator "TREND Histogram" for MT4, No Repaint. - TREND Histogram indicator is much more sensitive and efficient than any standard Moving Averages cross. - Indicator can be in 2 colors: Yellow (gold) for bearish trend and Green for bullish trend (colors can be changed in settings). - TREND Histogram has built-in Mobile and PC alerts. - It is great idea to combine this indicator with any other trading methods: Price Action, VSA, other indicators. - This histogram is one of the top
Introducing the Austin Trend Scanner: Your Ultimate Tool for Timely Trend Identification. The Austin Trend Scanner is a groundbreaking MetaTrader 4 indicator meticulously engineered to provide traders with precise trend reversal signals across multiple timeframes. Built upon advanced algorithms and non-repainting technology, this indicator offers unparalleled accuracy in identifying profitable trading opportunities. Key Features: 1. Non-Repainting Signals: The Austin Trend Scanner delivers non
Introducing the Moving Average Crossover Scanner Pro, a powerful and versatile Multi-symbol,   Multi-timeframe   indicator designed to enhance your trading decisions. This advanced indicator incorporates Moving Average (MA) crossovers and offers additional features to provide fast and reliable alerts. With the Moving Average Crossover Scanner Pro, you can benefit from the unique characteristics of MA crossovers across multiple currency pairs and timeframes. The indicator's comprehensive dashbo
The indicator determines a special pattern of Joe Dinapoli. It gives very high probability buy and sell signals. Indicator does not repaint. Indicator Usage Buy Signal ''B'' Entry : Market buy order at signal bar close Stop : Low of signal bar Take Profit : First swing high Sell Signal ''S'' Entry : Market sell order at signal bar close Stop : High of signal bar Take Profit : First swing low Indicator Parameters Fast EMA : External Parameter (should be kept as default) Slow EMA: External Parame
Super Cross Strong Signal is an indicator that generates trade arrows. It generates trade arrows with its own algorithm. These arrows give buying and selling signals. The indicator certainly does not repaint. Can be used in all pairs. Sends a signal to the user with the alert feature. Trade rules Enter the signal when the buy signal arrives. In order to exit from the transaction, an opposite signal must be received. It is absolutely necessary to close the operation when an opposite signal is re
Hydra Trend Rider is a non-repainting, multi-timeframe trend indicator that delivers precise buy/sell signals and real-time alerts for high-probability trade setups. With its color-coded trend line, customizable dashboard, and mobile notifications, it's perfect for traders seeking clarity, confidence, and consistency in trend trading. Setup & Guide:  Download  MT5 Version here. To learn how to use the Indicator: Indicator Manual & Guide -   Read Here Exclusively for you: It's your chance to st
Dark Breakout
Marco Solito
4.89 (9)
Dark Breakout   is an Indicator for intraday trading. This Indicator is based on Trend Following  strategy, providing an entry signal on the breakout. The signal is provided by the arrow, which confirms the breaking of the level. We can enter in good price with this Indicator, in order to follow the main trend on the current instrument. It is advised to use low spread ECN brokers. This Indicator does Not repaint and N ot lag . Recommended timeframes are M5, M15 and H1. Recommended working pairs
TrendSys
Maryna Shulzhenko
Trend Sys, an indicator designed to detect trends in price movement and allows you to quickly determine the direction of the trend. The best way to trade Trend Sys is to enter the market when Trend Sys peaks and goes the other way. This is a sign of a trend reversal. I hope you enjoy this indicator and leave your comments to make it even better. Good luck and happy trading.
This is based on Demark's TD Sequential and TD Combo set of indicators. It mostly has the TD Sequential features. It contains the Arrows Indicator showing Buy/Sell signals and the scanner dashboard. Both are for MT4 (Metatrader 4) Platform. Read in detail in this blog post. And get extra indicators here: https://www.mql5.com/en/blogs/post/749596 and commentary about signals and how to wait for right time: https://www.mql5.com/en/blogs/post/759157 Feature List: - Set TD Setup (9), Countdown (13
To access the TD sequential Scanner for MT5, please check https://www.mql5.com/en/market/product/123369?source=Site +Market+My+Products+Page. One of the MT5 versions includes additional timeframes such as M1, M2, M3,H2,H6,H8 and so on.( https://www.mql5.com/en/market/product/123367?source=Site +Market+My+Products+Page) TD Sequential Scanner: An Overview The TD Sequential scanner is a powerful technical analysis tool designed to identify potential price exhaustion points and trend reversals in fi
Special Agent
Vitalii Zakharuk
The advantage of working on the Special Agent signal indicator is that the trader does not need to independently conduct a technical analysis of the chart. Determining the market trend is an important task for traders, and the tool gives ready-made signals in the form of directional arrows. This tool is an arrow (signal). Special Agent is a trend indicator, a technical analysis tool that helps to determine the exact direction of the trend: either up or down price movement for a trading pair of
RBCI hist
Sergey Zhukov
The RBCI hist indicator is an adaptive trend histogram, that eliminates noise using a Low-pass filter, which passes the lower frequencies and cuts off hight frequencies of the price fluctuations. The signal (depending on the strategy chosen by trader) is the intersection of the zero line by the indicator, as well as the change in the histogram color. The change in the histogram color serves as an early signal for opening positions towards the trend. The position of the indicator relative to the
Arrow up down
Levi Kevin Midiwo
Arrow up down is a mt4 indicator that shows various levels to enter the market. It consists of two signals; Buy signal Sell signal Buy signals are shown as blue arrows on the chart once you install the indicator. Sell signals are shown as red signals on the chart. The indicator uses other underlying indicators like moving average together with statistical calculations to generate signals.
Introducing the Donchian Channels indicator for MQL4, a powerful technical analysis tool designed to boost your trading success. This indicator consists of four lines that represent the upper and lower boundaries of price movement over a specified period. With the Donchian Channels indicator, you can easily identify potential breakouts and reversals in the market. The upper line shows the highest high of the specified period, while the lower line represents the lowest low. The space between thes
Introduction to Fractal Pattern Scanner Fractal Indicator refers to the technical indicator that makes use of the fractal geometry found in the financial market. Fractal Pattern Scanner is the advanced Fractal Indicator that brings the latest trading technology after the extensive research and development work in the fractal geometry in the financial market. The most important feature in Fractal Pattern Scanner is the ability to measure the turning point probability as well as the trend probabi
Rebate gnome
Vasilii Konovalov
Rebate robot. The money on the deposit rotates around zero, while a lot of transactions are made and the rebate is stuffed.It does not load the deposit, there is a stop loss and take profit.It is necessary to bet on several instruments at once, pairs can be any, but it is recommended to bet on those in which the trend is clearly traced on the daily chart. With prolonged reversals, the robot loses, but it happens very slowly and relatively safely, so it is recommended to track the trend at least
Strategy Overview (Best for Scalping) - Non-repainting A sophisticated multi-filter trading system designed to identify high-probability entry points with exceptional precision. This proprietary methodology combines multiple confirmation layers to generate signals with high statistical reliability. ATTACH THE INDICATOR TO RENKO CHART Entry Conditions: Buy Entry: Price is above the Green line Up Arrows are plotted Sell Entry: Price is above the Red line Down Arrows are plotted
Buyers of this product also purchase
Gann Made Easy
Oleg Rodin
4.83 (157)
Gann Made Easy is a professional and easy to use Forex trading system which is based on the best principles of trading using the theory of W.D. Gann. The indicator provides accurate BUY and SELL signals including Stop Loss and Take Profit levels. You can trade even on the go using PUSH notifications. PLEASE CONTACT ME AFTER PURCHASE TO GET TRADING  INSTRUCTIONS AND GREAT EXTRA INDICATORS   FOR FREE! Probably you already heard about the Gann trading methods before. Usually the Gann theory is a ve
Scalper Inside PRO
Alexey Minkov
4.74 (69)
An exclusive indicator that utilizes an innovative algorithm to swiftly and accurately determine the market trend. The indicator automatically calculates opening, closing, and profit levels, providing detailed trading statistics. With these features, you can choose the most appropriate trading instrument for the current market conditions. Additionally, you can easily integrate your own arrow indicators into Scalper Inside Pro to quickly evaluate their statistics and profitability. Scalper Inside
M1 Sniper
Oleg Rodin
5 (20)
M1 SNIPER is an easy to use trading indicator system. It is an arrow indicator which is designed for M1 time frame. The indicator can be used as a standalone system for scalping on M1 time frame and it can be used as a part of your existing trading system. Though this trading system was designed specifically for trading on M1, it still can be used with other time frames too. Originally I designed this method for trading XAUUSD and BTCUSD. But I find this method helpful in trading other markets a
Atomic Analyst
Issam Kassas
5 (4)
First of all Its worth emphasizing here that this Trading Indicator is   Non-Repainting , Non Redrawing and Non Lagging Indicator   Indicator, Which makes it ideal from both manual and robot trading.  User manual: settings, inputs and strategy . The Atomic Analyst  is a PA Price Action Indicator that uses Strength and Momentum of the price to find a better edge in the market. Equipped with Advanced filters which help remove noises and false signals, and Increase Trading Potential. Using Multiple
Trend Screener
STE S.S.COMPANY
4.79 (95)
Trend Screener Indicator --Professional Trend Trading & Market Scanning System for MetaTrader Unlock the true power of trend trading with Trend Screener Indicator — a complete multi-currency, multi-timeframe trend analysis solution   powered by Fuzzy Logic,Trend Pulse Technology  and advanced market structure algorithms.   Trend Screener transforms your MetaTrader platform into a professional-grade Trend Analyzer and Market Scanner, helping you identify high-probability trend opportunities, ear
Market Makers
Mohamed Hassan
5 (3)
After purchase, contact me privately to receive 7 days of free testing with EA Forex Proton. This advanced MT4 trading robot automatically executes signals from any MT4 indicator, including Market Makers. The latest version also includes AI integration, allowing each trade signal to be analyzed using Artificial Intelligence. Market Makers is a powerful price action trading system designed to identify high-probability Buy and Sell opportunities based on market momentum, volatility, and price po
Trend Lines PRO
Roman Podpora
5 (1)
TREND LINES PRO    helps understand where the market is truly changing direction. The indicator shows real trend reversals and points where major players re-enter. You see   BOS lines   Trend changes and key levels on higher timeframes — without complex settings or unnecessary noise. Signals don't repaint and remain on the chart after the bar closes. VERSION MT 5     -     Reveals its maximum potential when paired with the   RFI LEVELS PRO  indicator What the indicator shows: Real shifts   tren
The " Dynamic Scalper System " indicator is designed for the scalping method of trading within trend waves. Tested on major currency pairs and gold, compatibility with other trading instruments is possible. Provides signals for short-term opening of positions along the trend with additional price movement support. The principle of the indicator. Large arrows determine the trend direction. An algorithm for generating signals for scalping in the form of small arrows operates within trend waves.
Quantum Breakout Indicator PRO
Bogdan Ion Puscasu
4.96 (26)
Introducing   Quantum Breakout PRO , the groundbreaking MQL5 Indicator that's transforming the way you trade Breakout Zones! Developed by a team of experienced traders with trading experience of over 13 years, Quantum Breakout PRO is designed to propel your trading journey to new heights with its innovative and dynamic breakout zone strategy. Quantum Breakout Indicator will give you signal arrows on breakout zones with 5 profit target zones and stop loss suggestion based on the breakout box. I
Currency Strength Exotics
Bernhard Schweigert
4.88 (33)
CURRENTLY 20% OFF ! Best Solution for any Newbie or Expert Trader! This Indicator is specialized to show currency strength for any symbols like Exotic Pairs Commodities, Indexes or Futures. Is first of its kind, any symbol can be added to the 9th line to show true currency strength of Gold, Silver, Oil, DAX, US30, MXN, TRY, CNH etc. This is a unique, high quality and affordable trading tool because we have incorporated a number of proprietary features and a new formula. Imagine how your trading
Reversal Master
Alexey Minkov
4.8 (15)
The Reversal Master is an indicator for determining the current direction of price movement and reversal points. The indicator will be useful for those who want to see the current market situation better. The indicator can be used as an add-on for ready-made trading systems, or as an independent tool, or to develop your own trading systems. The Reversal Master indicator, to determine the reversal points,  analyzes a lot of conditions since the combined analysis gives a more accurate picture of t
Scalper Vault
Oleg Rodin
5 (36)
Scalper Vault is a professional scalping system which provides you with everything you need for successful scalping. This indicator is a complete trading system which can be used by forex and binary options traders. The recommended time frame is M5. The system provides you with accurate arrow signals in the direction of the trend. It also provides you with top and bottom signals and Gann market levels. The indicator provides all types of alerts including PUSH notifications. PLEASE CONTACT ME AFT
Route Lines Prices is an indicator designed for finding price directions. Its simple interface contains multiple algorithms for price behavior and future direction calculations. These algorithms include volatility calculations and price smoothing based on the timeframes used. The indicator has a single parameter for changing the " Calculating Price Values " value. The default value of 1 provides a balanced automatic calculation, which can be used without manually configuring the indicator. By m
CRT Multi-Timeframe Market Structure & Liquidity Sweep Indicator Non-Repainting | Multi-Asset | MT5 Version Available MT5 Version:   https://www.mql5.com/en/market/product/162075 Full User Guide — explains what each feature does and why:   https://www.mql5.com/en/blogs/post/767525 Quick Start User Guide  — explains how to configure and in what order:  https://www.mql5.com/en/blogs/post/767540 Indicator Overview CRT Ghost Candle HTF Fractal is a complete institutional-grade market structure too
Trading Special – 40% OFF Best Solution for any Newbie or Expert Trader! This dashboard software is working on 28 currency pairs plus one. It is based on 2 of our main indicators (Advanced Currency Strength 28 and Advanced Currency Impulse). It gives a great overview of the entire Forex market plus Gold or 1 indices. It shows Advanced Currency Strength values, currency speed of movement and signals for 28 Forex pairs in all (9) timeframes. Imagine how your trading will improve when you can watch
Currency Strength Wizard is a very powerful indicator that provides you with all-in-one solution for successful trading. The indicator calculates the power of this or that forex pair using the data of all currencies on multiple time frames. This data is represented in a form of easy to use currency index and currency power lines which you can use to see the power of this or that currency. All you need is attach the indicator to the chart you want to trade and the indicator will show you real str
Auto Optimized Parabolic RSI: Advanced 3D Momentum Engine Most retail indicators fail because they rely on static inputs that break the moment market volatility shifts. Auto Optimized Parabolic RSI solves the problem of "indicator decay" by continuously recalculating its own mathematical edge, bringing institutional-grade quantitative adaptation directly to your MT5 terminal. The Core Advantage: Custom In-Memory 3D Optimization   Standard auto-optimizers often freeze the MT5 platform because the
Advanced Supply Demand
Bernhard Schweigert
4.91 (299)
Trading Special – 40% OFF Best Solution for any Newbie or Expert Trader! This indicator is a unique, high quality and affordable trading tool because we have incorporated a number of proprietary features and a new formula. With this update, you will be able to show double timeframe zones. You will not only be able to show a higher TF but to show both, the chart TF, PLUS the higher TF: SHOWING NESTED ZONES. All Supply Demand traders will love it. :) Important Information Revealed Maximize the pot
Super Signal Market Slayer No Repaint | High Accuracy | Multi-Market Intelligent Trend Indicator In trading, the real challenge is not placing an order, but clearly seeing when a trend has truly begun amid market noise. Market Slayer was created for this purpose. It is a no-repaint intelligent indicator designed specifically for intraday trading. Through multi-layer confirmation and trend-filtering logic, it delivers clear and reliable Buy / Sell signals only at key moments. Key Advantages No r
Super Reversal Indicator with Alert Overview Super Reversal Indicator with Alert is a multi timeframe trading tool designed to identify high probability market reversal opportunities using a combination of stochastic momentum, supply and demand zones, and price rejection signals. The indicator helps traders detect potential turning points in the market with clear visual signals and real time alerts. Key Features Multi Timeframe Stochastic Analysis Uses stochastic oscillator from a higher timefra
Stratos Pali
Michela Russo
4.43 (7)
Stratos Pali Indicator   is a revolutionary tool designed to enhance your trading strategy by accurately identifying market trends. This sophisticated indicator uses a unique algorithm to generate a complete histogram, which records when the trend is Long or Short. When a trend reversal occurs, an arrow appears, indicating the new direction of the trend. Important Information Revealed Leave a review and contact me via mql5 message to receive My Top 5 set files for Stratos Pali at no cost! Dow
GOLD Impulse with Alert
Bernhard Schweigert
4.67 (12)
This indicator is a super combination of our 2 products  Advanced Currency IMPULSE with ALERT  and  Currency Strength Exotics . It works for all time frames and shows graphically impulse of strength or weakness for the 8 main currencies plus one Symbol! This Indicator is specialized to show currency strength acceleration for any symbols like Gold, Exotic Pairs, Commodities, Indexes or Futures. Is first of its kind, any symbol can be added to the 9th line to show  true currency strength accelerat
Dynamic Forex28 Navigator
Bernhard Schweigert
4.43 (7)
Specials Discount now. The Next Generation Forex Trading Tool. Dynamic Forex28 Navigator is the evolution of our long-time, popular indicators, combining the power of three into one: Advanced Currency Strength28 Indicator (695 reviews) + Advanced Currency IMPULSE with ALERT (520 reviews) + CS28 Combo Signals (recent Bonus) Details about the indicator  https://www.mql5.com/en/blogs/post/758844 What Does The Next-Generation Strength Indicator Offer? Everything you loved about the originals, now
- Real price is 80$ - 40% Discount (It is 49$ now) Contact me for instruction, add group and any questions! - Non-repaint - I just sell my products in Elif Kaya profile, any other websites are stolen old versions, So no any new updates or support. - Lifetime update free Related product:   Bitcoin Expert Introduction The breakout and retest strategy is traded support and resistance levels. it involves price breaking through a previous level.  The break and retest strategy is designed to help tr
FX Power MT4 NG
Daniel Stein
4.95 (21)
FX Power: Analyze Currency Strength for Smarter Trading Decisions Overview FX Power is your go-to tool for understanding the real strength of currencies and Gold in any market condition. By identifying strong currencies to buy and weak ones to sell, FX Power simplifies trading decisions and uncovers high-probability opportunities. Whether you’re looking to follow trends or anticipate reversals using extreme delta values, this tool adapts seamlessly to your trading style. Don’t just trade—trade
Free Test Drive Available (EURUSD & AUDUSD) Access via the official BlueDigitsFx Discord Server Test the indicator before upgrading to the full version BlueDigitsFx Easy 123 System — Powerful Reversal and Breakout Detection for MT4 All-In-One Non-Repaint System for Spotting Market Reversals and Breakouts – Built for Newbie and Expert Traders The BlueDigitsFx Easy 123 System is a visual and alert-based MT4 indicator that helps you detect market structure shifts, breakouts, and trend reversals w
Apollo Secret Trend is a professional trend indicator which can be used to find trends on any pair and time frame. The indicator can easily become your primary trading indicator which you can use to detect market trends no matter what pair or time frame you prefer to trade. By using a special parameter in the indicator you can adapt the signals to your personal trading style. The indicator provides all types of alerts including PUSH notifications. The signals of the indicator DO NOT REPAINT! In
Volatility Trend System - a trading system that gives signals for entries. The volatility system gives linear and point signals in the direction of the trend, as well as signals to exit it, without redrawing and delays. The trend indicator monitors the direction of the medium-term trend, shows the direction and its change. The signal indicator is based on changes in volatility and shows market entries. The indicator is equipped with several types of alerts. Can be applied to various trading ins
Auto Optimized MFI
Davit Beridze
5 (1)
Auto Optimized MFI is a dynamic, self-tuning indicator that adapts to your market and timeframe by running real trade simulations on historical data. Unlike traditional indicators that rely on fixed 80/20 MFI thresholds, this tool adjusts to actual price and volume behavior to identify more effective Buy and Sell zones. How it works The indicator analyzes historical candles across a customizable range and simulates trades based on MFI signals. It records metrics like win rate, drawdown, and TP/S
LIMITED TIME SALE - 30% OFF! WAS $50 - NOW JUST $35! Profit from market structure changes as price reverses and pulls back. The market structure reversal alert indicator identifies when a trend or price move is approaching exhaustion and ready to reverse. It alerts you to changes in market structure which typically occur when a reversal or major pullback are about to happen. The indicator identifies breakouts and price momentum initially, every time a new high or low is formed near a po
More from author
ACB Breakout Arrows MT5
KEENBASE SOFTWARE SOLUTIONS
3.5 (2)
The ACB Breakout Arrows indicator provides a crucial entry signal in the market by detecting a special breakout pattern. The indicator constantly scans the chart for a settling momentum in one direction and provide the accurate entry signal right before the major move. Get multi-symbol and multi-timeframe scanner from here - Scanner for ACB Breakout Arrows MT 5 Key features Stoploss   and Take Profit levels are provided by the indicator. Comes with a MTF Scanner dashboard which tracks the brea
KT Heiken Ashi Smoothed MT4
KEENBASE SOFTWARE SOLUTIONS
KT Heiken Ashi Smoothed is a smoothed version of the standard Heiken Ashi. Moreover, it also plots buy/sell arrows on a trend change. A buy arrow is plotted when it change to a bullish state from bearish state. A sell arrow is plotted when it change to a bearish state from bullish state. Mobile notifications, Email, Sound and Pop-up alerts included. What exactly is Heiken Ashi Smoothed? It filters out the false signals and noise in the standard Heiken Ashi. It applies the set of two moving ave
Use of support and resistance in systematic trading is very subjective. Every trader has their own idea and way to plotting the support and resistance levels on the chart. KT Support and Resistance indicator take out this ambiguity out of the situation and automatically draws support and resistance levels following an algorithmic approach using a unique multi-timeframe analysis. When launched on the chart, It immediately scan the most significant extreme points across all the available timefra
ACB Trade Filter MT5
KEENBASE SOFTWARE SOLUTIONS
ACB Trade Filter indicator provides a way to filtering out the low probability trading entries in a trading strategy. The indicator uses a sophisticated filtration algorithm based on the market sentiment and trend. The MT4 version of the same indicator is available here ACB Trade Filter MT4 Applications Works great with our indicator ACB Breakout Arrows MT5 Filter out low probability signals from any indicator. Avoid over-trading and minimize the losses. Trade in the direction of market sentime
KT Round Numbers MT5
KEENBASE SOFTWARE SOLUTIONS
KT Round Numbers plots the round number levels which are also commonly known as psychological levels in the Forex world. In the context of Forex trading, round number levels are those levels in which there are two or more zeroes at the end. They are named as 00 levels on the chart. Some traders also consider the halfway points as a valid round number level. They are named as 50 levels on the chart. Use of round number levels in trading Round number levels work as strong support and resistance
KT Momentum Arrows MT5
KEENBASE SOFTWARE SOLUTIONS
5 (2)
KT Momentum Arrows Indicator is based on a momentary breakout which is calculated using the bands deviation and emerging volatility in a certain direction. A buy signal is generated when the price closes above the upper band and a sell signal is generated when the price closes below the lower band. A magnitude coefficient is used as the input which affects the band deviation and volatility at the same time. The coefficient value should be carefully selected and analyzed based on the instrument a
KT Asian Breakout
KEENBASE SOFTWARE SOLUTIONS
4 (1)
KT Asian Breakout carefully analyzes the range-bound market during the Asian session and then fires a long or short trade after doing some preassessment based on its inbuilt technical analysis module. The executed orders are closed within a day before the completion of the next day session. The inbuilt technical analysis module checks for the session range and compares it with the last 20 days price movement. If it finds any erratic price movement within the session, the orders are not executed
KT RSI Divergence Robot MT4
KEENBASE SOFTWARE SOLUTIONS
KT RSI Divergence robot is a 100% automated expert advisor that trades regular and hidden divergence built between the price and Relative Strength Index (RSI) oscillator. The divergence signals are fetched from our freely available RSI divergence indicator. Not every divergence ends up in a successful price reversal, that's why this ea combines the raw divergences signals with its inbuilt technical analysis module to exploit the price inefficiency that occurs after some selected divergence sig
KT CCI Divergence MT5
KEENBASE SOFTWARE SOLUTIONS
KT CCI Divergence shows the regular and hidden divergence created between the price and CCI oscillator. Divergence is one of the vital signals that depicts the upcoming price reversal in the market. Manually spotting the divergence between price and CCI can be a hectic and ambiguous task. Limitations of KT CCI Divergence   Using the CCI divergence as a standalone entry signal can be risky. Every divergence can't be interpreted as a strong reversal signal. For better results, try to combine it w
ACB Breakout Arrows
KEENBASE SOFTWARE SOLUTIONS
4.15 (34)
The ACB Breakout Arrows indicator provides a crucial entry signal in the market by detecting a special breakout pattern. The indicator constantly scans the chart for a settling momentum in one direction and provide the accurate entry signal right before the major move.  Get multi-symbol and multi-timeframe scanner from here - Scanner for ACB Breakout Arrows MT4 Key features Stoploss and Take Profit levels are provided by the indicator. Comes with a MTF Scanner dashboard which tracks the breako
ACB Trade Filter MT4
KEENBASE SOFTWARE SOLUTIONS
5 (1)
The ACB Trade Filter indicator provides a solution for filtering out the low probability trading setups in a trading strategy. The indicator uses a sophisticated filtration algorithm based on the market sentiment and trend. Applications Works great with our indicator " ACB Breakout Arrows ". Filter out low probability signals from any indicator. Avoid overtrading and minimize the losses. Trade in the direction of market sentiment and trend. Avoid the choppiness in the market. How to use Only L
KT Momentum Arrows
KEENBASE SOFTWARE SOLUTIONS
KT Momentum Arrows Indicator is based on a momentary breakout which is calculated using the bands deviation and emerging volatility in a certain direction. A buy signal is generated when the price close above the upper band and a sell signal is generated when the price close below the lower band. A magnitude coefficient is used as the input which affects the band deviation and volatility at the same time. The coefficient value should be carefully selected and analyzed based on the instrument and
KT COG Advanced MT4
KEENBASE SOFTWARE SOLUTIONS
1 (1)
KT COG is an advanced implementation of the center of gravity indicator presented by John F. Ehlers in the May 2002 edition of Technical Analysis of Stocks & Commodities magazine. It's a leading indicator which can be used to identify the potential reversal points with the minimum lag. The COG oscillator catches the price swings quite effectively. MT5 version of the same indicator is available here KT COG Advanced MT5 Calculation of COG The COG indicator is consist of the two lines. The main l
KT Pin Bar
KEENBASE SOFTWARE SOLUTIONS
KT Pin Bar identifies the pin bar formation which is a type of price action pattern which depicts a sign of reversal or rejection of the trend. When combined with support and resistance, BRN and other significant levels, Pin Bar pattern proved to be a very strong sign of reversal. Basically, a pin bar is characterized by a small body relative to the bar length which is closed either in upper or lower 50% part of its length. They have very large wicks and small candle body. A pin bar candlestic
KT Trend Magic
KEENBASE SOFTWARE SOLUTIONS
KT Trend Magic shows the trend depiction on chart using the combination of market momentum and volatility. A smoothing coefficient is used to smooth out the noise from the signal.It can be used to find out the new entries or confirm the trades produced by other EA/Indicators. Usage Drag n drop MTF scanner which scans for the new signals across multiple time-frames. Find new entries in the trend direction. Improve the accuracy of other indicators when used in conjunction. Can be used as a dynami
KT Auto Fibo
KEENBASE SOFTWARE SOLUTIONS
KT Auto Fibo draws Fibonacci retracement levels based on the ongoing trend direction. The Highs and Lows are automatically selected using the Maximum and Minimum points available on the chart. You can zoom in/out and scroll to adjust the Fibonacci levels accordingly. Modes Auto:  It draws the Fibonacci levels automatically based on the chart area. Manual: It draws the Fibonacci levels only one time. After that, you can change the anchor points manually. Usage: Helps to predict the future profi
KT Ichimoku Trader
KEENBASE SOFTWARE SOLUTIONS
1 (1)
KT Ichimoku Trader is a fully automated expert advisor that offers five popular trading strategies based on the Ichimoku indicator. Each strategy has it's own entry and exit method without any interference to other strategies. The Ichimoku system can be applied to all major currency pairs and metals. However, we found that it performs reasonably well mainly on two pairs.   MT5 Version is available here  https://www.mql5.com/en/market/product/35043 Features Trade up to 5 famous trading strategi
KT Volatility Oscillator
KEENBASE SOFTWARE SOLUTIONS
KT Volatility oscillator analyze the past and current market data with a mathematical formula to display the result in a form of an oscillator. The growing and deteriorating waves are equivalent to high and low volatility in the asset.  In a nutshell, volatility is simply a measurement of the price fluctuation of an asset over a certain period of time. Without volatility, there would not much movement in the market and traders would not be able to profit from the price movements. Use of Volatil
KT COG Robot
KEENBASE SOFTWARE SOLUTIONS
KT COG Robot is a fully automated Expert Advisor based on the KT COG Indicator . The COG indicator was originally presented by John F. Ehlers in the May 2002 edition of Technical Analysis of Stocks & Commodities magazine. The EA fires a long trade when COG line cross above the signal line and a short trade is fired when the COG line cross below the signal line.  Adaptive Filtration Our adaptive filtration algorithm combines the original COG formula with the major trend direction and market acce
ACB Breakout Arrows EA
KEENBASE SOFTWARE SOLUTIONS
This is a 100% automated expert advisor based on our custom indicator named "ACB Breakout Arrows" . The entries are based on a breakout pattern that constantly occurs in a bi-directional manner. The intensity of entry signals can be manipulated using the external input called "Signal Sensitivity". Trades Confirmation ACB Breakout Arrows EA provides an ability to filter the entries using our another custom indicator named ACB Trade Filter . Strong Buy: Up Arrow + Green Histogram + Bullish Trend
KT London Breakout
KEENBASE SOFTWARE SOLUTIONS
First thirty minutes are essential for a trading session. The early reaction of traders and market players sets a path for the rest of the day. KT London Breakout EA takes advantage of this phenomenon, and after analyzing the first thirty minutes of London session, it places two bidirectional pending orders. One of pending order is eventually canceled after realizing the market direction with certainty. It has been strictly tested and developed for EUR/JPY using 30-Min Time Frame. You can expe
Use of support and resistance in systematic trading is very subjective. Every trader has their own idea and way to plotting the support and resistance levels on the chart. KT Support and Resistance indicator take out this ambiguity out of the situation and automatically draws support and resistance levels following an algorithmic approach using a unique multi-timeframe analysis. When launched on the chart, It immediately scan the most significant extreme points across all the available timefra
If you trade Forex, having detailed information about the currency strength and currency pairs correlation can take your trading to new heights. The correlation will help to cut your risk in half, and strength analysis will help to maximize the profits. This indicator provides a hybrid approach for selecting the most appropriate currency pairs using the strength analysis and currency pairs correlation. How to use the Currency Strength Analysis Suppose your trading strategy provides a buying opp
MACD Divergence Seeker
KEENBASE SOFTWARE SOLUTIONS
KT MACD Divergence Seeker trades the regular and hidden divergence signals generated by our free indicator named KT MACD Divergence indicator. Trading the standalone divergences can be a risky affair that's why the KT MACD Divergence Seeker combines the standard divergence signals with an advanced analysis module to exploit the price inefficiencies on some FX pairs. What is the Divergence exactly? As a general conception if the price is making higher highs, then macd should also be making hig
KT Asian Breakout Indicator
KEENBASE SOFTWARE SOLUTIONS
KT Asian Breakout indicator scans and analyzes a critical part of the Asian session to generate bi-directional buy and sell signals with the direction of a price breakout. A buy signal occurs when the price breaks above the session high, and a sell signal occurs when the price breaks below the session low. Things to remember If the session box is vertically too wide, a new trade should be avoided as most of the price action has already completed within the session box. If the breakout candle is
MACD Divergence MT4
KEENBASE SOFTWARE SOLUTIONS
KT MACD Divergence shows the regular and hidden divergences build between the price and oscillator. If your trading strategy anticipates the trend reversal, you can include the MACD regular divergence to speculate the potential turning points. And if your trading strategy based on the trend continuation, MACD hidden divergence would be a good fit. Limitations of KT MACD Divergence Using the macd divergence as a standalone entry signal can be a risky affair. Every divergence can't be interprete
KT Bollinger Bands Trader MT4
KEENBASE SOFTWARE SOLUTIONS
KT Bollinger Bands Trader is a 100% automated expert advisor that's incorporated a mean reversion trading strategy using the Bollinger bands during the period of low volatility. Price often reacts at the upper or lower line of Bollinger bands, but a reversal not always occurs. However, there is more chance of price reversal during the time of low volatility. Entries A buy trade is activated when price correctly aligns below the bottom line of Bollinger bands. A sell trade is activated when pric
KT CCI Divergence MT4
KEENBASE SOFTWARE SOLUTIONS
KT CCI Divergence shows the regular and hidden divergence created between the price and CCI oscillator. Divergence is one of the vital signals that depicts the upcoming price reversal in the market. Manually spotting the divergence between price and CCI can be a hectic and ambiguous task. Limitations of KT CCI Divergence   Using the CCI divergence as a standalone entry signal can be risky. Every divergence can't be interpreted as a strong reversal signal. For better results, try to combine it w
KT MA Crossover MT4
KEENBASE SOFTWARE SOLUTIONS
KT MA Crossover draws the buy and sell arrows based on the crossover of chosen moving averages. Moreover, it also generates the appropriate alerts and displays the MFE (Most Favorable Excursion) for each successive signal. The moving average crossover is one of the primary strategies followed by traders around the world. Usually, it consists of a fast and slow moving average to find a buy and sell entry signal according to the crossover direction. Buy signal - when fast MA crosses above the slo
KT Round Numbers MT4
KEENBASE SOFTWARE SOLUTIONS
KT Round Numbers plots the round number levels which are also commonly known as psychological levels in the Forex world. In the context of Forex trading, round number levels are those levels in which there are two or more zeroes at the end. They are named as 00 levels on the chart. Some traders also consider the halfway points as a valid round number level. They are named as 50 levels on the chart. Use of round number levels in trading Round number levels work as strong support and resistance
Filter:
No reviews
Reply to review