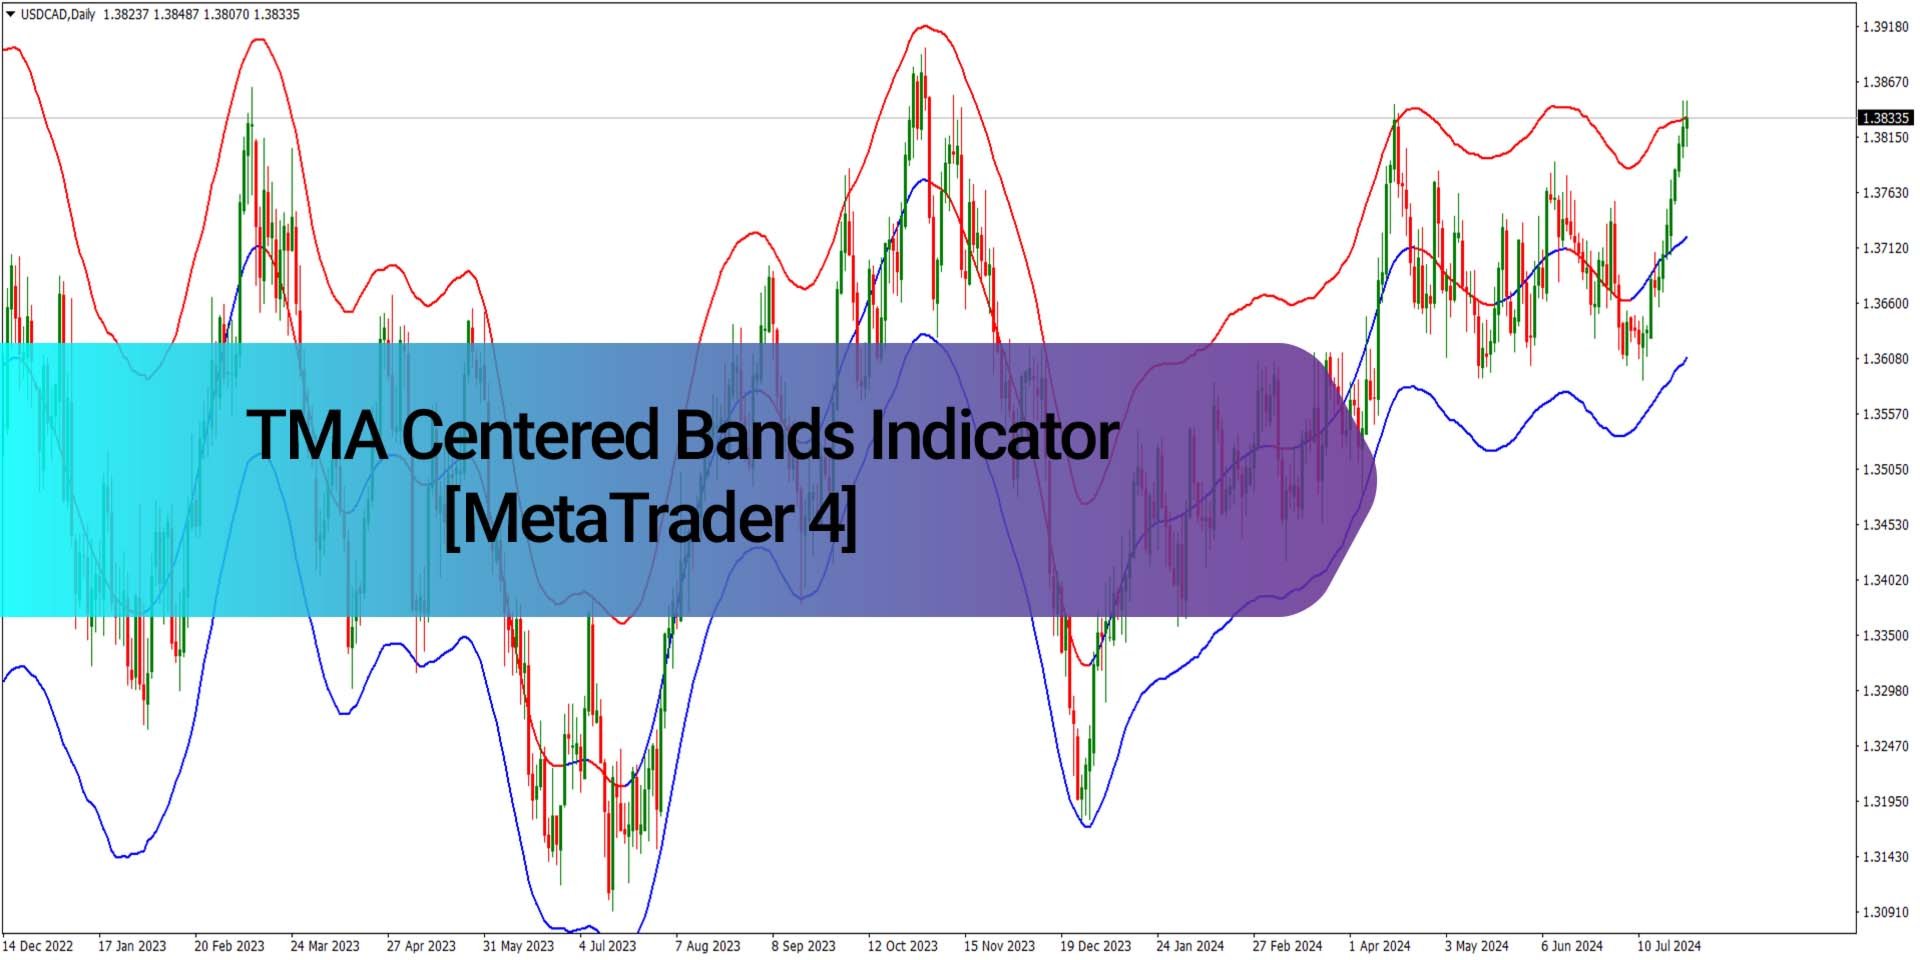
TMA Centered Bands Indicator MT4
- Indicators
- Eda Kaya
- Version: 2.1
TMA-Centered Bands Indicator MetaTrader 4
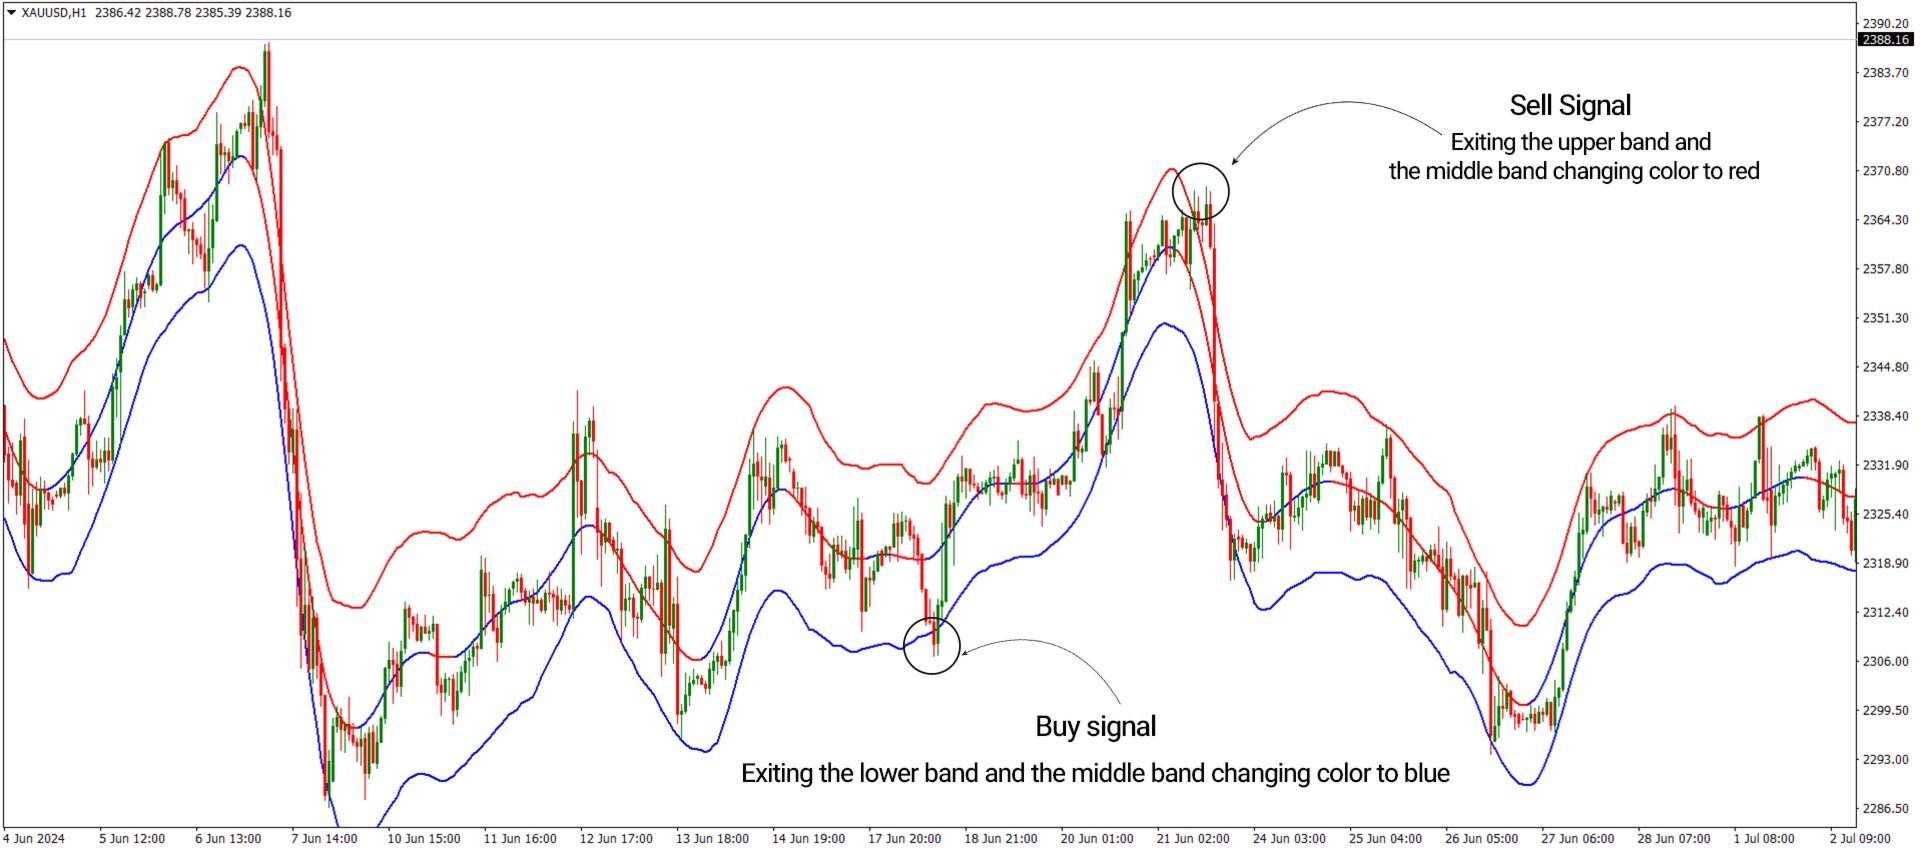
The TMA Centered Bands Indicator for MetaTrader 4 leverages Moving Averages to identify the overall trend direction, which is visually represented by the bands on the chart. This indicator is composed of three bands: the upper band in red, the middle band in a red-blue gradient, and the lower band in blue.
In an uptrend, the middle band changes to blue, and in a downtrend, it switches to red. When the price moves beyond the upper or lower bands, it tends to return inside them, signaling potential entry points. A price move outside the upper band indicates a sell signal, while a move outside the lower band suggests a buy signal.
«Indicator Installation & User Guide»
MT4 Indicator Installation | TMA Centered Bands Indicator MT5 | ALL Products By TradingFinderLab | Best MT4 Indicator: Refined Order Block Indicator for MT4 | Best MT4 Utility: Trade Assistant Expert TF MT4 | TP & SL Tool: Risk Reward Ratio Calculator RRR MT4 | Prop Firm Protector: Trade Assist Prop Firm Plus TF Expert MT4 | Money Management + DrawDown Protector: Trade Panel Prop Firm Drawdawn Limiter Pro MT4
Indicator Table
| Indicator Category | Signal and Forecast - Bands & Channels |
| Platforms | MetaTrader 4 |
| Trading Skills | Beginner |
| Indicator Types | Reversal - Breakout |
| Timeframe | Multi Timeframe |
| Trading Style | Scalper - Day Trader – Intraday – Swing Trader |
| Trading Instruments | All Markets |
Overview
Accurate trend identification is crucial in trading. The TMA Indicator, by employing Moving Averages, offers insight into the potential direction of market trends while generating trade entry signals that align with those trends. It refines entry points through price averaging and volatility analysis using the ATR (Average True Range) indicator.
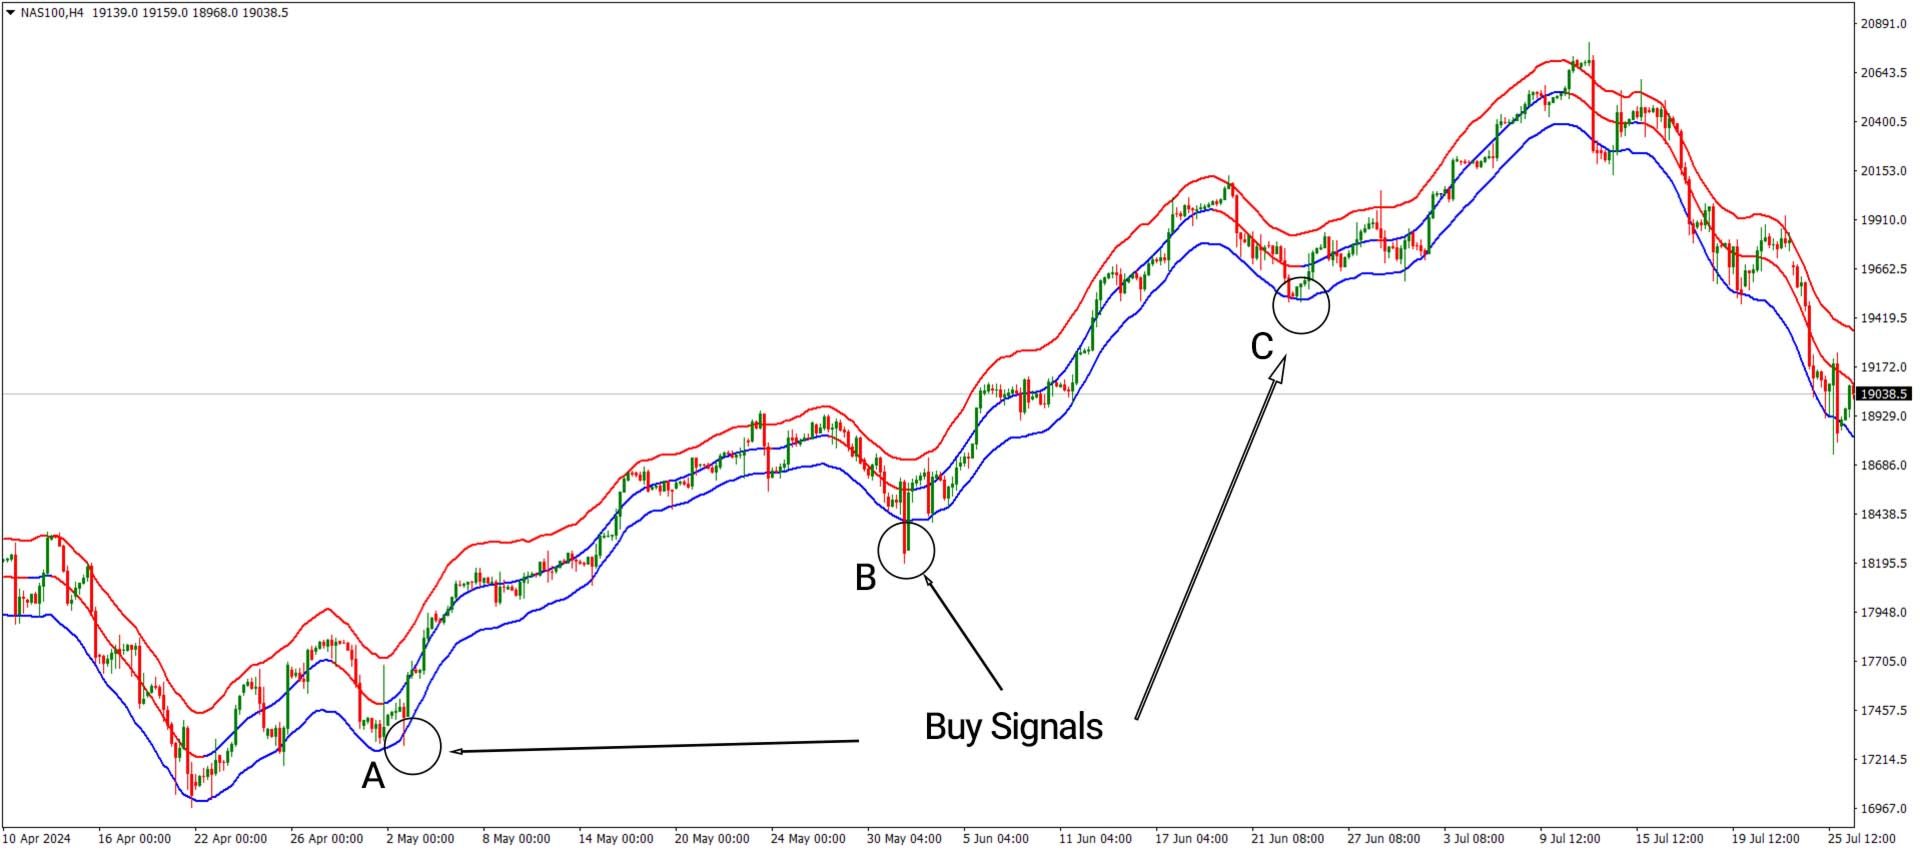
Uptrend Signals (Buy Positions)
The chart below shows the NASDAQ index (NAS100) on a 4-hour timeframe. At points A, B, and C, the price breaks below the lower band and re-enters, turning the middle band blue. This signals an uptrend and a buy opportunity. Entry confirmation can be supported by indicators like the RSI.
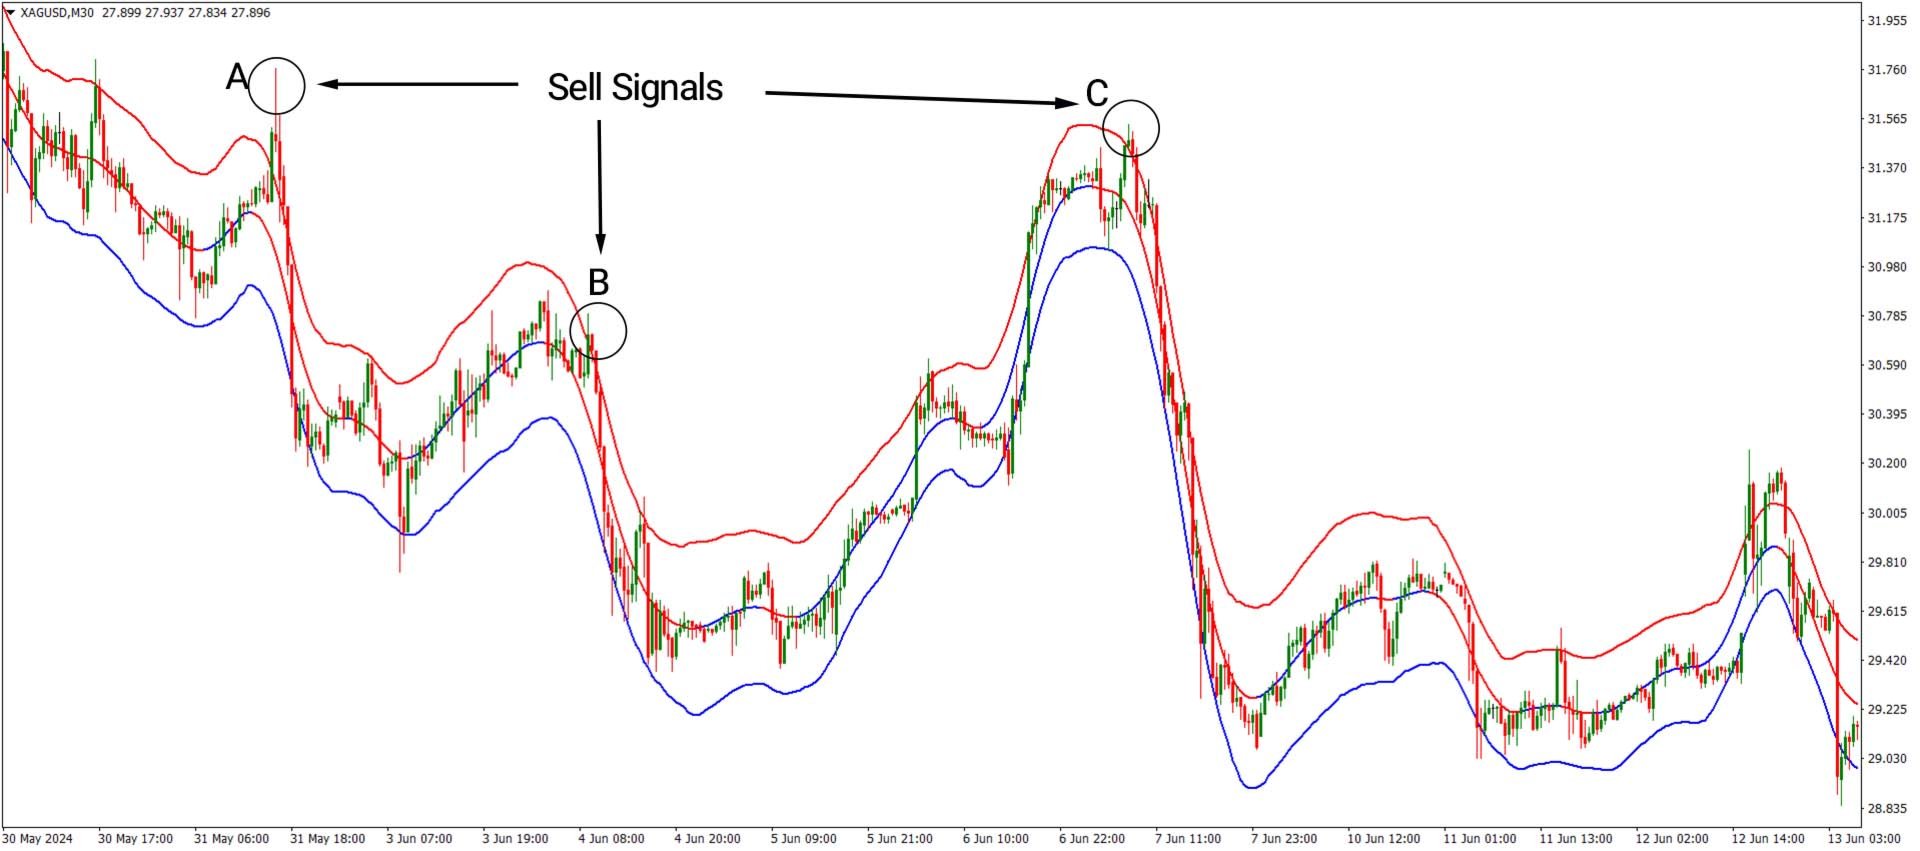
Downtrend Signals (Sell Positions)
In the following chart of Silver against the US dollar (XAGUSD) on a 30-minute timeframe, the price exits the upper band at points A, B, and C, then re-enters, turning the middle band red. This behavior signals a downtrend and a potential sell opportunity. Trade entries may be further validated with the Stochastic indicator.
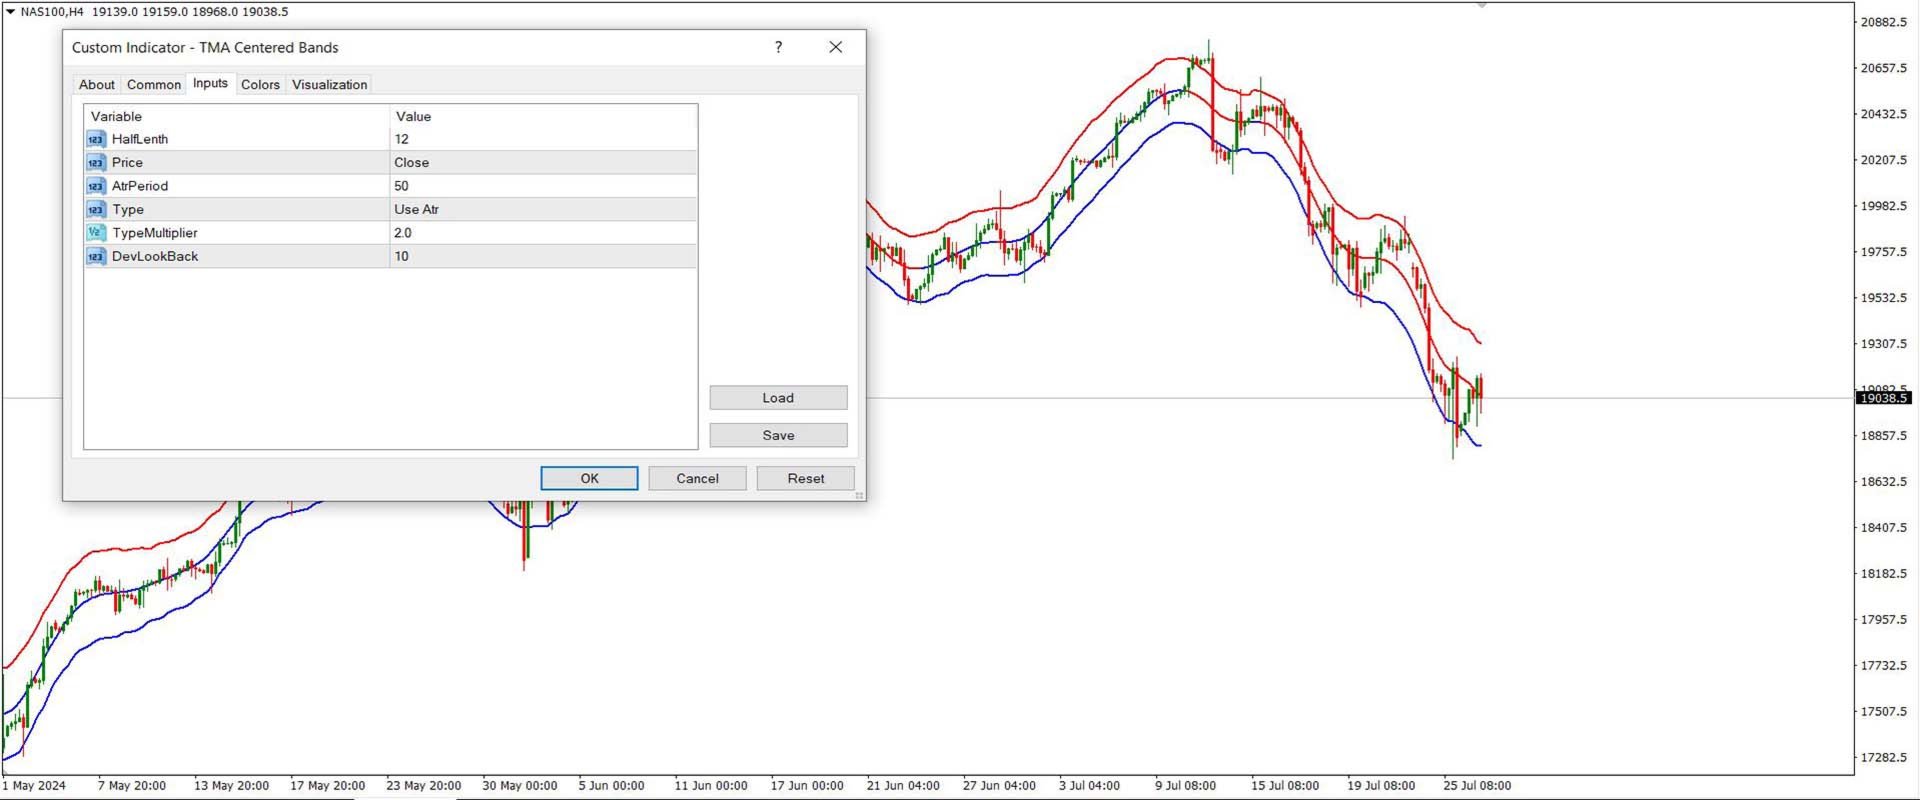
TMA Indicator Settings
- HalfLength: Set to 12 candles, determining the responsiveness to recent price changes.
- Price: Uses the candle closing price (‘Close’) for moving average calculations.
- AtrPeriod: Set to 50, providing a smoother ATR value that reflects broader volatility.
- Type: Utilizes ATR in calculating the moving average, making the indicator responsive to market volatility.
- TypeMultiplier: Set to 2, controlling the width between the middle and outer bands based on ATR.
- DevLookBack: Default is 10, specifying how many candles to consider in deviation calculations, which influences the bands' reactivity to volatility changes.
Conclusion
The TMA Centered Bands Indicator is a flexible tool suitable for all timeframes and trading strategies. It offers valuable insights into trend direction and can be more effective when combined with other indicators such as the RSI or Moving Averages. This combination helps reinforce trading signals and enhances the quality of analysis for better decision-making.