Modified TTM Squeeze Indicator

"The Squeeze indicator attempts to identify periods of consolidation in a market. In general the market is either in a period of quiet consolidation or vertical price discovery. By identifying these calm periods, we have a better opportunity of getting into trades with the potential for larger moves. Once a market enters into a "squeeze," we watch the overall market momentum to help forecast the market direction and await a release of market energy."

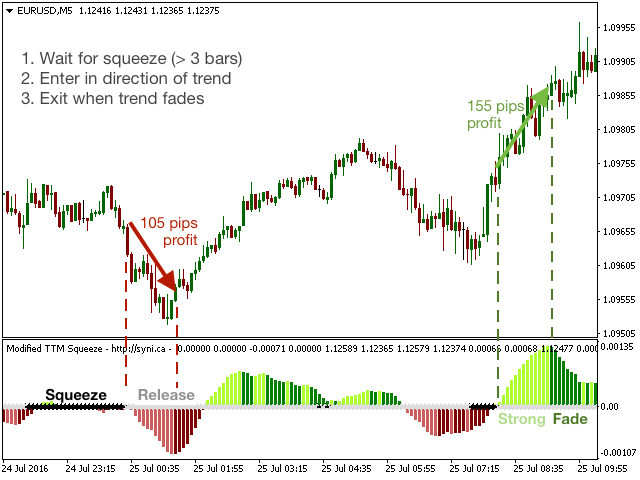
Modified TTM Squeeze Indicator is a modification of Carter's TTM Squeeze, giving faster entry points than the original. This identifies both entry and exit points for major price movements. Green and red histograms show up/down price movements. Darker histogram colors indicate the trend is fading. Black crosses on the midline signify price squeezes, while grey crosses signify a release from squeeze. 

Do you miss the original TTM Squeeze? This Modified TTM Squeeze Indicator allows you to switch between modified and traditional squeeze indicators.


Trading Strategies

There are many trading strategies described for the TTM Squeeze indicator. 2 simple effective strategies are:

1. "Release from squeeze":

  1. Wait for a squeeze period that lasts at least 3 bars
  2. On the first grey bar (release from squeeze), trade in the direction of the trend. (i.e., if the Modified TTM value is above zero, place a call; if it's below zero, place a put)
  3. Exit trade when price either enters the next squeeze (risky), or, when the trend fades, indicated by darker green/red histogram bars (conservative)

An excellent setup is when two or more major timeframes are in a squeeze. Enter the trade when the shorter timeframe is released from the squeeze. For example, both 5min and 15min periods are in a squeeze period. Enter trade when 5min period is released from squeeze. While squeeze patterns in higher timeframes generally indicates a larger move, anecdotally in forex, TTM squeeze works best on the 4 hour period and shorter.

The Modified TTM Squeeze also pairs well with ADX indicators.

2. "Follow the trend in non-squeeze periods":

When the indicator indicates a non-squeeze period, this tends to be more trendy and less choppy, and trading with the trend can be effective

  1. Enter when not in a squeeze period but the trend is fading (e.g., go long when indicator moves from red to dark red; short when moving green to dark green)
  2. Exit when the trend fades in the other direction (e.g., exit a long position when moving from green to dark green), or squeeze occurs

Short Timeframes / Scalping / Reducing Lag:

Trading strategies with this indicator are different for short timeframes (< 5min) and scalping:

1. Regular parameters, quick exits:

  • Enter when a trend is weakening (e.g., red to dark red -> enter long) or after releasing a squeeze
  • Exit after 3 bars (or if the trend weakens/goes into another squeeze), but don't wait for the trend to weaken

OR

2. Increase speed parameter:

  • Change the speed parameter from Regular to Fast or SuperFast

If scalping / trading on short timeframes, please spend extra time reviewing the free Demo to make sure the parameters work for you before purchasing!


Parameters

  • Speed Type (Regular/Fast/SuperFast): Changes the calculation methods to allow for faster entries/exits
  • Use modified TTM (Default=true): If false, changes indicator to the traditional TTM squeeze. If true, the indicator uses the modified TTM squeeze, with improved momentum calculation
  • Turn on alerts (T/F): If false, prevents any alerts
  • Alert when squeeze begins (T/F): If true, sends alert on squeeze onset
  • Alert when squeeze is released (T/F): If true, sends alert when squeeze is released
  • Alert when trend fades (T/F): If true, sends alert when up or downtrend fades (as indicated by a darker green/red line on histogram)
  • Allow alert message (T/F): If true, alerts will create a message box
  • Allow alerts sound (T/F): If true, alerts will play a sound
  • Allow alerts email (T/F): If true, alerts will send an email
  • BB length (Default=20): Number of bars used to calculate Bollinger Bands, used for squeeze
  • BB multiplier (Default=2.0): Number of standard deviations used for Bollinger Bands
  • KC length (Default=20): Number of bars used to calculate Keltner Channel, used for squeeze
  • KC multiplier (Default=1.5): Multiplier used for Keltner Channel


Recommended products
Alpha Trend sign has been a very popular trading tool in our company for a long time. It can verify our trading system and clearly indicate trading signals, and the signals will not drift. Main functions: Based on the market display of active areas, indicators can be used to intuitively determine whether the current market trend belongs to a trend market or a volatile market. And enter the market according to the indicator arrows, with green arrows indicating buy and red arrows indicating se
VR Cub
Vladimir Pastushak
VR Cub is an indicator for getting high-quality entry points. The indicator was developed to facilitate mathematical calculations and simplify the search for entry points into a position. The trading strategy for which the indicator was written has been proving its effectiveness for many years. The simplicity of the trading strategy is its great advantage, which allows even novice traders to successfully trade with it. VR Cub calculates position opening points and Take Profit and Stop Loss targe
EZZ Zig Zag MT4
Paulo Rocha
5 (1)
EZZ Elite Zig Zag is an indicator for the MetaTrader 4 terminal. This indicator traces the peak of the trend based on the market reversal, thus showing various opportunities in the financial market. EZZ Elite Zig Zag is a visual tool, intuitive, and easy to understand and use.  Test it Yourself by Downloading it for Free. Author Paulo Rocha all rights reserved
SystemBinaryM1
Andrey Spiridonov
SystemBinaryM1 - a professional indicator for trading short-term binary options, is a complete, self-contained author's strategy for working in the binary options market. The unique algorithm for analyzing the foreign exchange market is based on the calculation of reference points on three different time periods M15, M5. M1. Thus, the indicator simultaneously analyzes the long-term, medium-term and short-term price behavior before issuing a signal. The indicator is set in the usual way and work
Infinity Trend Pro
Yaroslav Varankin
1 (1)
This is a trend indicator without redrawing Developed instead of the binary options strategy (by the color of the Martingale candlestick) Also works well in forex trading When to open trades (binary options) A signal will appear in the place with a candle signaling the current candle It is recommended to open a deal for one candle of the current timeframe M1 and M5 When a blue dot appears, open a deal up When a red dot appears, open a trade down. How to open trades on Forex. When a signal is rec
Binary Options Support Resistance Indicator This indicator is designed for binary options trading and effectively shows retracements from support and resistance levels. Signals appear on the current candle. A red arrow pointing downwards indicates a potential selling opportunity, while a blue arrow pointing upwards suggests buying opportunities. All that needs adjustment is the color of the signal arrows. It is recommended to use it on the M1-M5 timeframes as signals are frequent on these timef
The Th3Eng PipFinite indicator is based on a very excellent analysis of the right trend direction with perfect custom algorithms. It show the true direction and the best point to start trading. With StopLoss point and Three Take Profit points. Also it show the right pivot of the price and small points to order to replace the dynamic support and resistance channel, Which surrounds the price. And Finally it draws a very helpful Box on the left side on the chart includes (take profits and Stop loss
STRUCTURAL TREND LINES - MT4 Indicator Simple indicator that automatically draws trend lines based on market structure. Features: - 3 degrees of structure detection (short, medium, long term) - Configurable swing strength for each degree - Single color per degree for clean visualization - Adjustable number of lines per degree - Customizable colors and line widths How it works: The indicator identifies swing highs and lows based on the strength parameter, then connects these points to create t
"The Squeeze indicator attempts to identify periods of consolidation in a market. In general the market is either in a period of quiet consolidation or vertical price discovery. By identifying these calm periods, we have a better opportunity of getting into trades with the potential for larger moves. Once a market enters into a "squeeze," we watch the overall market momentum to help forecast the market direction and await a release of market energy." The StdATR Squeeze Channel combines standard
Indicator for binary options arrow is easy to use and does not require configuration works on all currency pairs, cryptocurrencies buy signal blue up arrow sell signal red down arrow tips do not trade during news and 15-30 minutes before their release, as the market is too volatile and there is a lot of noise it is worth entering trades one or two candles from the current period (recommended for 1 candle) timeframe up to m 15 recommended money management fixed lot or fixed percentage of the depo
The   RSI Divergence + FVG Signal   indicator combines   Relative Strength Index (RSI) Divergence   with   Fair Value Gap (FVG)   detection to generate high-probability buy and sell signals based on both momentum shifts and institutional imbalance zones. Core Features: RSI Divergence Detection : Identifies both regular and hidden bullish/bearish divergences between price and RSI. Divergences indicate potential trend reversals or continuation. FVG Zone Recognition : Detects Fair Value Gaps (imbal
Crypto_Forex Indicator "CCI with Dynamic OverSold/OverBought zones" for MT4, No Repaint. - Commodity Channel Index (CCI) is excellent for Momentum trading into the trend direction. - It is great to take Sell entries from dynamic OverBought zone and Buy entries from dynamic OverSold zone into the direction of main trend. - This indicator is excellent to combine with Price Action entries as well. - Dynamic OverBought zone - above yellow line. - Dynamic OverSold zone - below blue line. - CCI osci
Forex Gump
Andrey Kozak
2.4 (5)
Forex Gump is a fully finished semi-automatic trading system. In the form of arrows, signals are displayed on the screen for opening and closing deals. All you need is to follow the instructions of the indicator. When the indicator shows a blue arrow, you need to open a buy order. When the indicator shows a red arrow, you need to open a sell order. Close orders when the indicator draws a yellow cross. In order to get the most effective result, we recommend using the timeframes H1, H4, D1. There
Super Reversal Pattern
Parfait Mujinga Ndalika
Super Reversal Pattern Indicator Unlock the power of advanced pattern recognition with our Super Reversal Pattern Indicator. Designed for traders seeking precision and reliability, this indicator identifies one of the most effective reversal patterns in technical analysis, offering a significant edge in your trading strategy. Key Features: Non-Repainting Accuracy: Enjoy the confidence of non-repainting technology. Once a Super Reversal Pattern is detected, it remains static, providing consiste
"Dynamic Scalping Oscillator" - is an advanced custom Crypto_Forex indicator - efficient Trading tool for MT4!  - New generation of Oscillators - see pictures to check how to use it. - Dynamic Scalping Oscillator has adaptive Oversold/Overbought zones. - Oscillator is an auxiliary tool to find exact entry points from dynamic OverSold/OverBought areas. - Oversold values: below Green line, Overbought values: over Orange line . - This indicator is great to combine with Price Action patterns as we
[ZhiBiCCI] indicators are suitable for all cycle use, and are also suitable for all market varieties. [ZhiBiCCI] Green solid line is a reversal of bullish divergence. The green dotted line is a classic bullish divergence. [ZhiBiCCI] The solid line to the red is a reverse bearish divergence. The red dotted line is a classical bearish divergence. [ZhiBiCCI] can be set in the parameters (Alert, Send mail, Send notification), set to (true) to send instant signals to the alarm window, email, insta
Chart Patterns Detect 15 patterns (Ascending Triangle, Descending Triangle, Rising Wedge, Falling Wedge, Bullish Flag, Bearish Flag, Bullish Rectangle, Bearish Rectangle Symmetrical triangle, Head and Shoulders, Inverted Head and Shoulders, Triple top, Triple Bottom, Double Top, Double Bottom) Use historical data to calculate the probability of each pattern to succeed (possibility to filter notification according to the chance of success) gives graphic indication about the invalidation level and
Master head and shoulders patterns for better trading decisions A head and shoulders pattern is a chart formation that resembles a baseline with three peaks, the outside two are close in height and the middle is highest. It predicts a bullish-to-bearish trend reversal and is believed to be one of the most reliable trend reversal patterns. It is one of several top patterns that signal, with varying degrees of accuracy, that a trend is nearing its end. [ Installation Guide | Update Guide | Trouble
Dash M30 Signal
Nirundorn Promphao
The principle of this indicator is very simple: detecting the trend with Moving Average, Predicting BUY and SELL signals with arrows, alerts and notifications. The parameters are fixed and automatically calculated on M30 timeframe. You can trade with small timeframe or using Dash DIY Ai Robot, Dash Smart M30 Strategy for autotrading on any timeframe and any currency pairs. You can download template and the presets file for autotrading with Dash Smart M30 Strategy . Example: If you install indica
PABT Pattern Indicator - it's classical system one of the signal patterns. Indicator logic - the Hi & Lo of the bar is fully within the range of the preceding bar, look to trade them as pullback in trend. In the way if indicator found PABT pattern it's drawing two lines and arrow what showing trend way.  - First line - it's entry point and drawing at: 1. On the high of signal bar or on middle of the signal bar (depending from indicator mode) for buy; 2. On the low of signal bar or on middle of t
The SMC Venom Model BPR indicator is a professional tool for traders working within the Smart Money (SMC) concept. It automatically identifies two key patterns on the price chart: FVG (Fair Value Gap) is a combination of three candles, in which there is a gap between the first and third candles. It forms a zone between levels where there is no volume support, which often leads to a price correction. BPR (Balanced Price Range) is a combination of two FVG patterns that form a “bridge” - a zone of
Fourteen plus nine TD Sequential
MOHAMMED IMAD HUSSEIN BASSEE
Fourteen plus nine What is it for? Applying Tom DeMark’s TD Sequential serves the purpose of identifying a price point where an uptrend or a downtrend exhausts itself and reverses. . What are the main components of TD Sequential? TD Sequential has two parts – TD Setup and TD Countdown. The first phase of TD Sequential starts with a TD Setup and is completed with a 9 count. When the 9 count is completed, it is at that point, a price pause, price pullback, or reversal is likely. It is also at tha
FiboRec
Alfred Kamal
This indicator depends on Fibonacci lines but there is a secret lines i used them, by using FiboRec indicator you will be able to know a lot of important information in the market such as: Features You can avoid entry during market turbulence. You can enter orders in general trend only. You will know if the trend is strong or weak. Signal Types and Frame used You can use this indicator just on H1 frame. Enter buy order in case Candle break out the square area and closed over it, at least 20 pi
Laser Trend
Nicolas Zouein
The trend is your friend! This is what this indicator is all about. Follow this famous saying and be safe. Characteristics: Buy/Sell signals fixed on the close of a bar. Works on all symbols and all timeframes. Clear visual market trend laser line, Buy/Sell signal arrows, market strength meter, TP1 & TP2 boxes. Visual signals when to enter, when to exit the market. No repainting. Compatible with Flexible EA for trading automation. (Ask for a free set file optimized to perform 2010-2018) Parame
Voenix
Lorentzos Roussos
4.58 (12)
Harmonic patterns scanner and trader . Some Chart patterns too  Patterns included :  ABCD pattern Gartley pattern Bat pattern Cypher pattern 3Drives pattern Black Swan pattern White Swan pattern Quasimodo pattern or Over Under pattern Alt Bat pattern Butterfly pattern Deep Crab pattern Crab pattern Shark pattern FiveO pattern Head And Shoulders pattern Ascending Triangle pattern One Two Three pattern  And 8 custom patterns  Voenix is a multi timeframe and multi pair harmonic pattern scanner ,sup
Noize Absorption Index MT4
Ekaterina Saltykova
5 (1)
Noize Absorption Index - is the manual trading system that measures the difference of pressure between bears forces and bulls forces. Green line - is a noize free index that showing curent situation. Zero value of index shows totally choppy/flat market.Values above zero level shows how powerfull bullish wave is and values below zero measures bearish forces.Up arrow appears on bearish market when it's ready to reverse, dn arrow appears on weak bullish market, as a result of reverse expectation. S
The principle of this indicator is very simple: detecting the trend with Moving Average, Predicting BUY and SELL signals with arrows, alerts and notifications. The parameters are fixed and automatically calculated on M30 timeframe. You can trade with small timeframe or using Dash DIY Ai Robot, Dash Smart Boxing5 Strategy for autotrading on any timeframe and any currency pairs. You can download template and the presets file for autotrading with Dash Smart Boxing5 Strategy . Example: If you instal
The CCI Divergence is a reasonably useful indicator in itself, but it is even more effective when used with divergence pattern trading. The CCI Divergence indicator signal is one of the most potent signals among the indicators that exist in the market. Here is new version for Divergence Indicator using CCI method, with more improvements. Divergences indicate a potential investment point because the directional moment does not confirm the price. A bullish divergence occurs when the underlying va
PZ Harmonacci Patterns
PZ TRADING SLU
3.17 (6)
Trade smarter, not harder: Empower your trading with Harmonacci Patterns This is arguably the most complete harmonic price formation auto-recognition indicator you can find for the MetaTrader Platform. It detects 19 different patterns, takes fibonacci projections as seriously as you do, displays the Potential Reversal Zone (PRZ) and finds suitable stop-loss and take-profit levels. [ Installation Guide | Update Guide | Troubleshooting | FAQ | All Products   | Get Help ] It detects 19 differen
Buyers of this product also purchase
Ultimate Sniper Dashboard
Hispraise Chinedum Abraham
4.82 (22)
Currently on massive July Discount! Prices will increase in the future! Read description below! Once you purchase, send a message to my inbox for manual and starter kit. Best Entry System for Ultimate Sniper Dashboard: ULTIMATE DYNAMIC LEVELS. (Please Check my products) The Ultimate Sniper Dashboard ONLY works on live markets due to MT4 multicurrency testing limits. Introducing the Ultimate-Sniper Dashboard! Our very best which contains both HA-Sniper, MA-Sniper. and many special modes. The Ul
First of all Its worth emphasizing here that this Trading Tool is Non-Repainting Non-Redrawing and Non-Lagging Indicator Which makes it ideal for professional trading . [Online course] ,   and   [manual] The Smart Price Action Concepts Indicator is a very powerful tool for both new and experienced traders . It packs more than 20 useful indicators into one combining advanced trading ideas like Inner Circle Trader Analysis and Smart Money Concepts Trading Strategies . This indicator focuses on Sm
The " Dynamic Scalper System " indicator is designed for the scalping method of trading within trend waves. Tested on major currency pairs and gold, compatibility with other trading instruments is possible. Provides signals for short-term opening of positions along the trend with additional price movement support. The principle of the indicator. Large arrows determine the trend direction. An algorithm for generating signals for scalping in the form of small arrows operates within trend waves.
Ultimate Dynamic Levels
Hispraise Chinedum Abraham
4.7 (10)
Discounted at $199 for early birds! Prices may increase in the future. Read description below. Once you purchase, send a message to my inbox for manual. Introducing Ultimate Dynamic Levels - the BEST Entry Indicator for the Ultimate Sniper Dashboard! Extremely Low-Risk timely entries and high RR! Find the Ultimate Sniper Dashboard Here The most important ability for both beginner and pro traders is to tell exactly where and when a market is most likely to turn, and how to get in safely and ex
Super Signal – Skyblade Edition Professional No-Repaint / No-Lag Trend Signal System with Exceptional Win Rate | For MT4 / MT5 It works best on lower timeframes, such as 1-minute, 5-minute, and 15-minute charts. Core Features: Super Signal – Skyblade Edition is a smart signal system designed specifically for trend trading. It applies a multi-layered confirmation mechanism to detect only strong, directional moves supported by real momentum. This system does not attempt to predict tops or bottoms
Introducing ON Trade Waves Patterns Harmonic Elliot Wolfe, an advanced indicator designed to detect various market patterns using both manual and automated methods. Here's how it works: Harmonic Patterns: This indicator can identify harmonic patterns that appear on your chart. These patterns are essential for traders practicing harmonic trading theory, as popularized by Scott Carney's book "Harmonic Trading vol 1&2." Whether you draw them manually or rely on automated detection, ON Trade Waves
Linear Trend Predictor - A trend indicator that combines entry points and direction support lines. It works on the principle of breaking through the High/Low price channel. The indicator algorithm filters market noise, takes into account volatility and market dynamics. Indicator capabilities Using smoothing methods, it shows the market trend and entry points for opening BUY or SELL orders. Suitable for determining short-term and long-term market movements by analyzing charts on any timeframes.
Miraculous Indicator – 100% Non-Repaint Forex and Binary Tool Based on Gann Square of Nine This video introduces the Miraculous Indicator , a highly accurate and powerful trading tool specifically developed for Forex and Binary Options traders. What makes this indicator unique is its foundation on the legendary Gann Square of Nine and Gann's Law of Vibration , making it one of the most precise forecasting tools available in modern trading. The Miraculous Indicator is fully non-repaint, meaning t
Trading Special – 40% OFF Best Solution for any Newbie or Expert Trader! This dashboard software is working on 28 currency pairs plus one. It is based on 2 of our main indicators (Advanced Currency Strength 28 and Advanced Currency Impulse). It gives a great overview of the entire Forex market plus Gold or 1 indices. It shows Advanced Currency Strength values, currency speed of movement and signals for 28 Forex pairs in all (9) timeframes. Imagine how your trading will improve when you can watch
Crosskalp1
Mikhail Bilan
Добрый День уважаемые трейдеры!  Вашему вниманию индикатор созданный и работающий на базе трендовика ADX,  для торговли на смене направления движения который учитывает коррекцию и даёт возможность на ней заработать.  Применяю этот индикатор для скальпинга. Рекомендую таймфреймы от 15 ти минутного(М15) до часового (Н1) периодов.  Красный кружок сигнал на продажу- Sell) Зелёный кружок  сигнал на покупку Buy) Чем меньше ваш таймфрейм тем меньше пунктов вы зарабатываете.   Важно выставлять стопы! !В
NAM Order Blocks
NAM TECH GROUP, CORP.
3.67 (3)
MT4 Multi-timeframe Order Blocks detection indicator. Features - Fully customizable on chart control panel, provides complete interaction. - Hide and show control panel wherever you want. - Detect OBs on multiple timeframes. - Select OBs quantity to display. - Different OBs user interface. - Different filters on OBs. - OB proximity alert. - ADR High and Low lines. - Notification service (Screen alerts | Push notifications). Summary Order block is a market behavior that indicates order collection
Precautions for subscribing to indicator This indicator only supports the computer version of MT4 Does not support MT5, mobile phones, tablets The indicator only shows the day's entry arrow The previous history arrow will not be displayed (Live broadcast is for demonstration) The indicator is a trading aid Is not a EA automatic trading No copy trading function The indicator only indicates the entry position No exit (target profit)  The entry stop loss point is set at 30-50 PIPS Or the front hi
Fxland Price Reversal Zones (MT4) FXLAND Smart Reversal Indicator is a professional technical analysis tool designed to help traders identify potential price reversal zones and key market turning points with clarity and precision. The best reversal indicator and price return by choosing only one ceiling or floor in each time frame A masterpiece of combining mathematics and Gann, fractal matrix, Fibonacci, movement angle and time. Completely intelligent Key Features Detects potential pr
Dynamic Forex28 Navigator
Bernhard Schweigert
4.43 (7)
Specials Discount now. The Next Generation Forex Trading Tool. Dynamic Forex28 Navigator is the evolution of our long-time, popular indicators, combining the power of three into one: Advanced Currency Strength28 Indicator (695 reviews) + Advanced Currency IMPULSE with ALERT (520 reviews) + CS28 Combo Signals (recent Bonus) Details about the indicator  https://www.mql5.com/en/blogs/post/758844 What Does The Next-Generation Strength Indicator Offer? Everything you loved about the originals, now
Introducing the Delta Volume Profile Indicator - Unleash the Power of Institutional Precision!  Technical Indicator: Are you ready to trade like the pros? The Delta Volume Profile Indicator is no ordinary tool. It’s a high-precision, cutting-edge indicator that puts the power of institutional-grade trading in your hands. This unique indicator analyses delta volume distribution in real-time, revealing the market's hidden buy/sell imbalances that the biggest financial institutions rely on to antic
Looking for a powerful yet lightweight swing detector that accurately identifies market structure turning points? Want clear, reliable buy and sell signals that work across any timeframe and any instrument? Buy Sell Arrow MT Swing is built exactly for that — precision swing detection made simple and effective. This indicator identifies Higher Highs (HH) , Higher Lows (HL) , Lower Highs (LH) , and Lower Lows (LL) with remarkable clarity. It is designed to help traders easily visualize market stru
GoldRush Trend Arrow Signal V1.6 The GoldRush Trend Arrow Signal indicator V1.6 continues to provide precise, real-time trend analysis tailored for high-speed, short-term scalpers in XAU/USD , but it now has additional features and improved efficiency and reliability. Built specifically for the 1-minute time frame, this tool displays directional arrows for clear entry points, allowing scalpers to navigate volatile market conditions with confidence. The indicator consists of PRIMARY and SECONDARY
Pulse Scalping Line - an indicator for identifying potential pivot points. Based on this indicator, you can build an effective Martingale system. According to our statistics, the indicator gives a maximum of 4 erroneous pivot points in a series. On average, these are 2 pivot points. That is, the indicator shows a reversal, it is erroneous. This means that the second signal of the indicator will be highly accurate. Based on this information, you can build a trading system based on the Martingale
El indicador "MR BEAST ALERTAS DE LIQUIDEZ" es una herramienta avanzada diseñada para proporcionar señales y alertas sobre la liquidez del mercado basándose en una serie de indicadores técnicos y análisis de tendencias. Ideal para traders que buscan oportunidades de trading en función de la dinámica de precios y los niveles de volatilidad, este indicador ofrece una visualización clara y detallada en la ventana del gráfico de MetaTrader. Características Principales: Canal ATR Adaptativo: Calcula
Meravith
Ivan Stefanov
5 (3)
Market makers' tool. Meravith will: Analyze all timeframes and display the current trend in force. Highlight liquidity zones (volume equilibrium) where bullish and bearish volumes are equal. Display all liquidity levels across different timeframes directly on your chart. Generate and present text-based market analysis for your reference. Calculate targets, support levels, and stop-loss points based on the current trend. Compute the risk/reward ratio for your trades. Determine position size accor
Technical indicator that structures charts and identifies cyclical price movements. Can work on any charts. Several types of alerts. There are additional arrows on the chart itself. Without redrawing on history, works on closing a candle. Recommended TF from M5 and higher. Easy to use and configure parameters. When using 2 indicators with different parameters, you can use without other indicators. Has 2 input parameters Cyclicality and Signal duration These 2 parameters work with the processin
Adaptive Volatility Range [AVR] is a powerful tool for identifying key trend reversal points. AVR accurately reflects the Average True Range (ATR) of volatility, taking into account the Volume-Weighted Average Price (VWAP). The indicator adapts to any market volatility by calculating the average volatility over a specific period, ensuring a stable rate of profitable trades. You receive not just an indicator but a professional automated trading system , AVR-EA . Advantages: 100% No Repaint –
Introducing the F-16 Plane Indicator, a cutting-edge MT4 tool designed to revolutionize your trading experience. Inspired by the unmatched speed and precision of the F-16 fighter jet, this indicator combines advanced algorithms and state-of-the-art technology to deliver unparalleled performance in the financial markets. With the F-16 Plane Indicator, you'll soar above the competition as it provides real-time analysis and generates highly accurate trading signals. Its dynamic features are engin
No Repaint Bext
Andrey Kozak
1 (1)
No Repaint Bext is a ready-made trading system. Shows when to open and when to close trades, as well as in which direction. Every time a green arrow appears, you need to open a buy trade. Close all buy trades when a red arrow appears. The same goes for the opposite direction, every time a red arrow appears, open sell trades and close them all when a green arrow appears. We use the M5 timeframe for trading. You can trade on any cozy pair. This indicator does not repaint and practically does not
Presenting one-of-a-kind Gann Indicator for XAUUSD IQ Gold Gann Levels is a non-repainting, precision tool designed exclusively for XAUUSD/Gold intraday trading. It uses W.D. Gann’s square root method to plot real-time support and resistance levels, helping traders spot high-probability entries with confidence and clarity. William Delbert Gann (W.D. Gann) was an exceptional market analyst whose trading technique was based on a complex blend of mathematics, geometry, astrology, and ancient calcul
This indicator is an indicator for automatic wave analysis that is perfect for practical trading! Case... Note:   I am not used to the Western name for wave classification. Influenced by the naming habit of Chaos Theory (Chanzhongshuochan), I named the basic wave as   pen   , the secondary wave band as   segment   , and the segment with trend direction   as main trend segment   (this naming method will be used in future notes, let me tell you in advance), but the algorithm is not closely relat
Are you looking for a simple and reliable indicator that can help you spot market swing points easily? Do you want clear buy and sell signals that work on any timeframe and any trading instrument? Buy Sell Signal Pro is designed to do exactly that. It helps traders identify important market turning points and understand the current market structure in a clear and easy way. This indicator detects Higher Highs (HH), Higher Lows (HL), Lower Highs (LH), and Lower Lows (LL) so you can quickly see wh
Supply and Demand Dashboard PRO
Bernhard Schweigert
4.8 (20)
Trading Special – 40% OFF This dashboard is a very powerful piece of software working on multiple symbols and up to 9 timeframes. It is based on our main indicator (Best reviews:   Advanced Supply Demand ). The dashboard gives a great overview. It shows: Filtered Supply and Demand values including zone strength rating, Pips distances to/and within zones, It highlights nested zones, It gives 4 kind of alerts for the chosen symbols in all (9) time-frames. It is highly configurable for your pers
GEM Signal Pro GEM Signal Pro is a trend-following indicator for MetaTrader 4, designed for traders who want clearer signals, more structured trade setups, and more practical risk management directly on the chart. Instead of showing only a simple arrow, GEM Signal Pro helps present the full trade idea in a cleaner and more readable way. When conditions are confirmed, the indicator can display the entry price, stop loss, and take profit targets on the chart, helping traders review the setup more
Product Name:   Quantum Regime Indicator Short Description:   A multi-engine structural regime and volatility filter. Description: Quantum Regime Indicator (QRI) is a sophisticated technical analysis algorithm designed to identify market structure shifts and volatility regimes. Unlike standard indicators that rely on immediate price action, QRI utilizes a hierarchical logic architecture to filter market noise and identify statistical extremes. The indicator is built on the philosophy of "Market
More from author
Trendiness Index
Libertas LLC
5 (3)
"The trend is your friend" is one of the best known sayings in investing, because capturing large trendy price movements can be extremely profitable. However, trading with the trend is often easier said than done, because many indicators are based on price reversals not trends. These aren't very effective at identifying trendy periods, or predicting whether trends will continue. We developed the Trendiness Index to help address this problem by indicating the strength and direction of price trend
Detect strength for uptrends and downtrends by tracking Buy Power and Sell Power. Stay on the right side of the market by being able to determine whether the market is in a bull or bear trend and how strong the trend is. Free download for a limited time! We hope you enjoy, with our very best wishes during this pandemic! Trend Trigger Factor  aims to ride out sideways movement, while positioning the trader in the correct side of the market to capture big trends when they occur. It was   origin
FREE
Two Period RSI
Libertas LLC
5 (4)
Two Period RSI compares long-term and short-term RSI lines, and plots a fill between them for improved visualization. Fill is colored differently according to an uptrend (short period RSI above long period RSI) or a downtrend (short period RSI below long period RSI). Short-term RSI crossing long-term RSI adds a more robust trend confirmation signal than using single period RSI alone. This is a small tool to help visualize and confirm RSI trends. We hope you enjoy! Looking for RSI alerts? You can
FREE
Whether trading stocks, futures, options, or FX, traders confront the single most important question: to trade trend or range? This tool helps you identify ranges to either trade within, or, wait for breakouts signaling trend onset. Free download for a limited time! We hope you enjoy, with our very best wishes during this pandemic! The issue with identifying ranges is some ranges and patterns are easy to miss, and subject to human error when calculated on the fly. The Automatic Range Identifi
FREE
"Capture the sleeping and waking alligator." Detect trend entrance/exit conditions - this indicator can also be tuned according to your trading style. You can adjust a confidence parameter to reduce false positives (but capture less of the trend). This is based on a modification of the Alligator indicator by Bill Williams, an early pioneer of market psychology.  2 main strategies: either the " conservative"  approach to more frequently make profitable trades (at a lower profit), or the " high r
FREE
True Choppiness Direction   determines if the market is choppy (trading sideways) or if it is trending, as well as the trend direction and strength   (green=up, red=down, grey=no trend) . The underlying algorithm is designed to detect trend movements even in the presence of noisy market data, please see screenshots. Trend strength is indicated by taller or shorter red/green fill. Choppiness index is range-bound between -50 (very trendy) and +50 (very choppy). This is a custom algorithm designed
ATR Volatility Alerts
Libertas LLC
4.33 (3)
ATR Volatility plots the ATR-based volatility, and triggers alerts when it crosses user-defined upper and lower thresholds (purple and tan lines, please see screenshots). Circles are painted when ATR volatility crosses either above the upper threshold, or below the lower threshold. This is a small tool custom-built by our group, by specific request of one of our customers. We hope you enjoy! Do you have an indicator you would like to see designed? Feel free to send us a message! Click here for m
FREE
Choppiness Index
Libertas LLC
5 (1)
"Wouldn't we all love to reliably know when a stock is starting to trend, and when it is in flat territory? An indicator that would somehow tell you to ignore the head fakes and shakeouts, and focus only on the move that counts?" The Choppiness Index is a non-directional indicator designed to determine if the market is choppy (trading sideways) or not choppy (trading within a trend in either direction). It is an oscillating indicator between -50 (very trendy) and +50 (very choppy). There are man
EMA Separation
Libertas LLC
5 (1)
EMA Separation plots 2 exponential moving averages, and a fill between them. The fill is colored differently according to an uptrend (short period EMA above long period EMA), or a downtrend (short period EMA below long period EMA). This is a small tool to help visualize the difference between long and short period averages. We hope you enjoy! EMA Separation can also be paired with our free EMA Separation Coefficient Parameters Short period (Default=10): # bars used to calculate short period EMA
FREE
EMA Separation Coefficient reflects the separation between short-term and long-term exponential moving average trend resistance, as well as the direction of the current movement. Pay attention to potential crossover points when the coefficient approaches zero, this may indicate an upcoming breakout or reversal. Wait for confirmation of the trend before entering the trade, and exit when the coefficient forms a max (for calls) or a min (for puts). This is a small tool to help visualize the differe
FREE
Automate your charting with the All-In-One SRES channel indicator. This is a complete package designed to address 3 questions: (1) when to enter a trade, (2) what is a good exit point, and (3) what is the probabilistic likelihood of success of the trade. Longevity and Flexibility : The All-In-One SRES calculates and charts S upport, R esistance, E xpected range, and a S queeze channel, and is enormously flexible for many trading strategies. Each option is customizable to fit your strategy, and c
"Battles between bulls and bears continue to influence price development long after the combat has ended, leaving behind a messy field that observant technicians can use to manage risk and find opportunities. Apply "trend mirror" analysis to examine these volatile areas, looking for past action to impact the current trend when price turns and crosses those boundaries." - Investopedia.com RSI Mirrors and Reflections is a robust technique using multiple RSI periods, mirrors and reflections based o
Fano Factor is a measure of the dispersion of the probability distribution of Fano noise, named after Ugo Fano, an Italian-American Physicist. Fans has applications in Particle Detection and Neuroscience for describing variability in complex multivariate data. In trading, we have discovered Fano can be used as a 'signal to noise' ratio, and can indicate the strength of price movements (i.e., price movement is greater than predicted by purely statistical measures). Like standard deviation, Fano F
"The Squeeze indicator attempts to identify periods of consolidation in a market. In general the market is either in a period of quiet consolidation or vertical price discovery. By identifying these calm periods, we have a better opportunity of getting into trades with the potential for larger moves. Once a market enters into a "squeeze," we watch the overall market momentum to help forecast the market direction and await a release of market energy." The StdATR Squeeze Channel combines standard
The Relative Momentum Index (RMI) was developed by Roger Altman, and introduced in his Feb 1993 article in Technical Analysis of Stocks & Commodities magazine. As its name suggests, Relative Momentum Index adds a momentum component to the traditional RSI, designed to increase reliability by decreasing spurious oscillations between defined overbought and oversold levels. This Relative Momentum Index indicator has 2 components. A change in RMI line color provides a warning signal for an upward or
Two Period RSI + Alerts compares long-term and short-term RSI lines, and plots a fill between them for improved visualization. Fill is colored differently according to an uptrend (short period RSI above long period RSI) or a downtrend (short period RSI below long period RSI). Short-term RSI crossing long-term RSI adds a more robust trend confirmation signal than using single period RSI alone. This is a tool to help visualize and confirm RSI trends. We hope you enjoy! Alerts Email, message, and
SuperTrend Alerts
Libertas LLC
3 (4)
SuperTrend Alerts adds alerts to the widely popular SuperTrend indicator. As the name suggests, SuperTrend is a trending indicator which works best in trendy (not choppy) markets. SuperTrend is extremely popular for intraday and daily trading, and can be used on any timeframe. Place a call when the price closes above the SuperTrend line, and place a put when the price closes below the SuperTrend line. These crossovers are highlighted by non-repainting up/down arrows. Alerts Email, message and s
True Choppiness Direction determines if the market is choppy (trading sideways) or if it is trending, as well as the trend direction and strength (green=up, red=down, grey=no trend) . The underlying algorithm is designed to detect trend movements even in the presence of noisy market data, please see screenshots. Trend strength is indicated by taller or shorter red/green fill. Choppiness index is range-bound between -50 (very trendy) and +50 (very choppy). This is a custom algorithm designed by u
"The VIX Fix is a powerful indicator that detects market bottoms for any asset " The VIX (volatility index) is a ticker symbol of implied volatility of the S&P 500, calculated by the Chicago Board Options Exchange. VIX is a popular measure of market risk, and is one of the best measures of market bottoms that currently exists. Unfortunately, it only exists for the S&P 500... The VIX Fix was published by Larry Williams in 2007, and it synthesizes a VIX volatility index for any asset (not just the
WaveTrend Momentum Oscillator is an upgrade to the popular and easy-to-use WaveTrend Oscillator. The WaveTrend Momentum Oscillator adds a momentum component to the original WaveTrend calculation, in order to provide faster and more accurate entry points during trendy market conditions. Do you prefer the original WaveTrend Oscillator? The WaveTrend Momentum Oscillator allows you to switch between momentum and original WT versions. Both provide valuable information depending on the market conditio
The  Laguerre VIX Trend Extrema   (LVTE)  indicator detects market tops and bottoms. As its name suggests, LVTE is a percentage price oscillator that identifies extreme ranges in market price. How to use:   Buy   when the indicator was in the lower "blue" range for more than 2 candles, and then moves up into grey.   Sell   when the indicator was in the upper "red" range, and then moves down into orange. Please see screenshots for examples! To make it simple, the indicator can show this by paint
Laguerre SuperTrend Clouds adds an Adaptive Laguerre averaging algorithm and alerts to the widely popular SuperTrend indicator. As the name suggests, Laguerre SuperTrend Clouds (LSC) is a trending indicator which works best in trendy (not choppy) markets. The SuperTrend is an extremely popular indicator for intraday and daily trading, and can be used on any timeframe. Incorporating Laguerre's equation to this can facilitate more robust trend detection and smoother filters. The LSC uses the impro
Catch major price movements, early in the trend. Alerts you to enter at the likely beginning of a trend, and if it's incorrect, quickly alerts you to exit to limit any loss. Designed to capture large, profitable price movements, with early entrance to maximize your returns. As shown in screenshots, typical behavior is  several quick entrance/exists with small loss , and then  capture of a large trend with high profits .  The   Instantaneous Trend  indicator is a lag-reduced method to detect pri
Looking for strong trend entrance and exit points of trends? This incorporates volume into price calculations for a fast entry/exit, showing how supply and demand factors are influencing price, and  giving you more insights than the average trader uses. The   Volume Accumulation Trend   indicator is a cumulative indicator that uses both   volume  and   price  to investigate whether an asset is growing or falling. It identifies differences between the price and the volume flow, which lets us kno
"Wouldn't we all love to reliably know when a stock is starting to trend, and when it is in flat territory? An indicator that would somehow tell you to ignore the head fakes and shakeouts, and focus only on the move that counts?" The Choppiness Index is a non-directional indicator designed to determine if the market is choppy (trading sideways) or not choppy (trading within a trend in either direction). It is an oscillating indicator between -50 (very trendy) and +50 (very choppy). There are man
Two Period RSI + Alerts compares long-term and short-term RSI lines, and plots a fill between them for improved visualization. Fill is colored differently according to an uptrend (short period RSI above long period RSI) or a downtrend (short period RSI below long period RSI). Short-term RSI crossing long-term RSI adds a more robust trend confirmation signal than using single period RSI alone. This is a tool to help visualize and confirm RSI trends. We hope you enjoy! Alerts Email, message, and
"Battles between bulls and bears continue to influence price development long after the combat has ended, leaving behind a messy field that observant technicians can use to manage risk and find opportunities. Apply "trend mirror" analysis to examine these volatile areas, looking for past action to impact the current trend when price turns and crosses those boundaries." RSI Mirrors and Reflections is a robust technique using multiple RSI periods, mirrors and reflections based on RSI values to ind
"The Squeeze indicator attempts to identify periods of consolidation in a market. In general the market is either in a period of quiet consolidation or vertical price discovery. By identifying these calm periods, we have a better opportunity of getting into trades with the potential for larger moves. Once a market enters into a "squeeze," we watch the overall market momentum to help forecast the market direction and await a release of market energy." The Modified TTM Squeeze Indicator is a modi
Catch major price movements, early in the trend. Alerts you to enter at the likely beginning of a trend, and if it's incorrect, quickly alerts you to exit to limit any loss. Designed to capture large, profitable price movements, with early entrance to maximize your returns. As shown in screenshots, typical behavior is several quick entrance/exists with small loss , and then capture of a large trend with high profits .  The Instantaneous Trend  indicator is a lag-reduced method to detect price t
Laguerre SuperTrend Clouds   adds an Adaptive Laguerre averaging algorithm and alerts to the widely popular SuperTrend indicator. As the name suggests,   Laguerre SuperTrend Clouds (LSC)   is a trending indicator which works best in trendy (not choppy) markets. The SuperTrend is an extremely popular indicator for intraday and daily trading, and can be used on any timeframe. Incorporating Laguerre's equation to this can facilitate more robust trend detection and smoother filters. The LSC uses the
Filter:
rassin85
34
rassin85 2020.06.17 20:54 
 

User didn't leave any comment to the rating

Ronald de Groot
72
Ronald de Groot 2020.05.17 21:03 
 

User didn't leave any comment to the rating

Libertas LLC
35744
Reply from developer Jay Jantz 2021.11.12 18:45
Hi Ronald, I really appreciate your feedback here. Really excited to tell you we've just released a v1.4 which now includes a speed parameter that can be dialed up/down, hopefully this helps your strategy! Please PM us if you have any questions on using it. As always, we do ask that everyone tries out the free Demo before purchasing, we never want to be in a situation where you buy an indicator that doesn't fit your current trading style.
Peter
1123
Peter 2017.11.20 06:38 
 

User didn't leave any comment to the rating

Libertas LLC
35744
Reply from developer Jay Jantz 2021.11.12 18:40
Thank you so much! Fantastic to see your successes!
Shamsul Arefin
981
Shamsul Arefin 2016.12.29 11:33 
 

User didn't leave any comment to the rating

Libertas LLC
35744
Reply from developer Jay Jantz 2021.11.12 18:39
Hi Shamsul, I know we sent PM's a few years back but wanted to belatedly thank you for your feedback here as well. Based on your feedback we updated the indicator so color/thickness settings are not lost when switching between timeframes. Thank you!
Reply to review