Primal Edge Trading
- Indicators
-
Thomas Bradley Butler
 ALL OF MY PRODUCTS ARE CLEARLY STATED WITH WHAT TO DO AND YOU MUST READ ALL AND FOLLOW DESCRIPTIONS.
 - Version: 2.0
- Updated: 10 October 2025
- Activations: 5
Primal Edge is a momentum-based trend indicator designed to show when the market’s energy shifts from buying to selling and back again. It combines moving-average logic, pip tracking, and an on-chart statistics dashboard that gives instant performance feedback in real time.
How it works
The indicator uses trend calculations and momentum
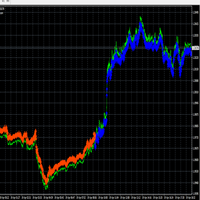
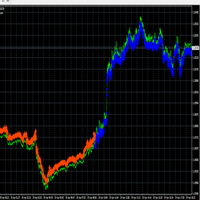
When the histogram turns blue to show bullish pressure. When it moves below, the histogram turns gold to show bearish pressure.
The system tracks every signal’s pip performance — how far it moved, whether it hit the target, and the overall win and loss count.
How to use it
-
Attach the indicator to any chart. It will automatically hide the grid for a clean view.
-
Watch the color bars.
-
Blue indicates buying strength.
-
Gold indicates selling strength.
-
-
Check the on-screen dashboard to see the last signal’s outcome, current trend direction, running pips, win rate, total pip results, and streaks.
-
Trade in the direction of the active color or wait for a color change as a possible reversal signal.
-
Adjust the input settings to suit your trading style, whether short-term or long-term.
Dashboard Input Settings
-
Show Dashboard (InpShowDashboard): Turns the statistics panel on or off.
-
Dash X / Dash Y (InpDashX, InpDashY): Adjusts the panel’s horizontal and vertical position on the chart.
-
Max History (InpMaxHistory): Controls how many past signals are listed in the history section.
-
Risk Rate (InpRiskRate): Sets the risk label shown on the dashboard (Low, Optimal, or High). This is for display only.
-
Win Pips (InpWinPips): Defines how many pips a signal must reach to count as a win. Adjust for your trading style or market volatility.
Performance Display
The dashboard automatically updates with:
-
Total signals generated.
-
Number of wins and losses based on the target.
-
Win rate percentage.
-
Total pip gain or loss.
-
Current and maximum win/loss streaks.