
MACD divergency
- Indicators
- Version: 2.20
- Updated: 31 July 2026

MACD indicator with divergence detection, histogram, arrows, labels, dashboard, and alerts.
When you get one of my indicators, you also receive a free one‑week version of any of my other indicators, so you can test how they work and see whether they fit the trading system you want to build.
Overview
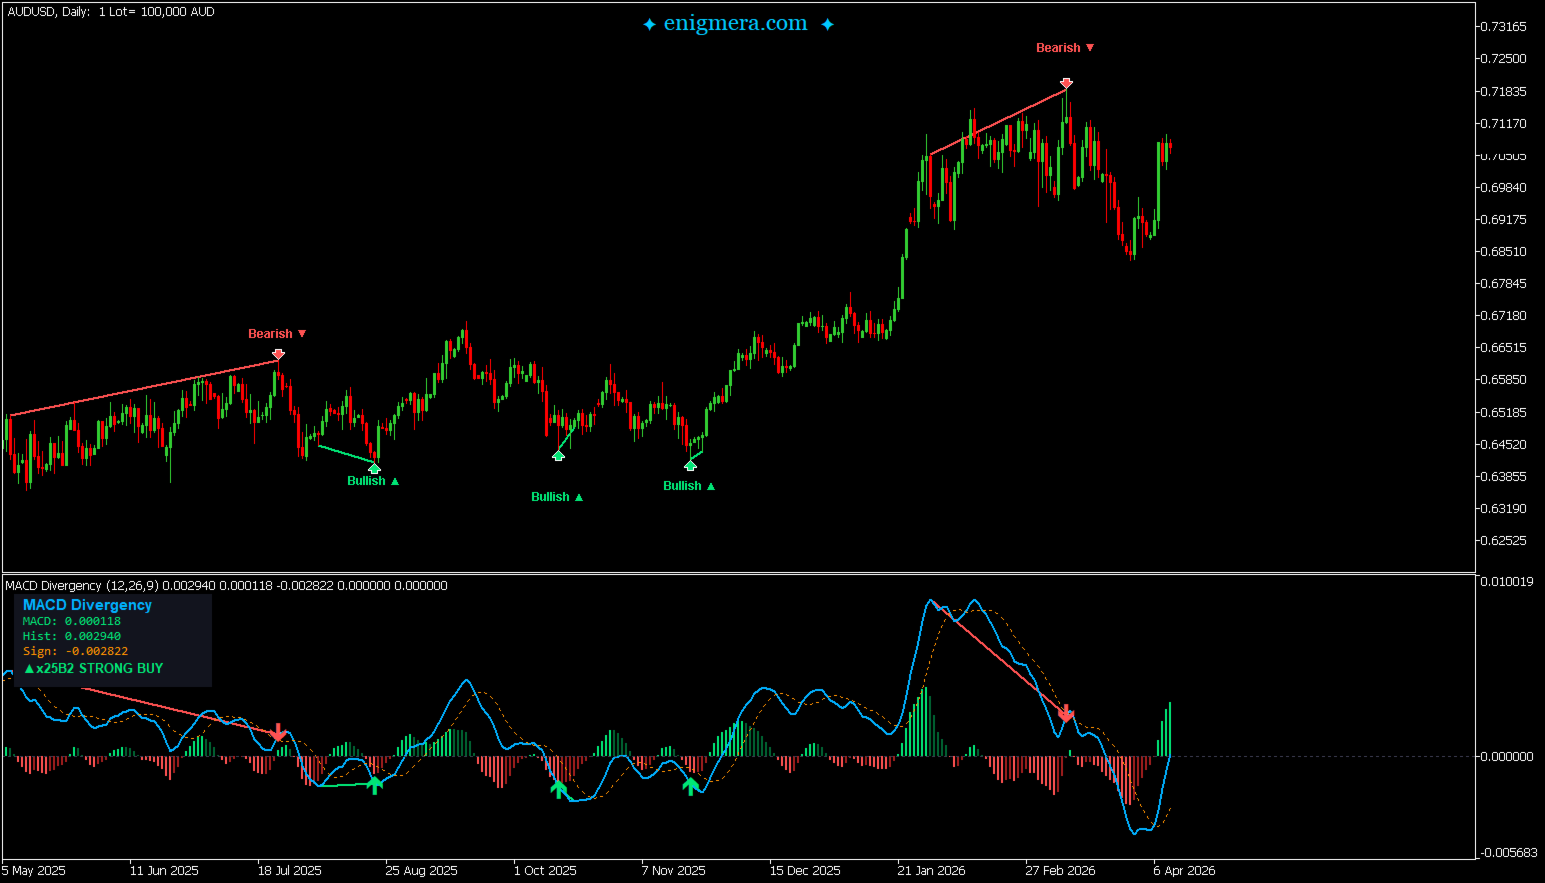
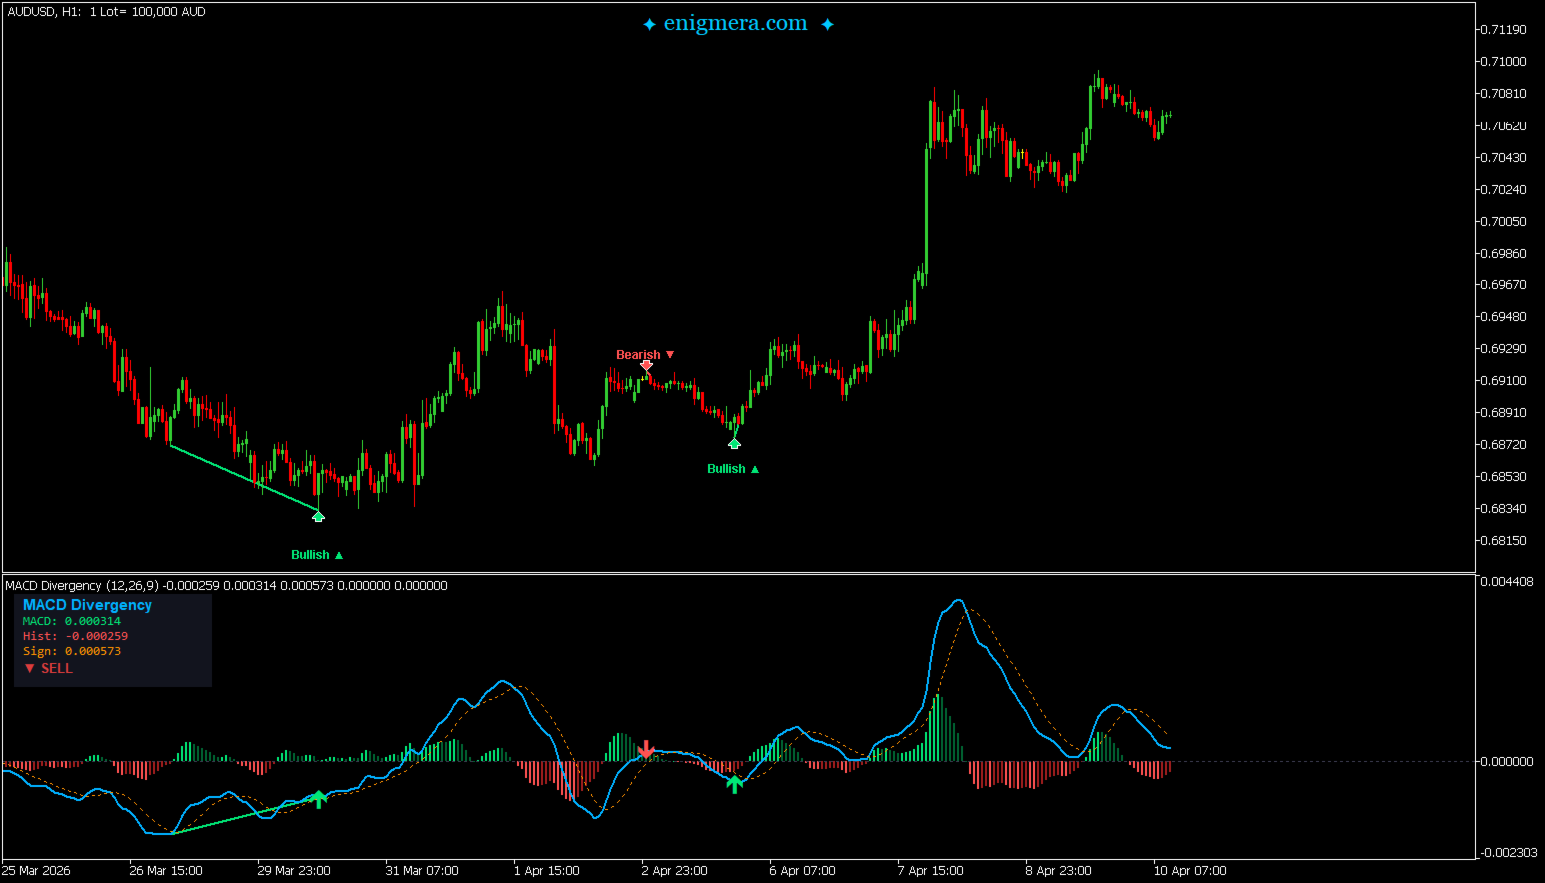
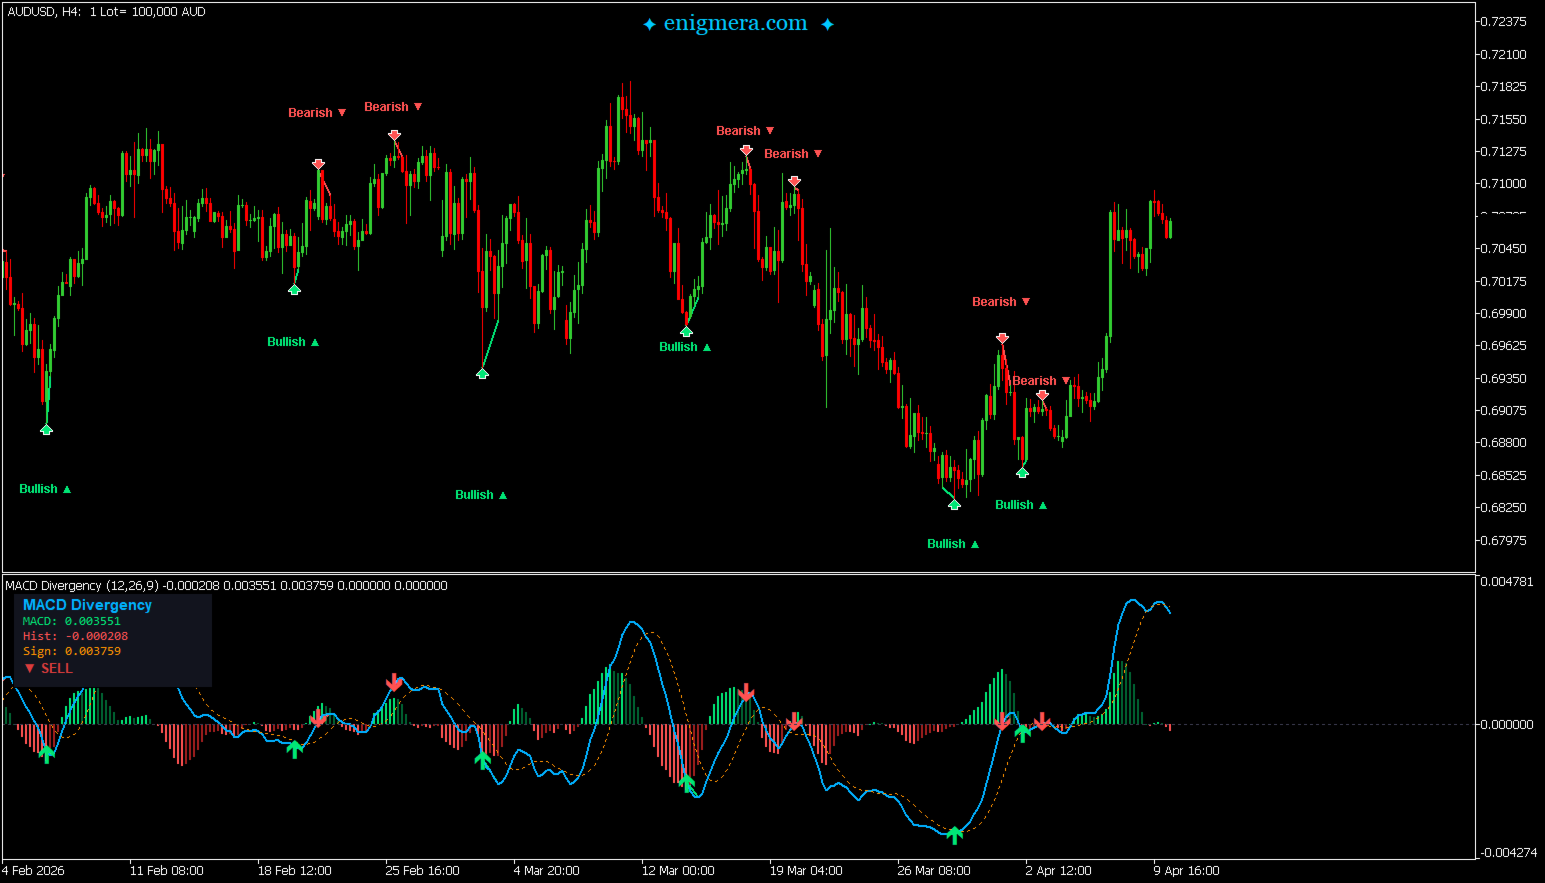
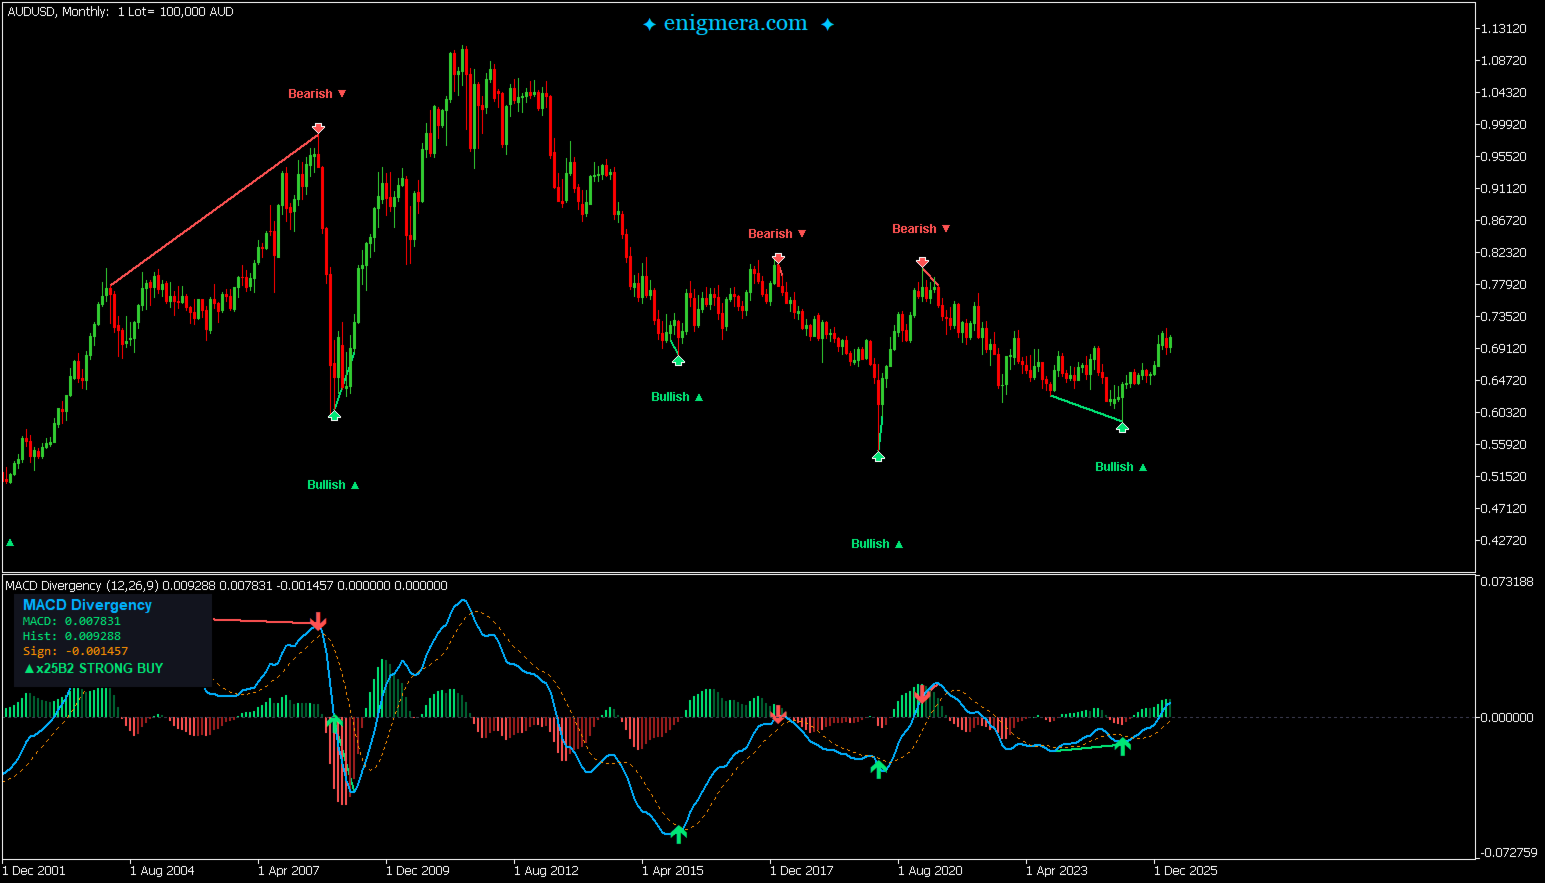
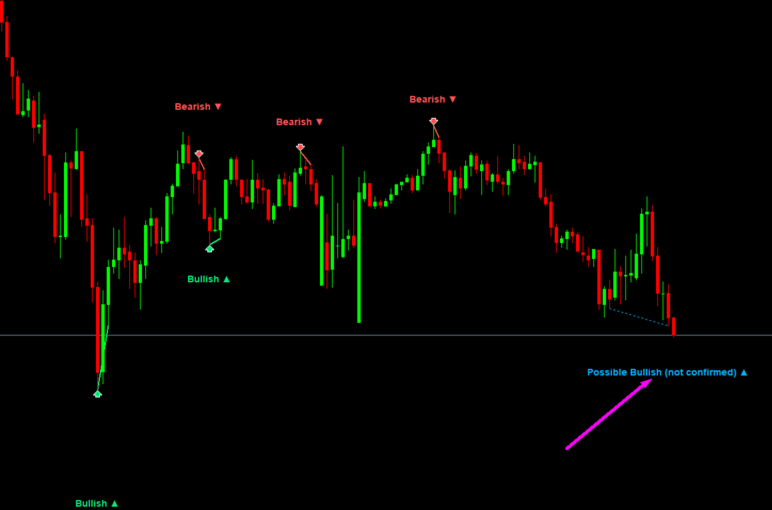
MACD Divergence Pulse calculates MACD values and detects regular and hidden divergences using a fractal-based pivot method. It draws lines on the price chart and MACD window, places arrows and labels, shows a dashboard with current values, and sends alerts on mobile.
Features
The indicator includes these elements:
- Histogram with four colors to show MACD direction and position relative to zero line.
- Detection of regular bullish/bearish and hidden bullish/bearish divergences.
- Lines connecting price pivots to MACD pivots (solid for regular, dashed for hidden).
- Arrows on price chart at divergence points.
- Labels indicating divergence type.
- Dashboard displaying MACD value, signal line, histogram color, and trend direction.
- Alerts via popup, sound, email, or push notification.
The indicator works on any symbol and timeframe. It requires no DLLs and cleans up objects on removal.
How It Works
The indicator computes MACD as the difference between fast and slow EMAs, with a signal line as SMA of MACD. It identifies MACD pivots by checking bars on each side. Divergences form when price and MACD pivots disagree:
- Regular bullish: price lower low, MACD higher low.
- Regular bearish: price higher high, MACD lower high.
- Hidden bullish: price higher low, MACD lower low.
- Hidden bearish: price lower high, MACD higher high.
- Early Warning for Possible Divergence feature!
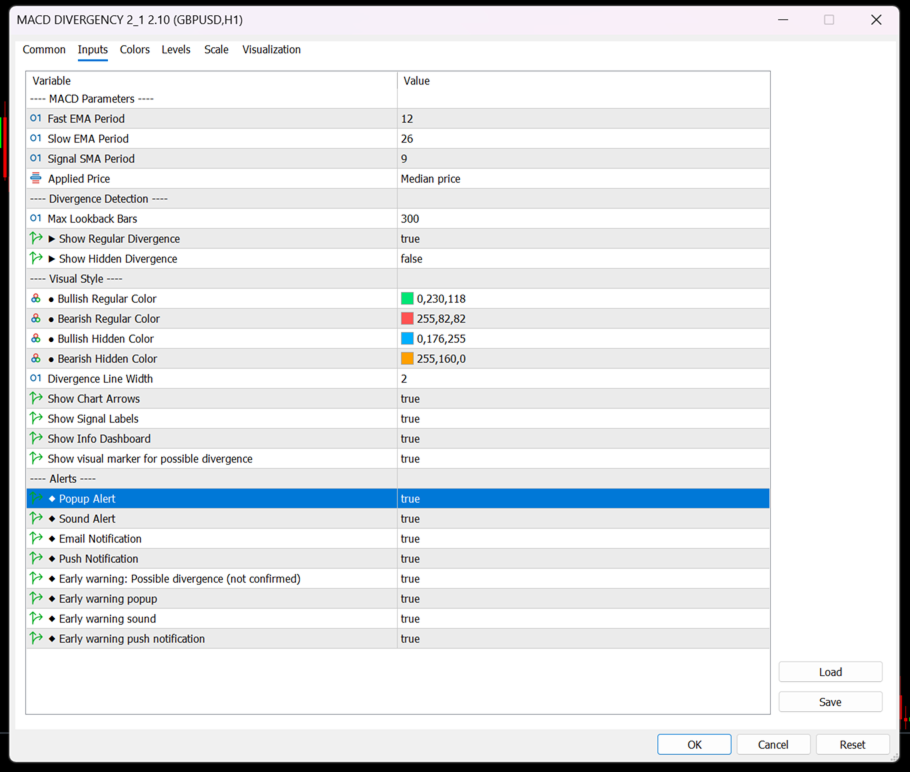
Input Parameters
MACD Settings
Fast EMA Period: 12
Slow EMA Period: 26
Signal SMA Period: 9
Applied Price: Close price
Divergence Detection
Pivot Strength (bars each side): 5
Max Lookback Bars: 500
Show Regular Divergence: true
Show Hidden Divergence: true
Visual Style
Color for Bull Regular Divergence
Color for Bear Regular Divergence
Color for Bull Hidden Divergence
Color for Bear Hidden Divergence
Divergence Line Width: 1
Show Arrows: true
Show Labels: true
Show Dashboard: true
Alerts
Popup Alert: false
Sound Alert: false
Email Alert: false
Push Notification: false
Usage Notes
Adjust pivot strength for timeframe: lower values (2-3) for M1-M15, 4-5 for M30-H1, 5-8 for H4-Daily. Use on visual charts in Strategy Tester for demo. Alerts trigger once per signal.




































































Thank you so much! Easy to use!