
GANN Master
- Indicators
- Version: 2.16
- Updated: 26 September 2026
- Activations: 20

GANN Master draws W. D. Gann's square-root levels for the current day, week or month and marks the zones where the targets of buyers and sellers meet. The levels are calculated from the high and low of the previous period, they stay fixed for the whole period and they do not repaint.
How the levels are built
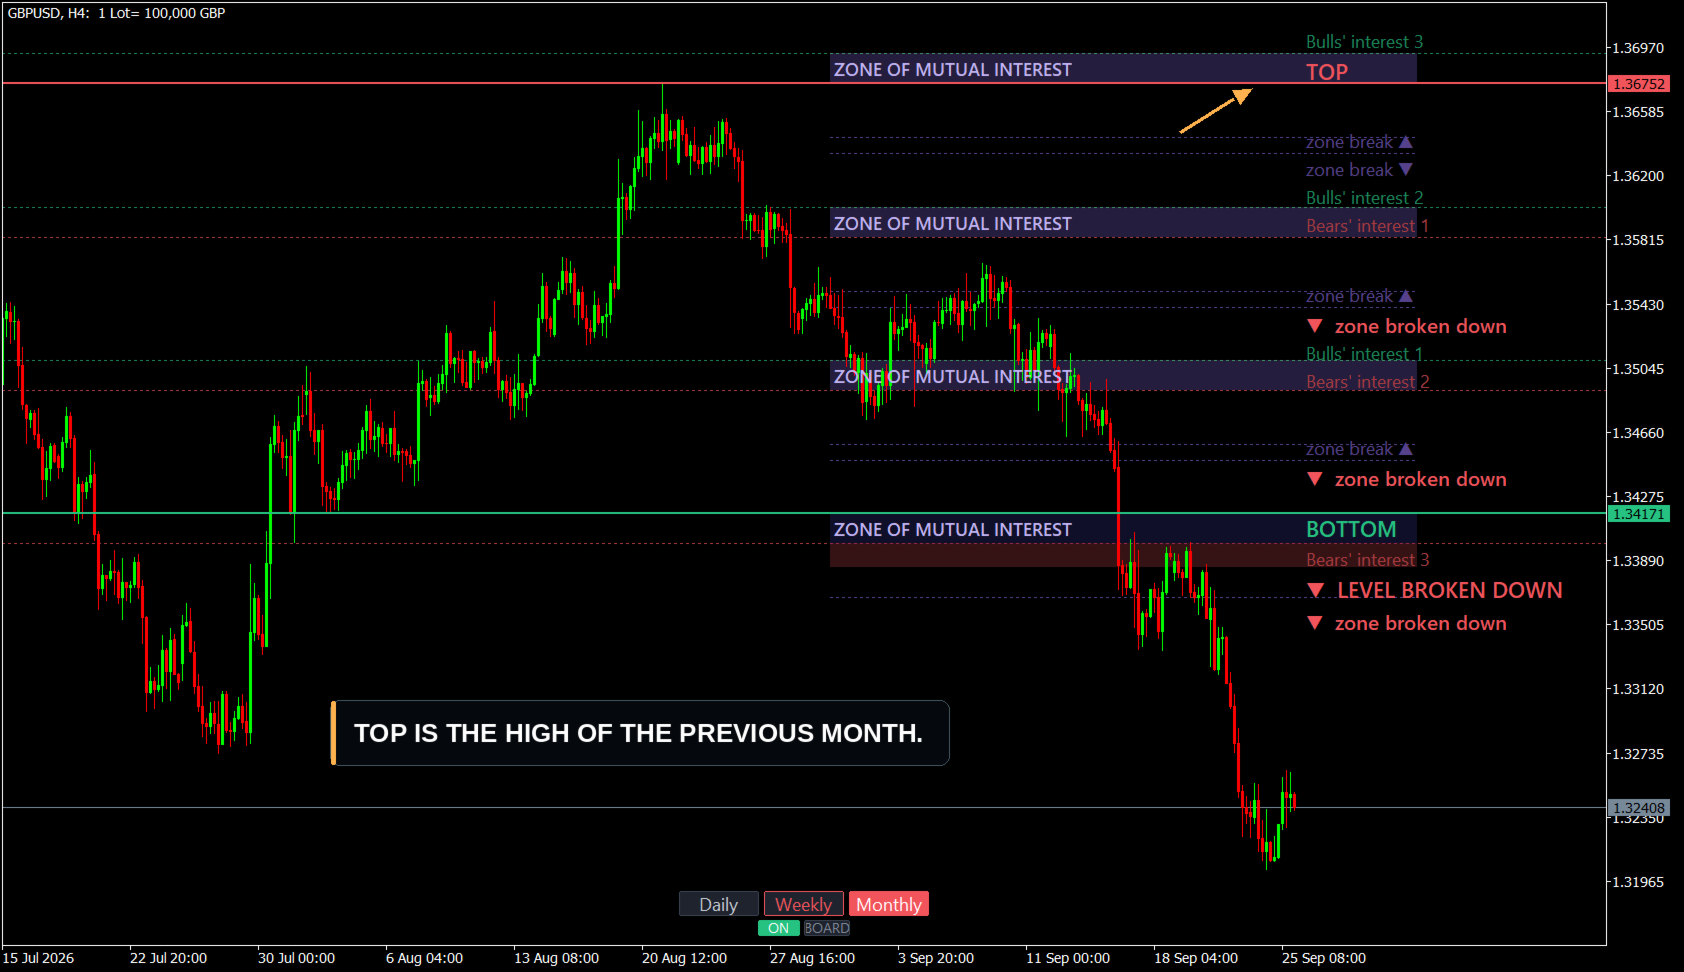
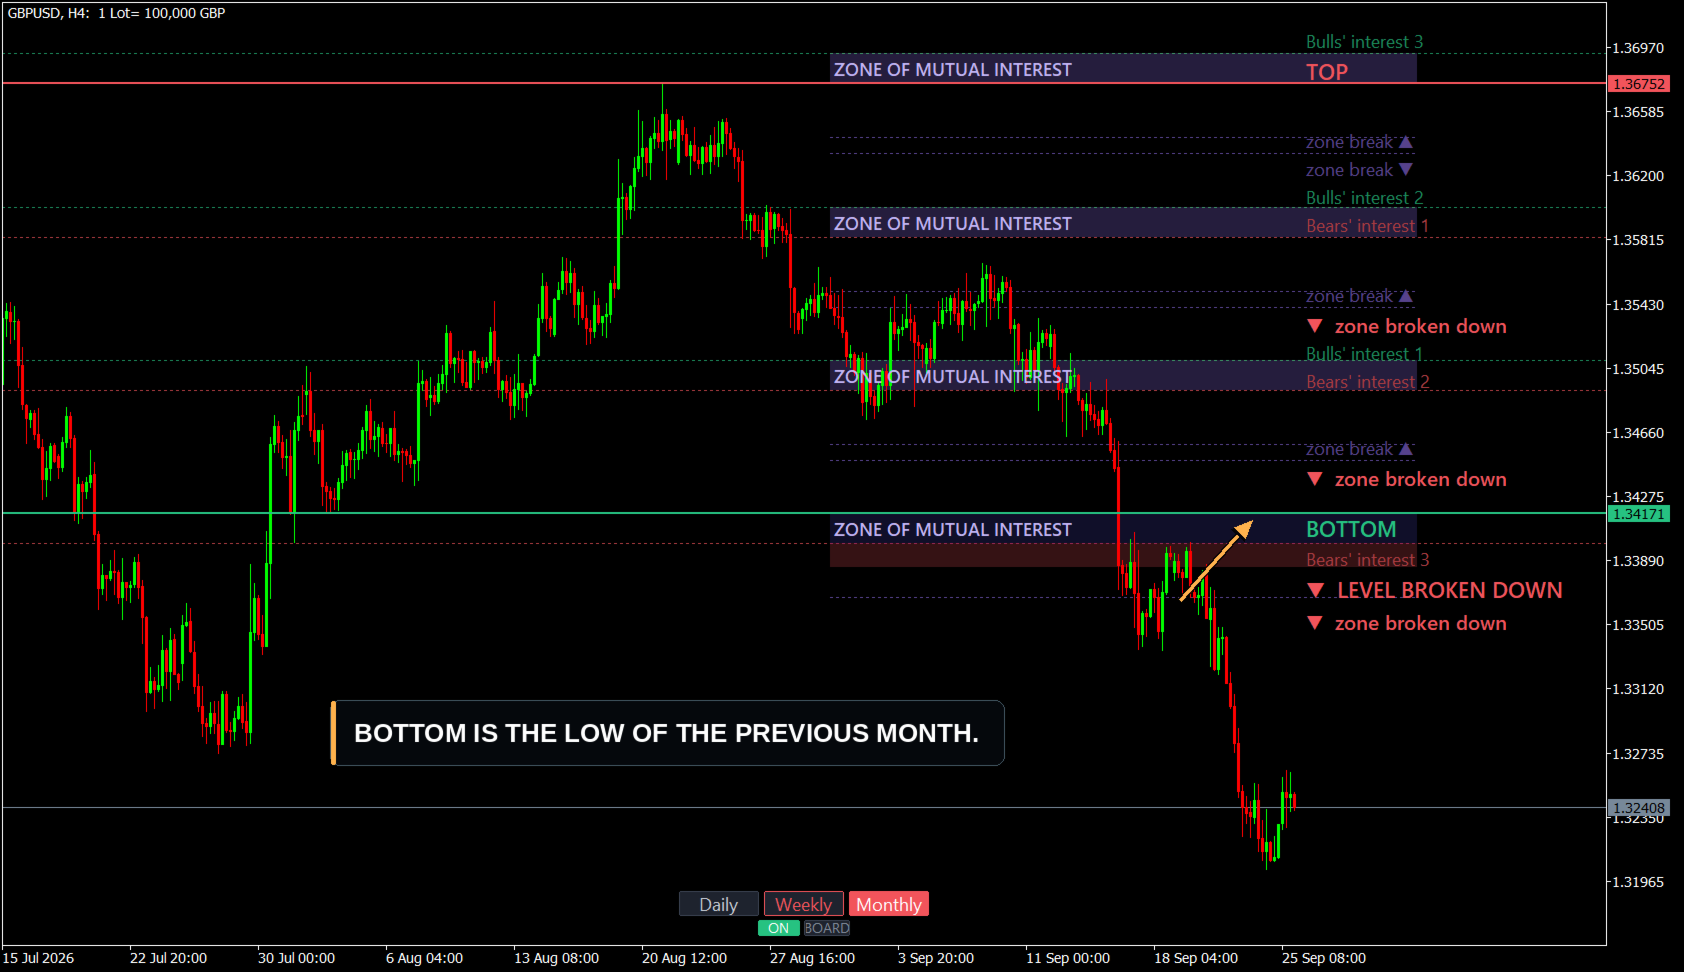
The high of the previous period becomes the TOP line and its low becomes the BOTTOM line. From TOP the indicator measures three bearish targets downwards (Bears' interest 1, 2 and 3), and from BOTTOM three bullish targets upwards (Bulls' interest 1, 2 and 3), using Gann's square-root steps of 1/8, 2/8 and 3/8.
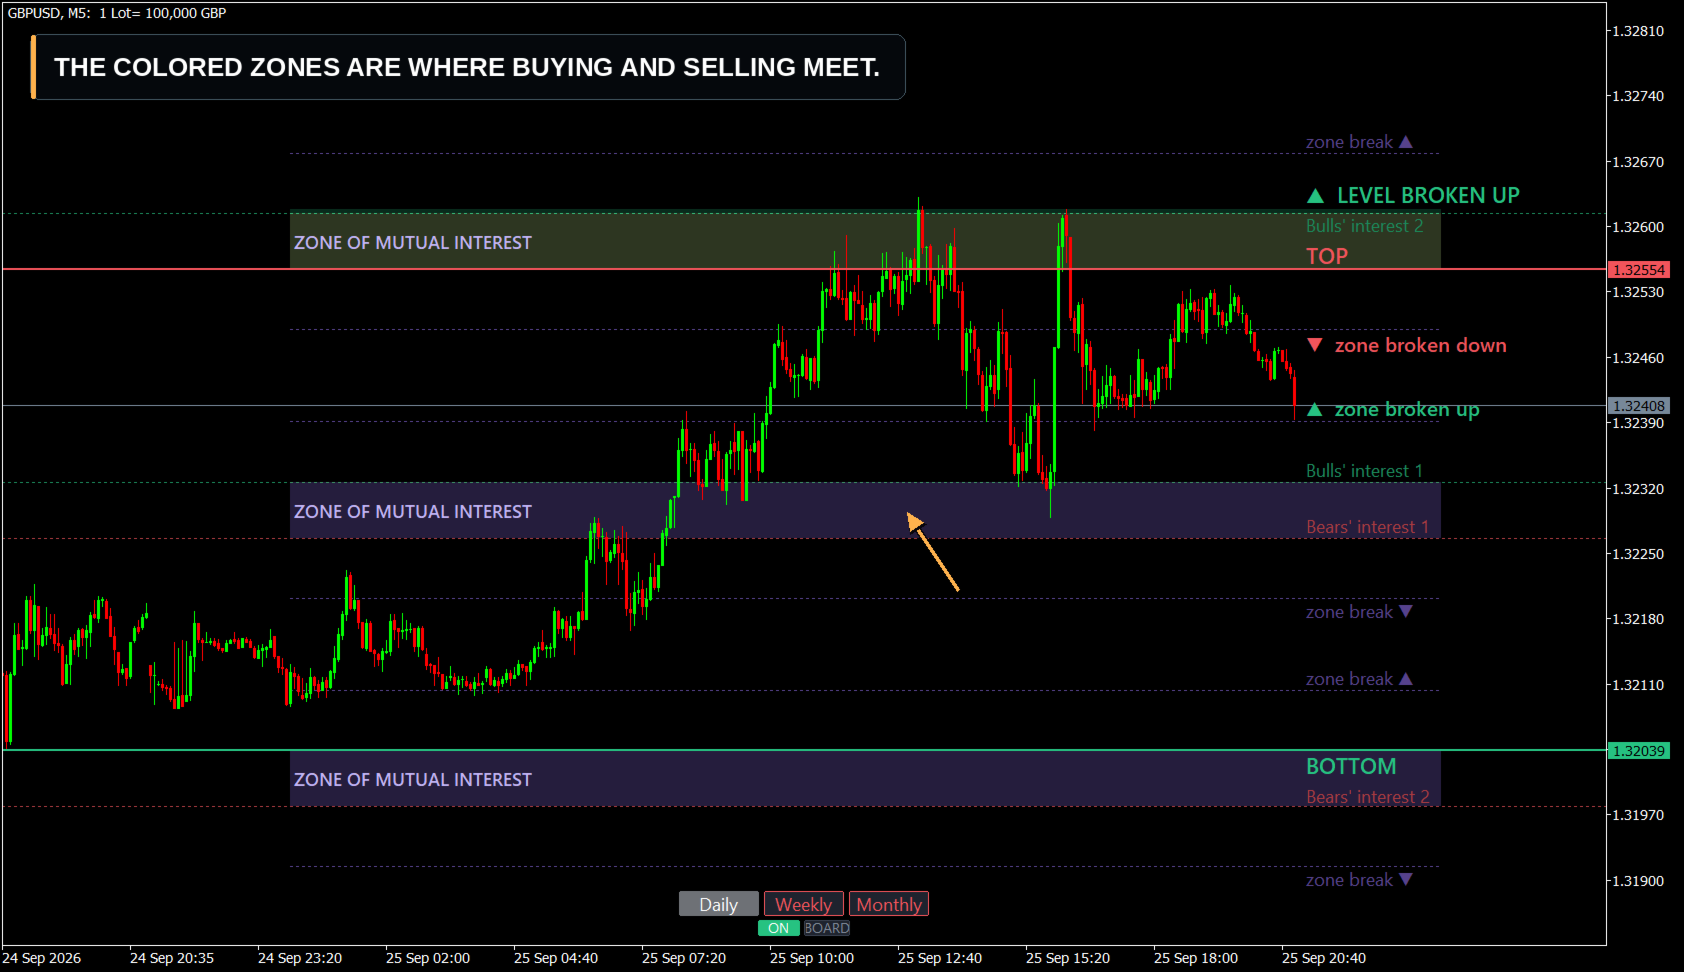
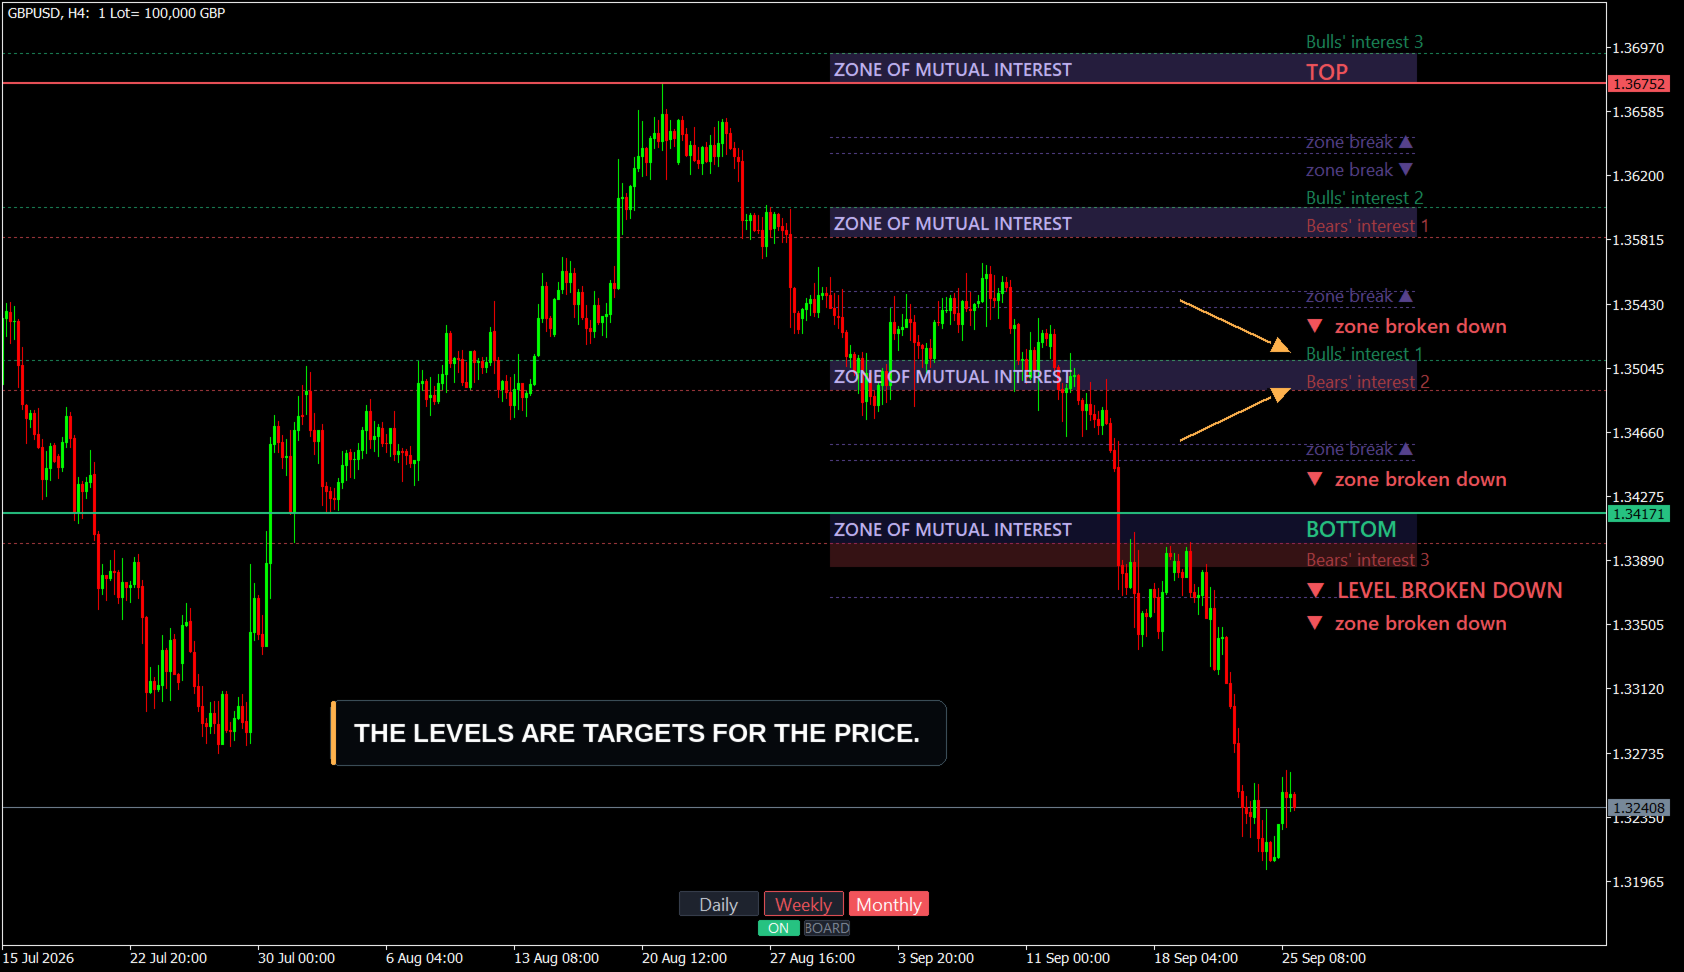
Gann calculations always need a scale. GANN Master chooses it by itself: it tries every scale and keeps the one at which the bullish and bearish lines come closest to each other. Where a bearish line and a bullish line are close, the interests of both sides meet. The indicator shades these places as zones of mutual interest. Up to five zones are drawn for the period.
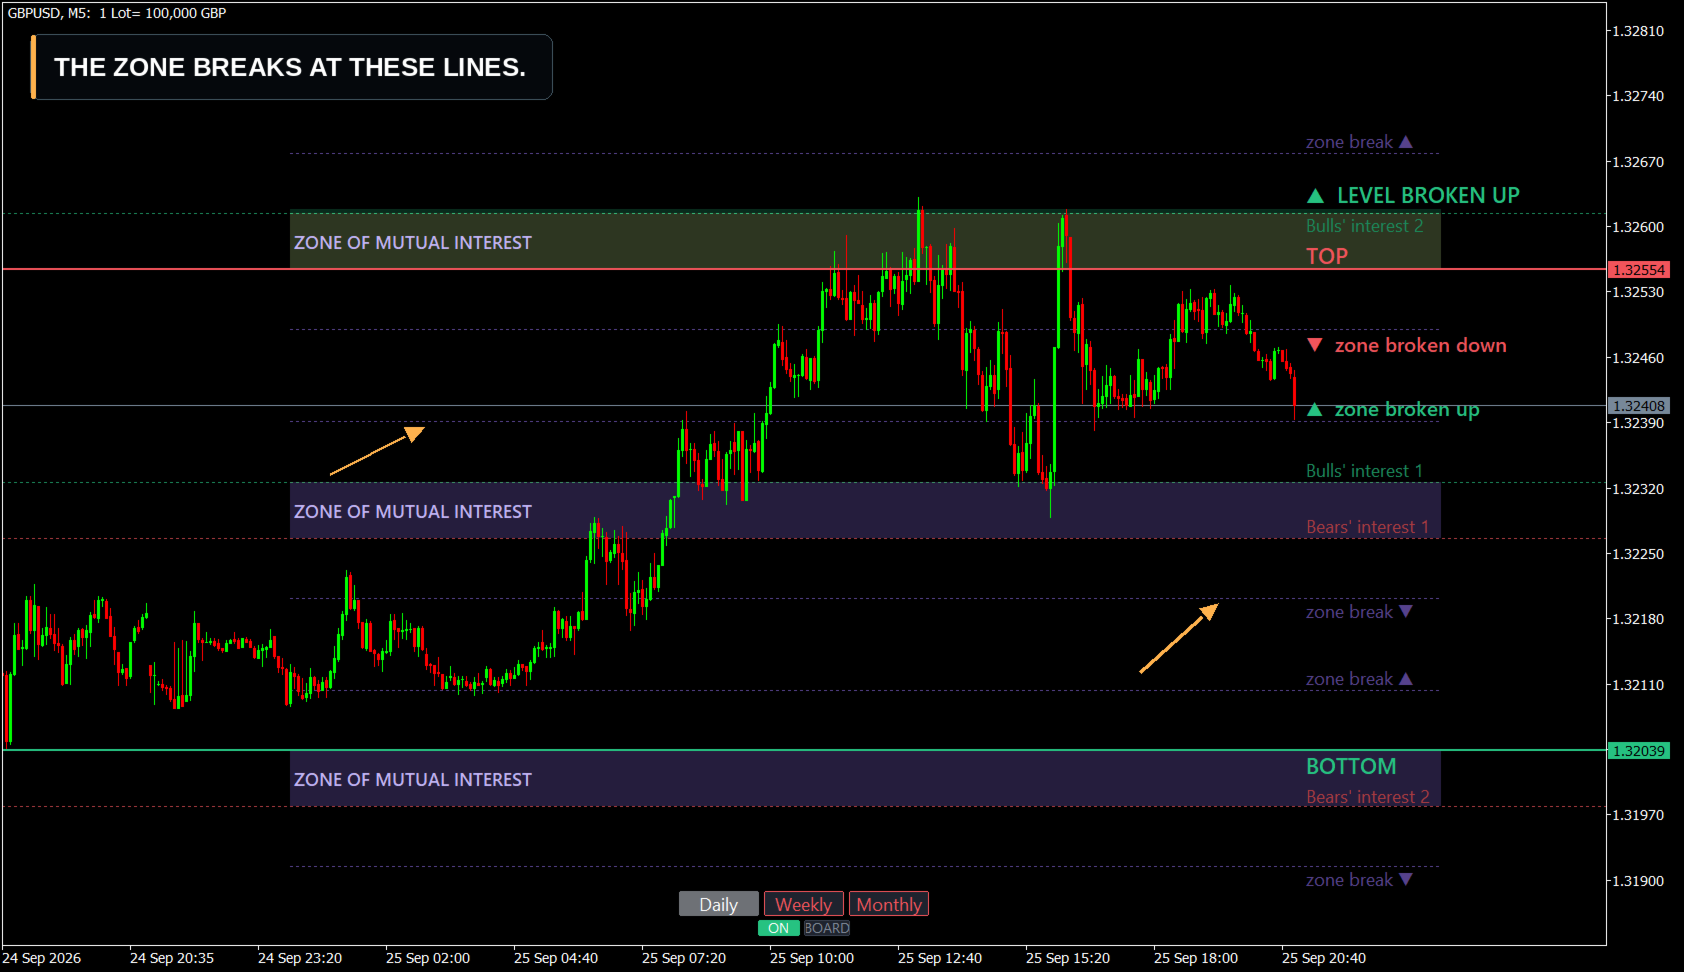
Around every zone there are two dotted zone-break lines, 1/8 of the TOP-BOTTOM range above and below it. Around TOP and BOTTOM there is a shaded band of the same size.
What you see on the chart
- TOP and BOTTOM, the six Gann lines and their names, to the right of the current candle
- The zones of mutual interest over the running day, week or month
- The zone-break lines, marked "zone break" until a break happens
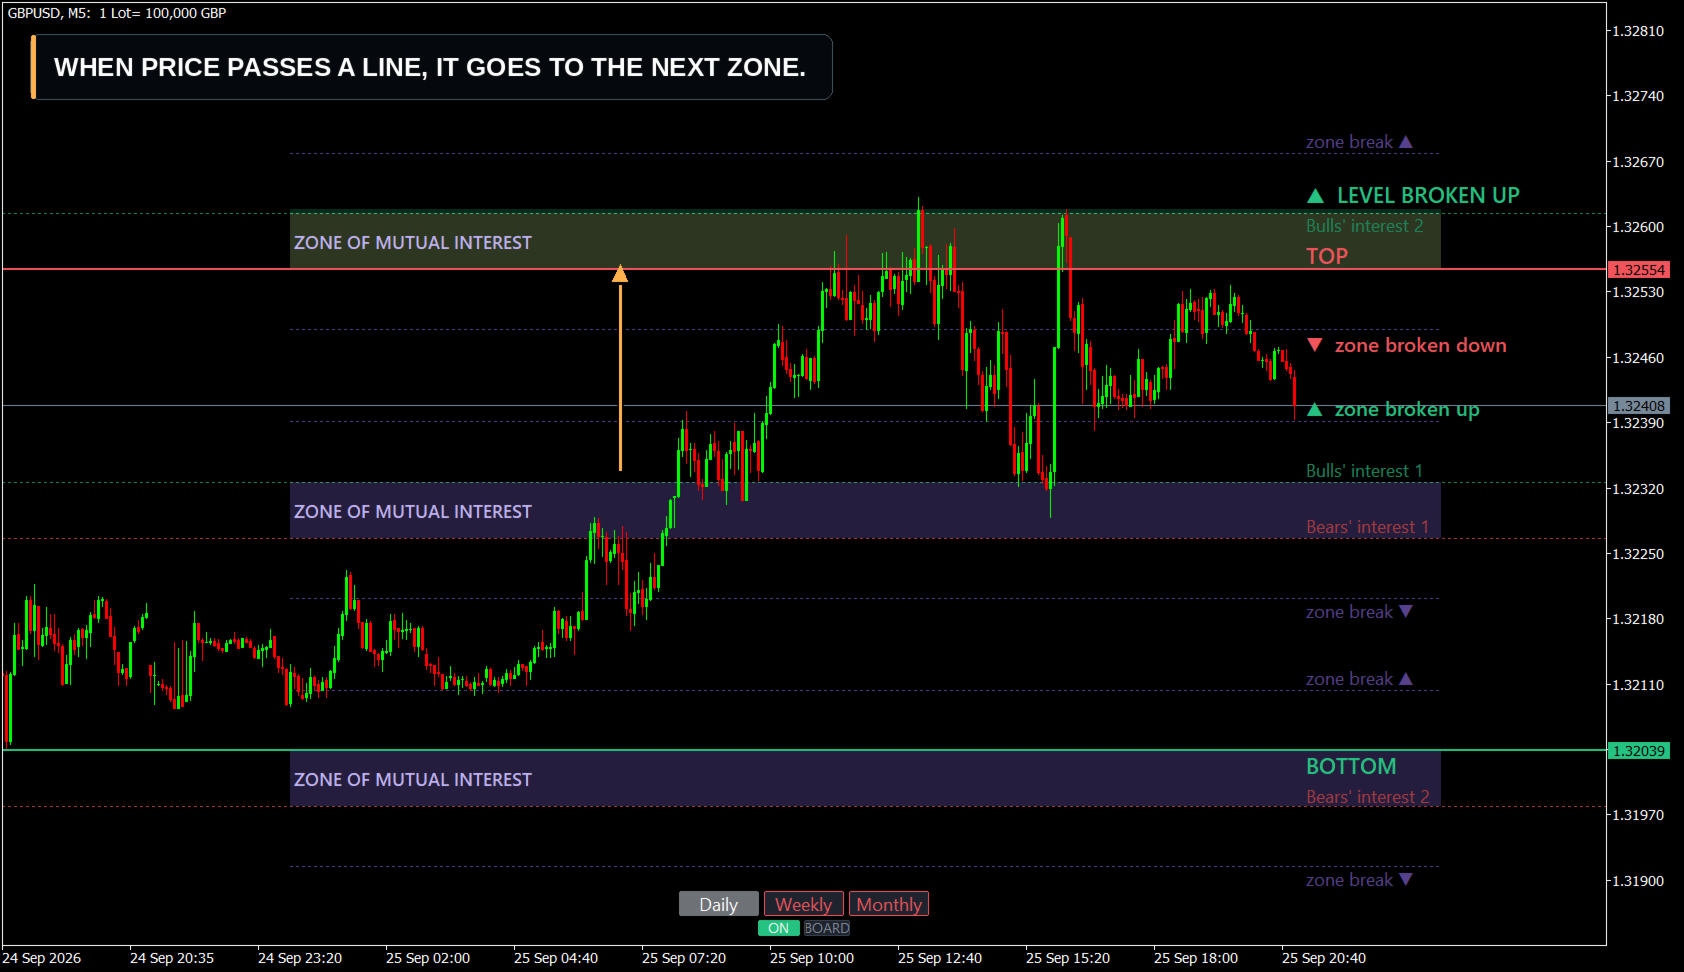
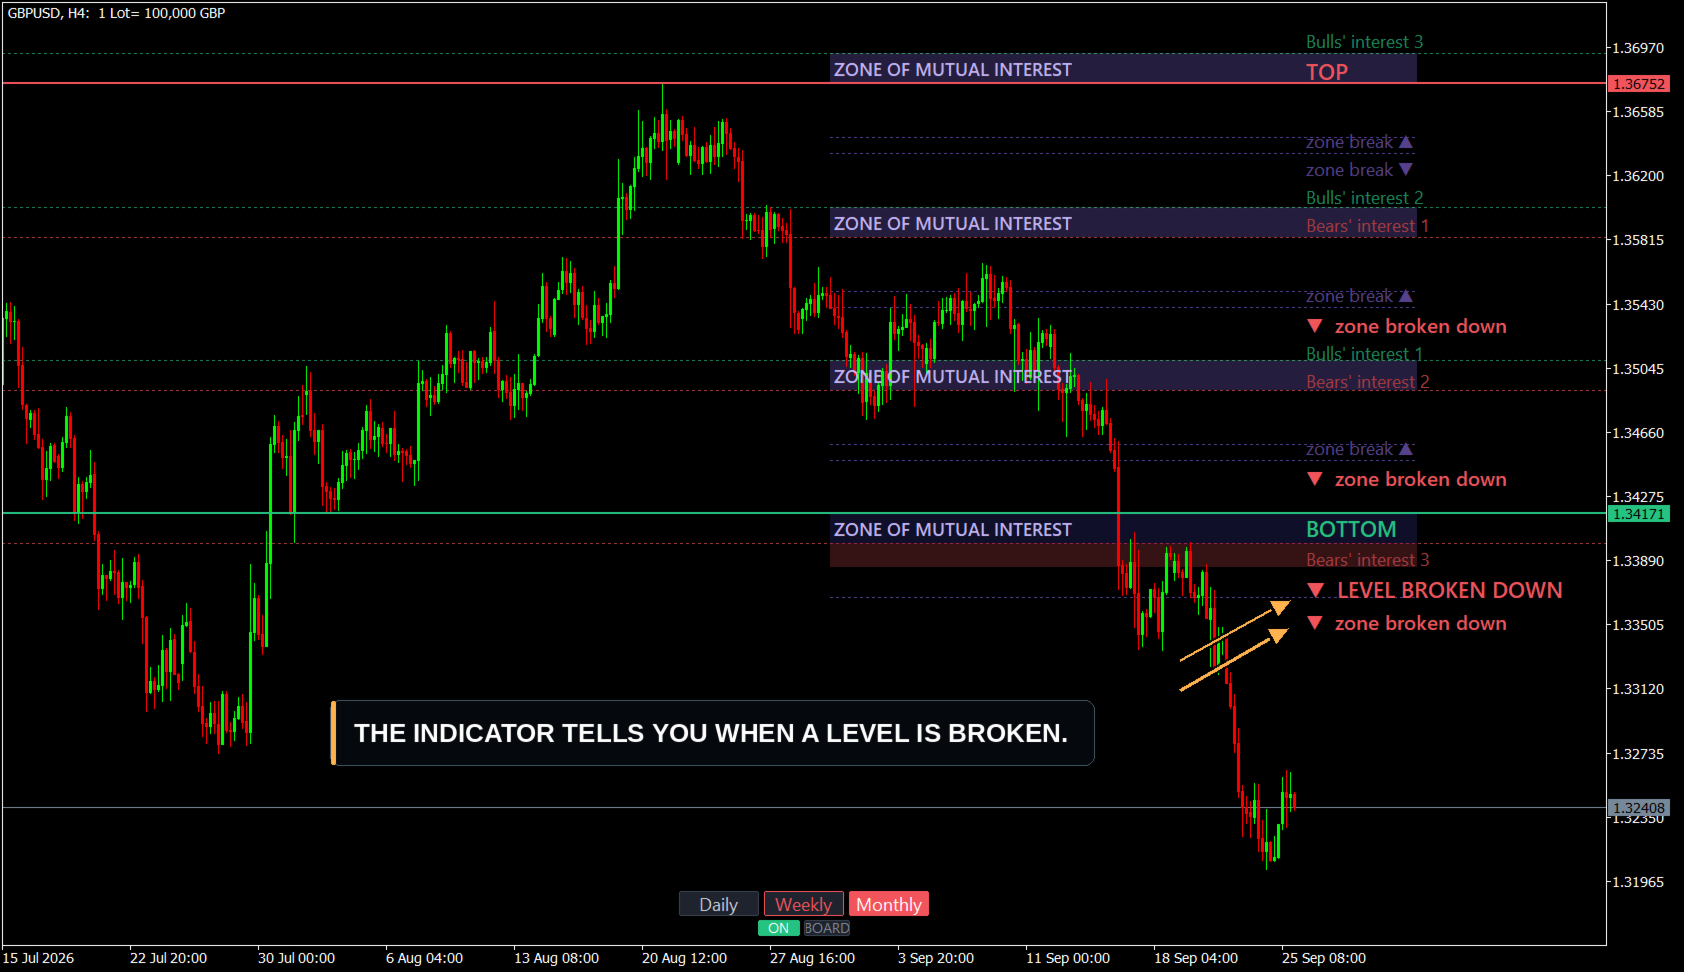
- "zone broken up" or "zone broken down" when a full candle has closed beyond a zone-break line after price came from the other side. A wick through the line is not counted as a break.
- "LEVEL BROKEN UP" or "LEVEL BROKEN DOWN" when price has gone through the band around TOP or BOTTOM
The breaks are read from the candles of the running period. They remain on the chart after a reload, after a timeframe change and after a restart of the terminal.
The buttons
The buttons are at the bottom of the chart, in the centre.
- Daily builds today's levels from yesterday's high and low and switches the chart to M5.
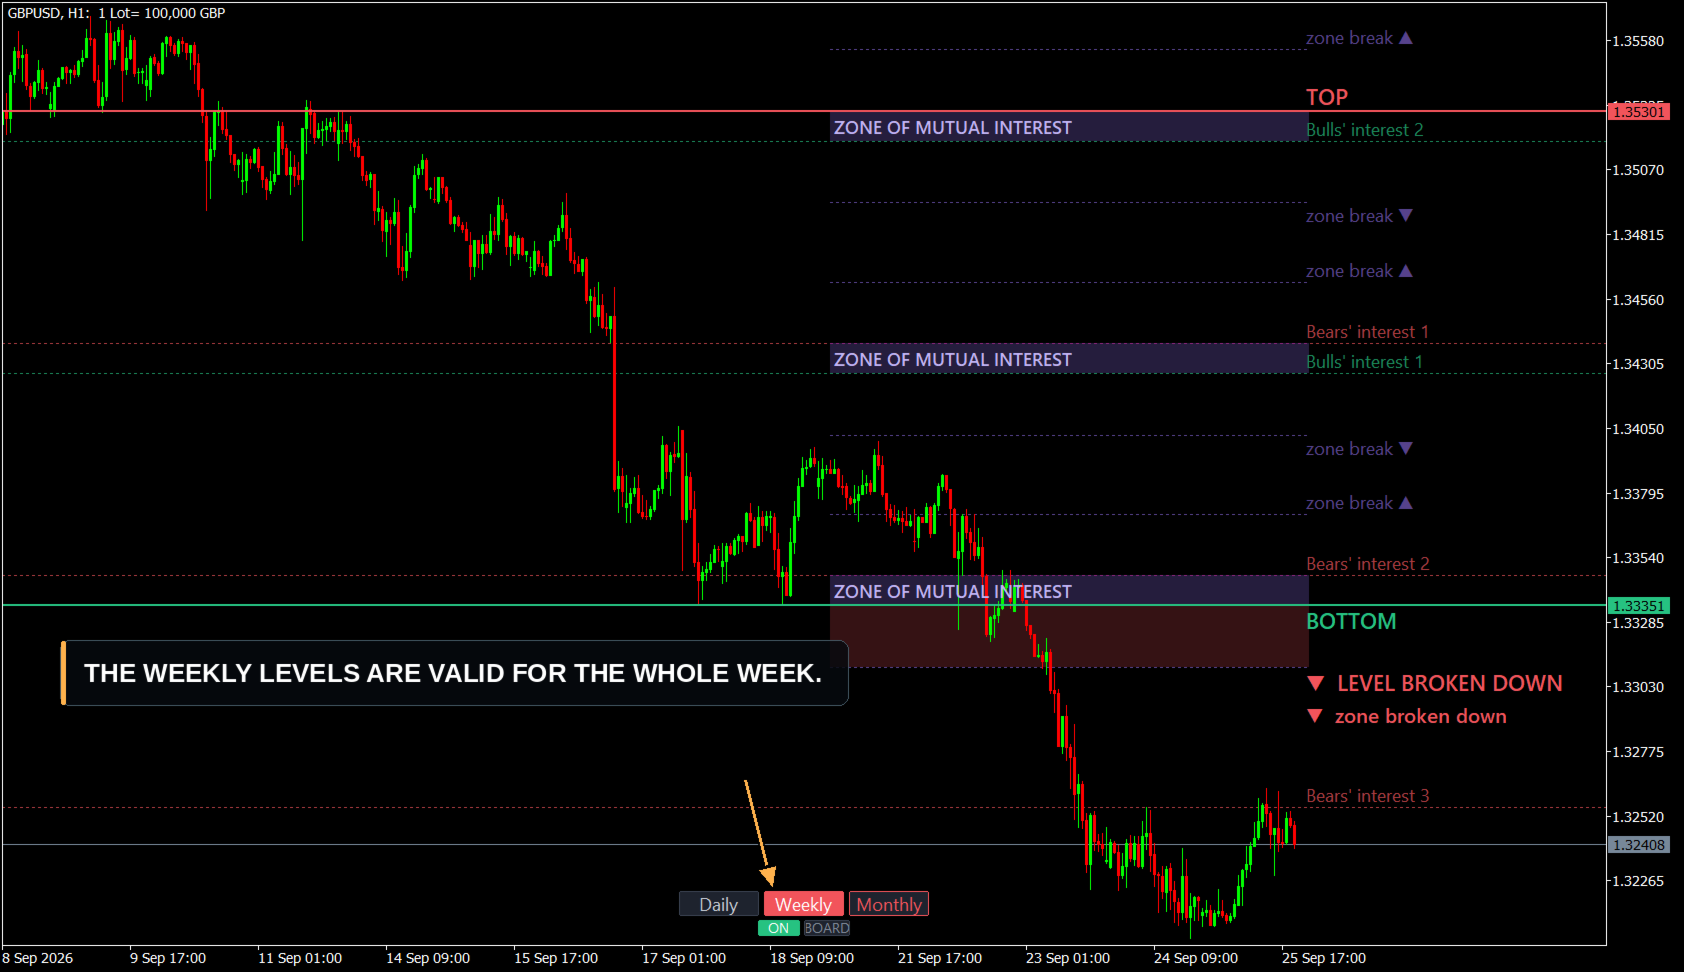
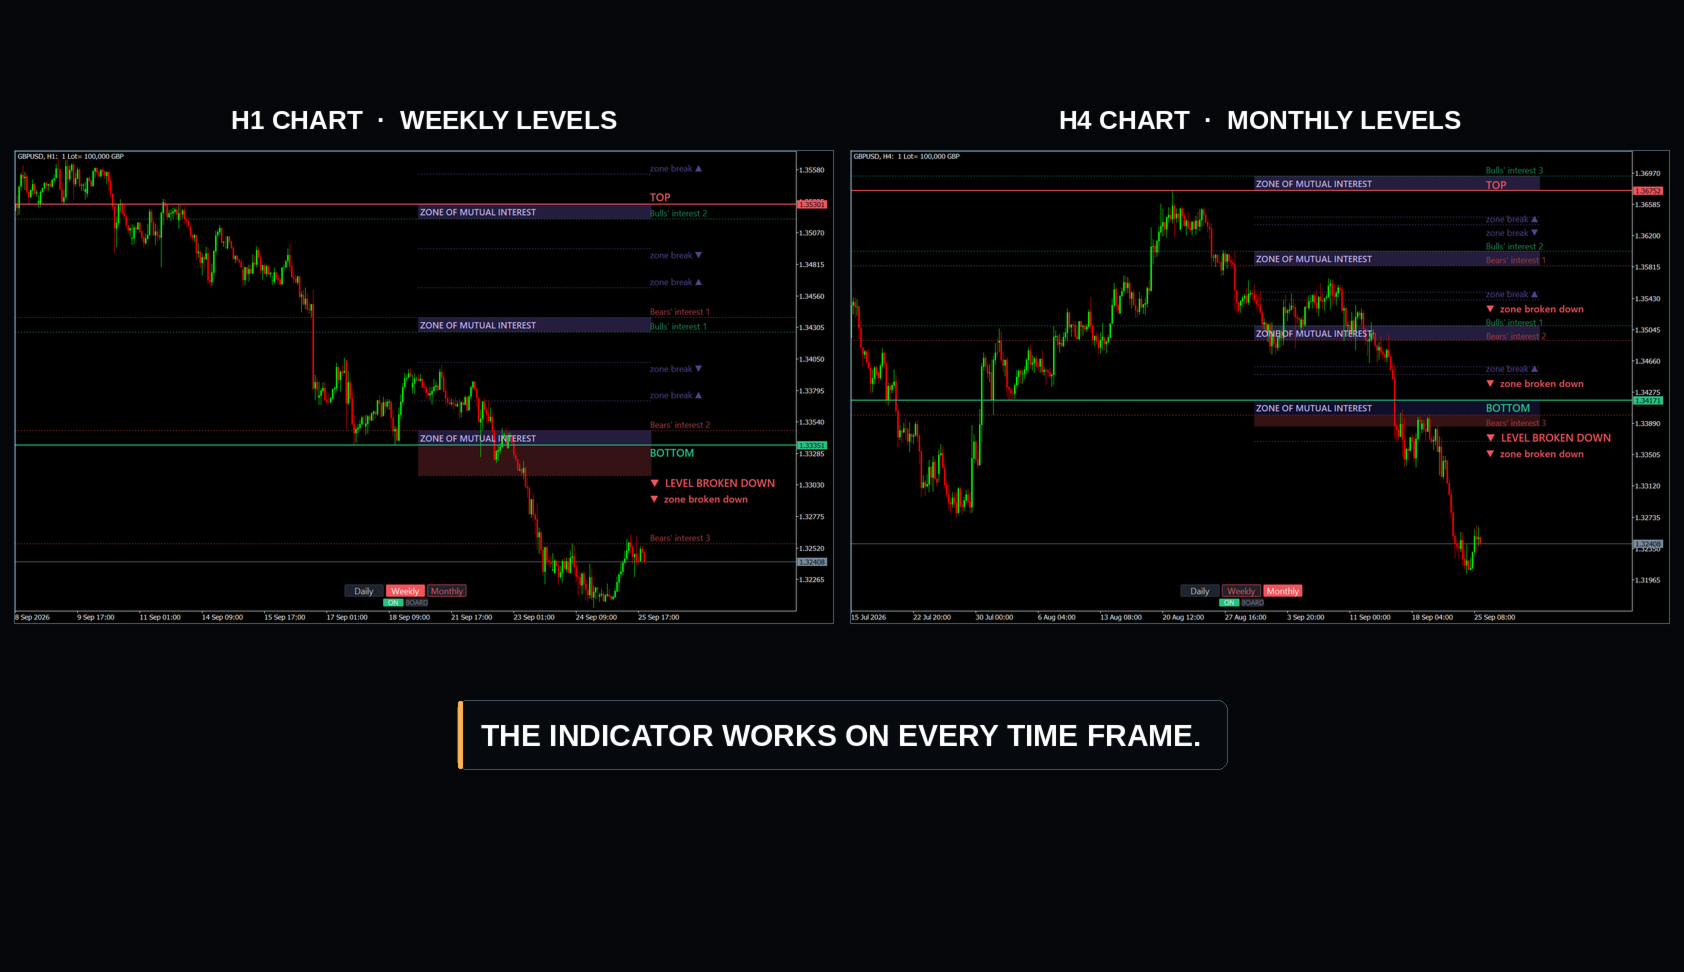
- Weekly builds this week's levels from last week and switches to H1.
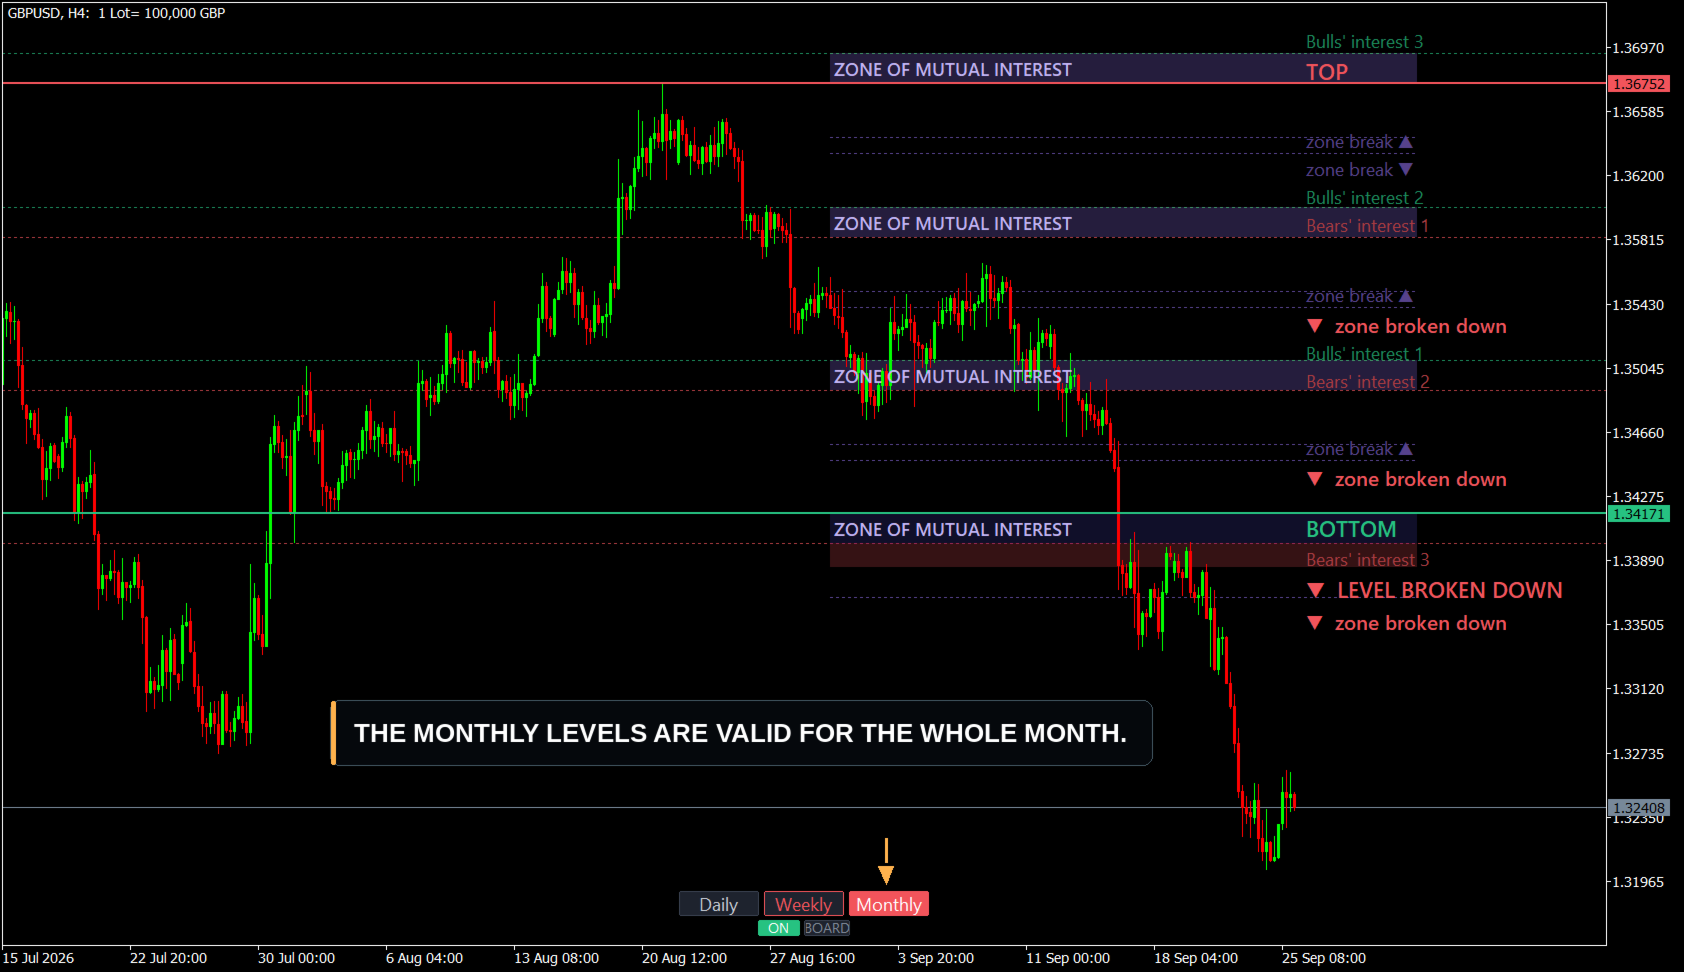
- Monthly builds this month's levels from last month and switches to H4.
The levels themselves are valid on every timeframe.
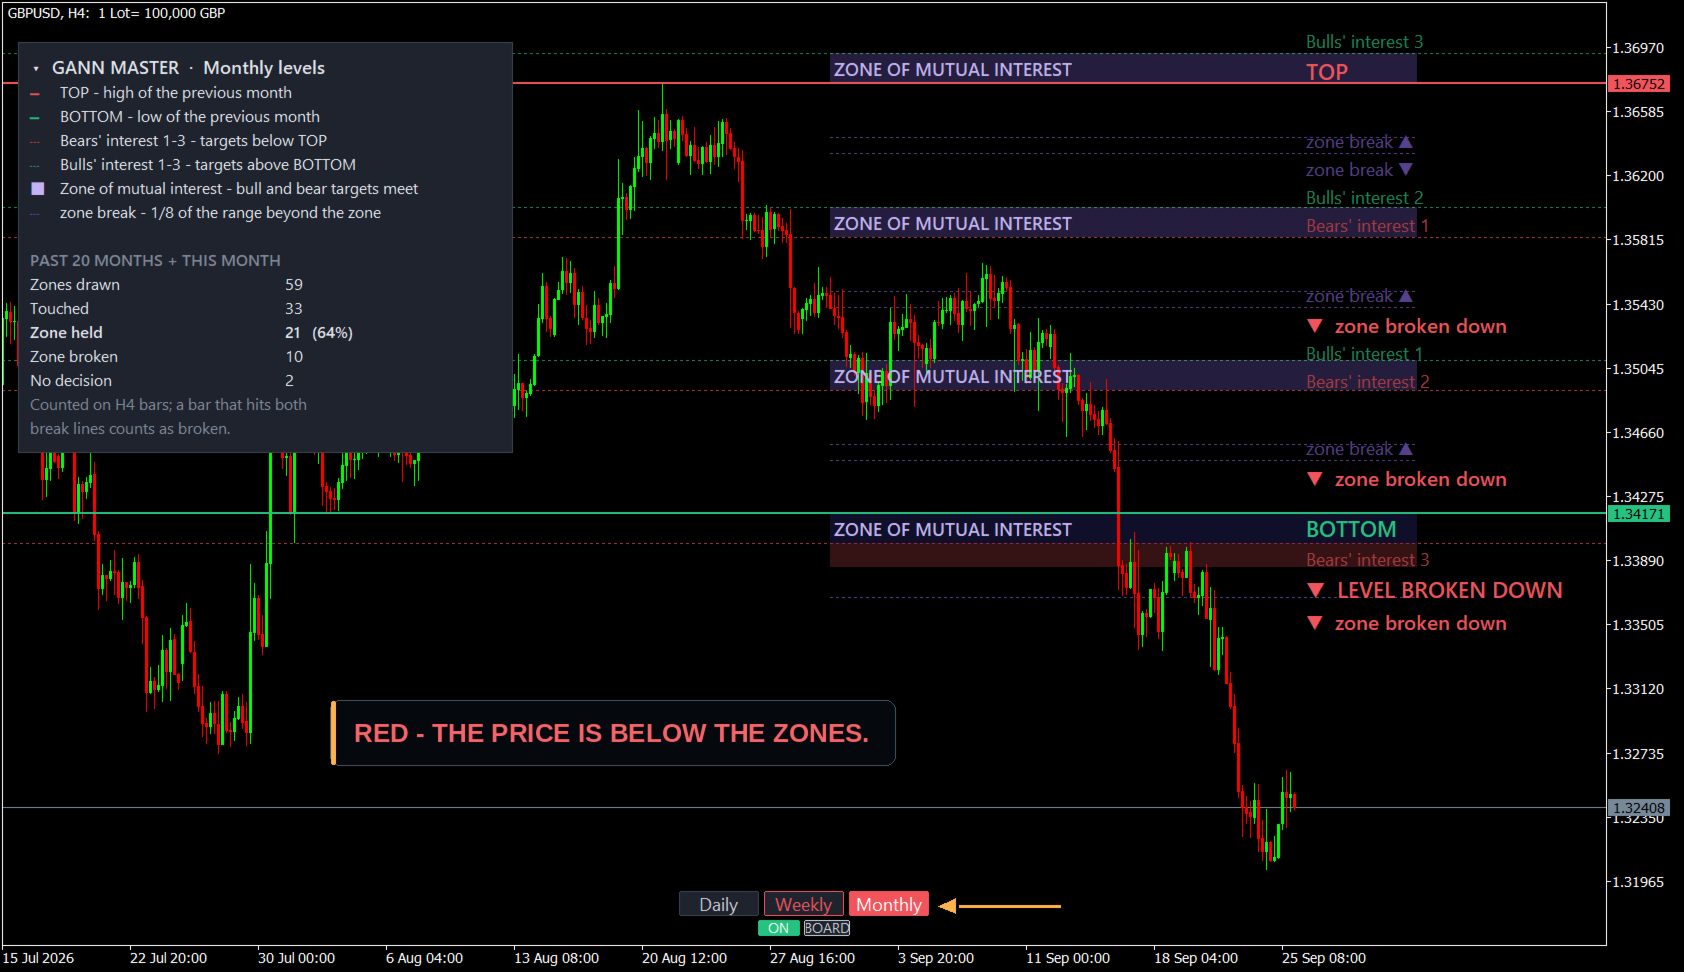
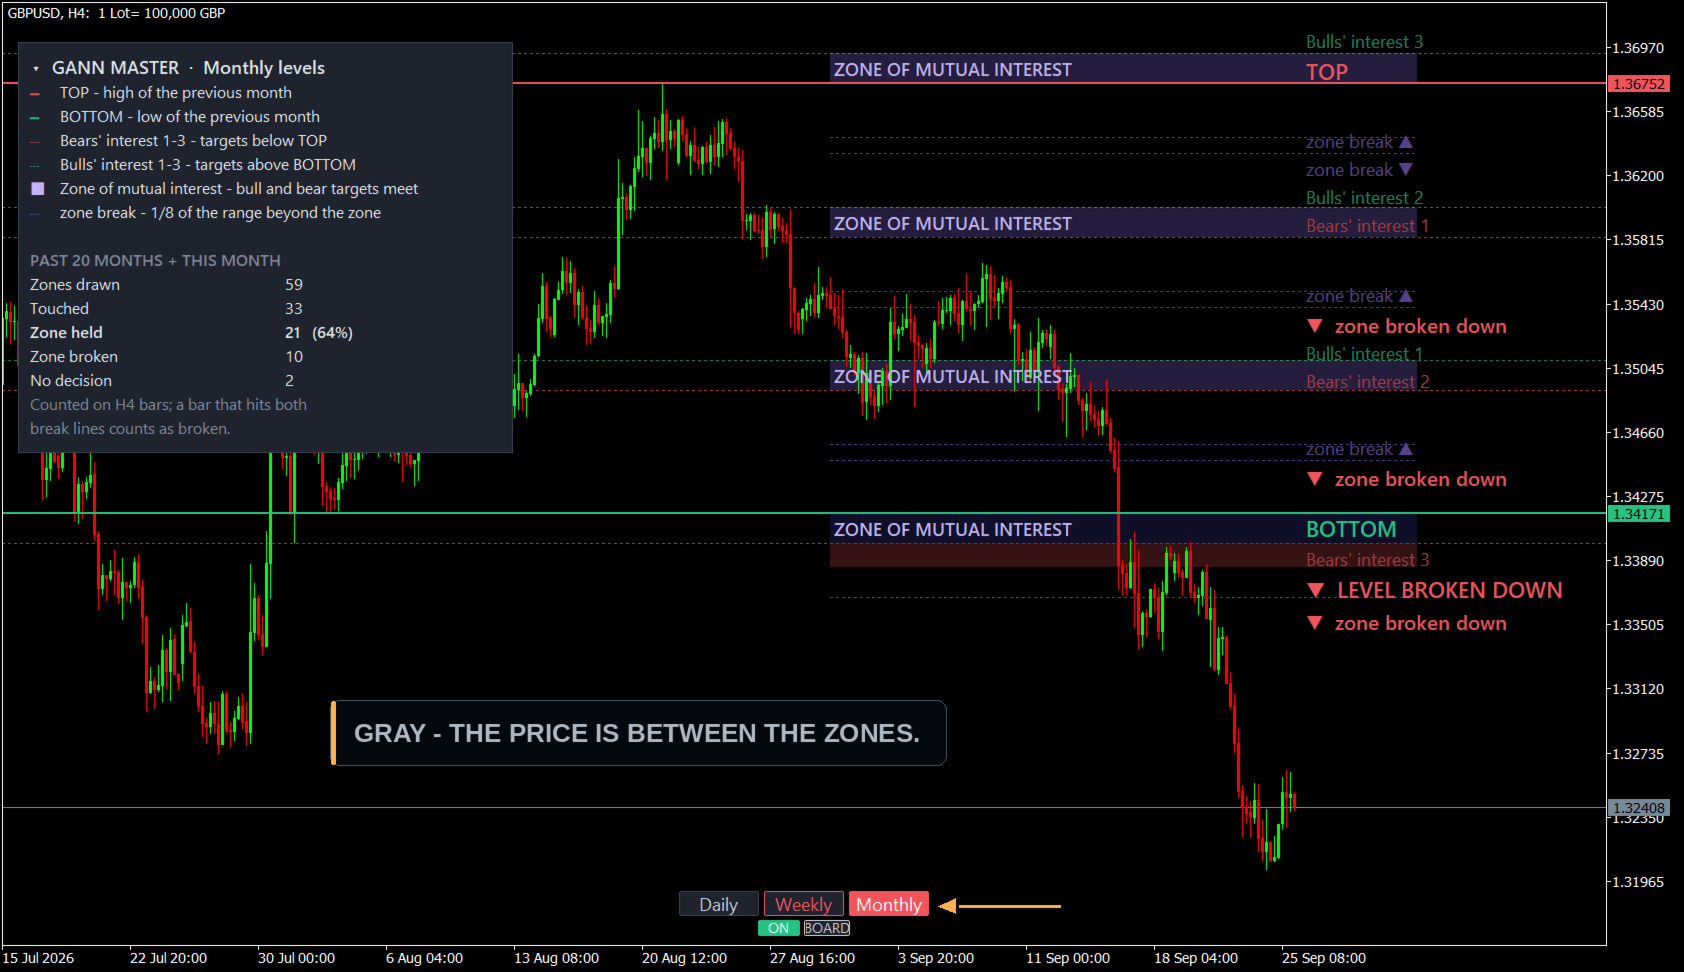
The colour of each button shows where price is in relation to that button's previous period. Green means price is above the previous period's high, red means it is below the previous period's low, and grey means price is inside that range. Hold the mouse over a button to see the exact level. With the three buttons you can see at a glance whether the day, the week and the month point the same way.
ON shows or hides all levels. BOARD shows or hides the statistics board.
The statistics board
The board counts, over the past periods, how many zones were drawn, how many were touched, how often price turned back from a zone and how often it went through it. It helps you judge how the zones behave on the symbol you trade. It is hidden by default.
Weekends and 24/7 markets
On Saturday and Sunday the chart stays exactly as it was on Friday, and the new levels appear with the first quote on Monday. Symbols that trade at the weekend, such as cryptocurrencies, are recognised automatically, and every day is counted for them.
Trading examples
The examples below show one way of reading the levels. They describe how a trader can plan an entry and a target. They are not a promise of any result, and every trade should be managed with your own risk rules.
Example 1. A sell after a bearish break. Price falls through the bearish line at the top of a zone and a candle closes below it. This is a bearish break. Instead of selling at once, wait for the pullback. Buyers usually defend the area just under the next zone above, which is marked by that zone's lower zone-break line. When the pullback reaches this dotted line and price turns down again, sellers can enter there. The first target is below the low that the break itself reached. The second target is the first bullish line below. Bears sell where bulls defend.
Example 2. A buy after a bullish break in the bearish area. Price has been inside a zone whose upper edge is a bearish line. Full candles then close above that line without touching it. This is a bullish break, and it happens in the bearish area, which is a place where buyers often enter. A buy can be planned right there, with the first bearish line above as the target.
Example 3. When a retrace is not a break. After a bearish break, price often climbs back above the line it has just broken. This move usually belongs to the pullback that prepares the next sell, and it is not a new bullish break by itself. A real bullish break needs price to close above the level that had to hold, which is the bullish line at the bottom of the next zone above.
Example 4. The three periods together. When Daily, Weekly and Monthly are all green, the day, the week and the month all trade above their previous highs, and buy setups on the daily levels agree with the larger picture. When they point in different directions, targets are usually smaller and a more careful approach makes sense.
Example 5. The end of the day's plan. When price reaches the highest or the lowest edge of all the zones of the period, the levels of that period have been used up. Many traders stop looking for new entries on these levels and wait for the next period's zones.
Manual mode
You can drag the TOP and BOTTOM lines to any two swing points. All Gann lines and zones are recalculated at once.
Input parameters
- Levels from: Daily, Weekly or Monthly. The mode the indicator starts with.
- Show levels (ON/OFF): whether the levels are shown when the indicator starts.
- Show past periods and their zones: draws the levels of previous periods as well. Off by default, so only the current period is shown.
- Past periods (statistics; drawn when shown): how many previous periods are counted on the statistics board, 20 by default.
- Legend and statistics panel: shows the board when the indicator starts. Off by default.
- TOP line and bearish targets: the colour of TOP and of the bearish lines.
- BOTTOM line and bullish targets: the colour of BOTTOM and of the bullish lines.
Good to know
GANN Master works on every symbol and every timeframe. It uses the daily, weekly and monthly history of the symbol. If the terminal does not have this history yet, a message on the chart explains what to do. In the Strategy Tester, choose a start date at least one period earlier than the part you want to see, so that the previous period's high and low are available.
In the Strategy Tester press the buttons to recalculate the levels.
If you have a question, please write in the comments section of the product.
















































































Fantastic indicator... helps to find objectives