Meravith Scanner
- Indicators
- Version: 1.77
- Updated: 13 July 2026
- Activations: 5

MERAVITH SCANNER provides complete liquidity map of any market. Hedge funds tool. It performs all calculations automatically using a proprietary volume-weighted average price methodology, eliminating subjective interpretation entirely.
This indicator contains features that may not supported by the MetaTrader current testing environment. If you want to check the indicator in real trading send me a message. The indicator works on all asset classes (Forex, Stocks, Indices, Commodities, Cryptocurrencies) and all timeframes from M1 to Monthly. MERAVITH identifies where institutional volume concentrates and derives mathematically precise price levels from that concentration. It does not predict or speculate. It calculates.
Meravith blog here:
With MERAVITH SCANNER, you can scan all 28 major Forex pairs across every timeframe in just 14 min.
Тhe indicator derives exhaustion levels, the equilibrium line, deviations, statistical levels, support and target projections.
Chart Elements
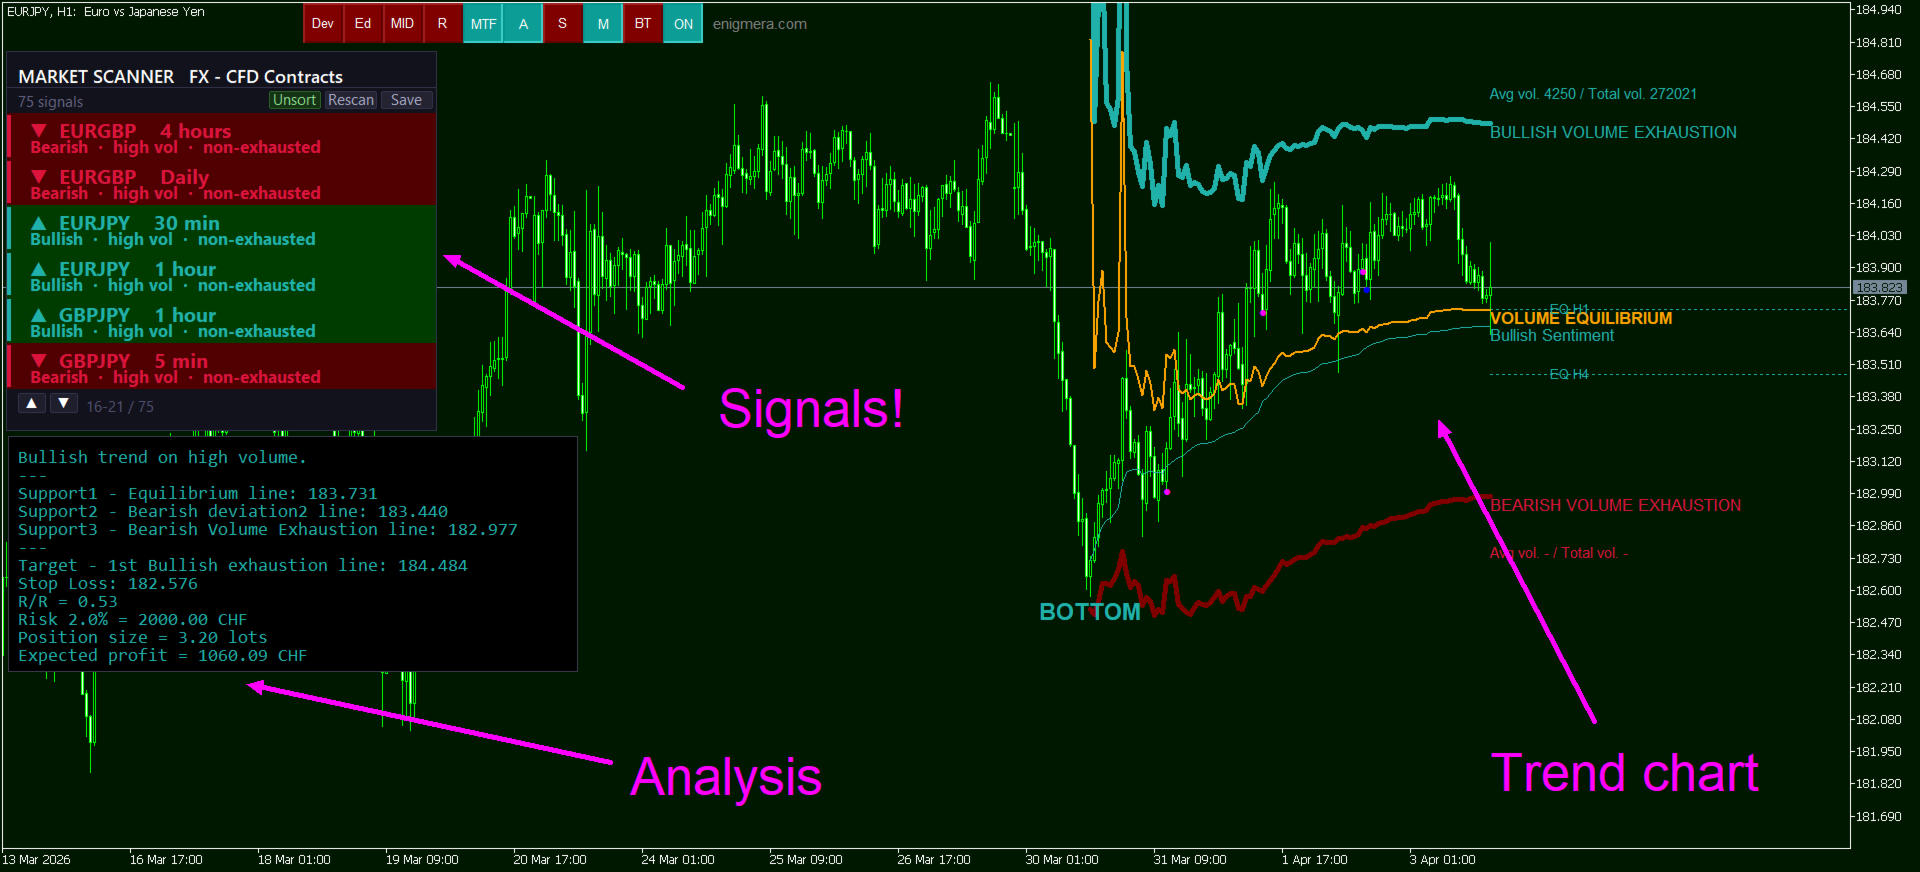
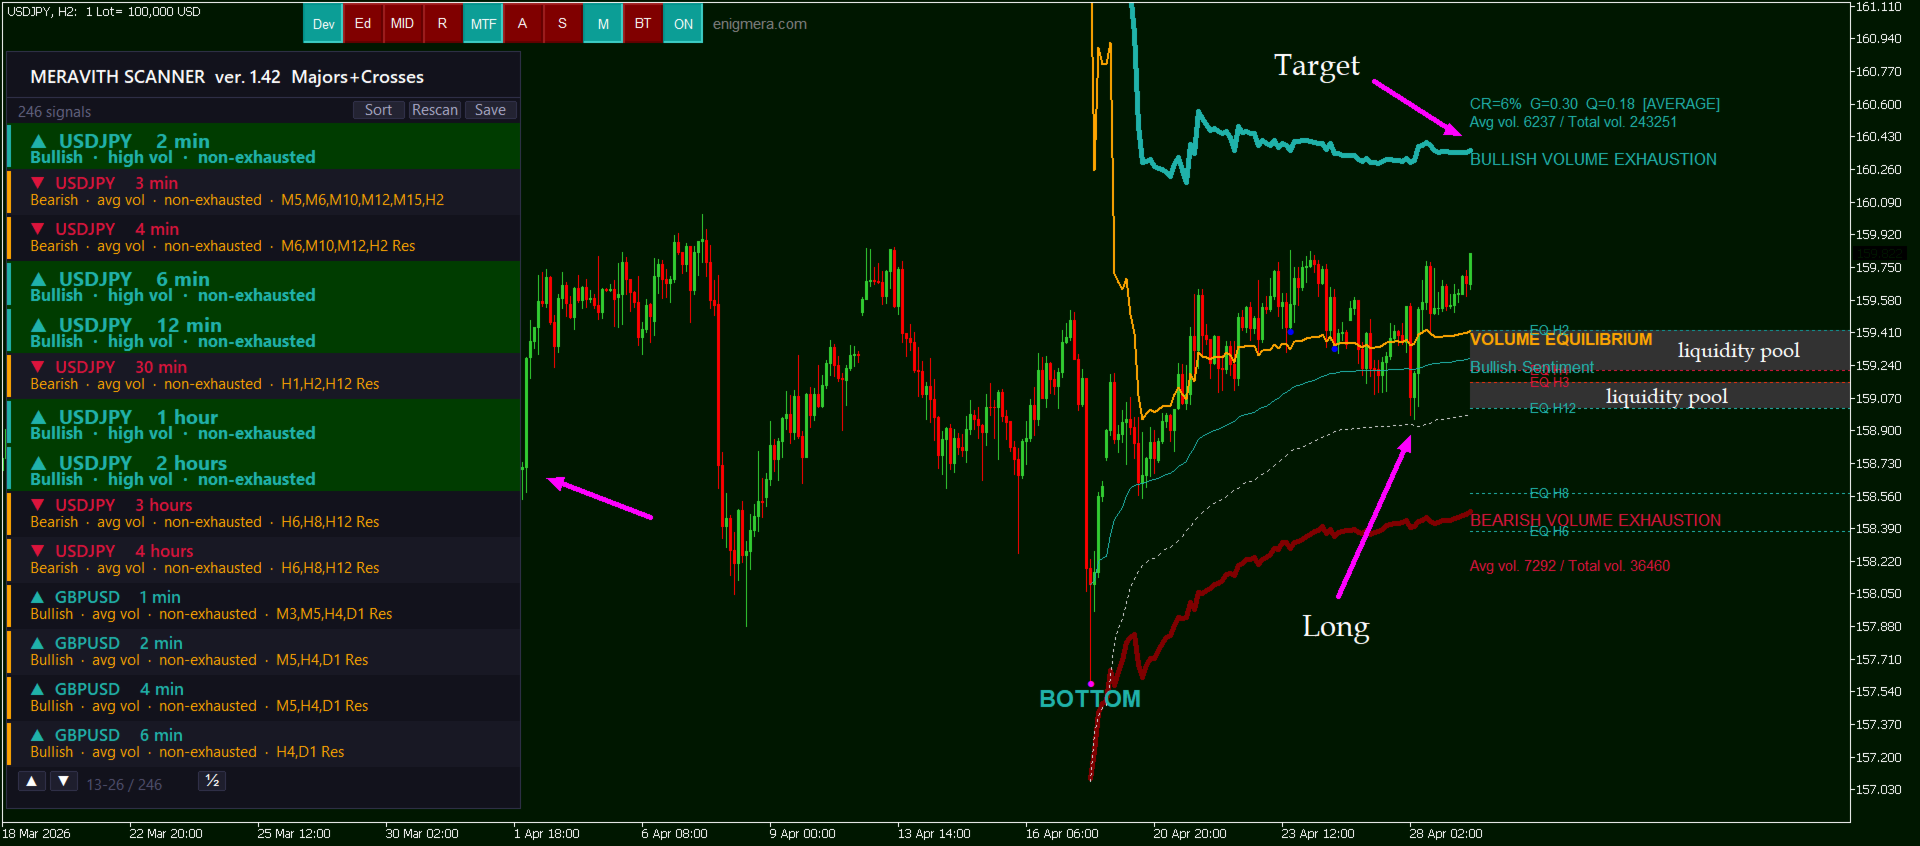
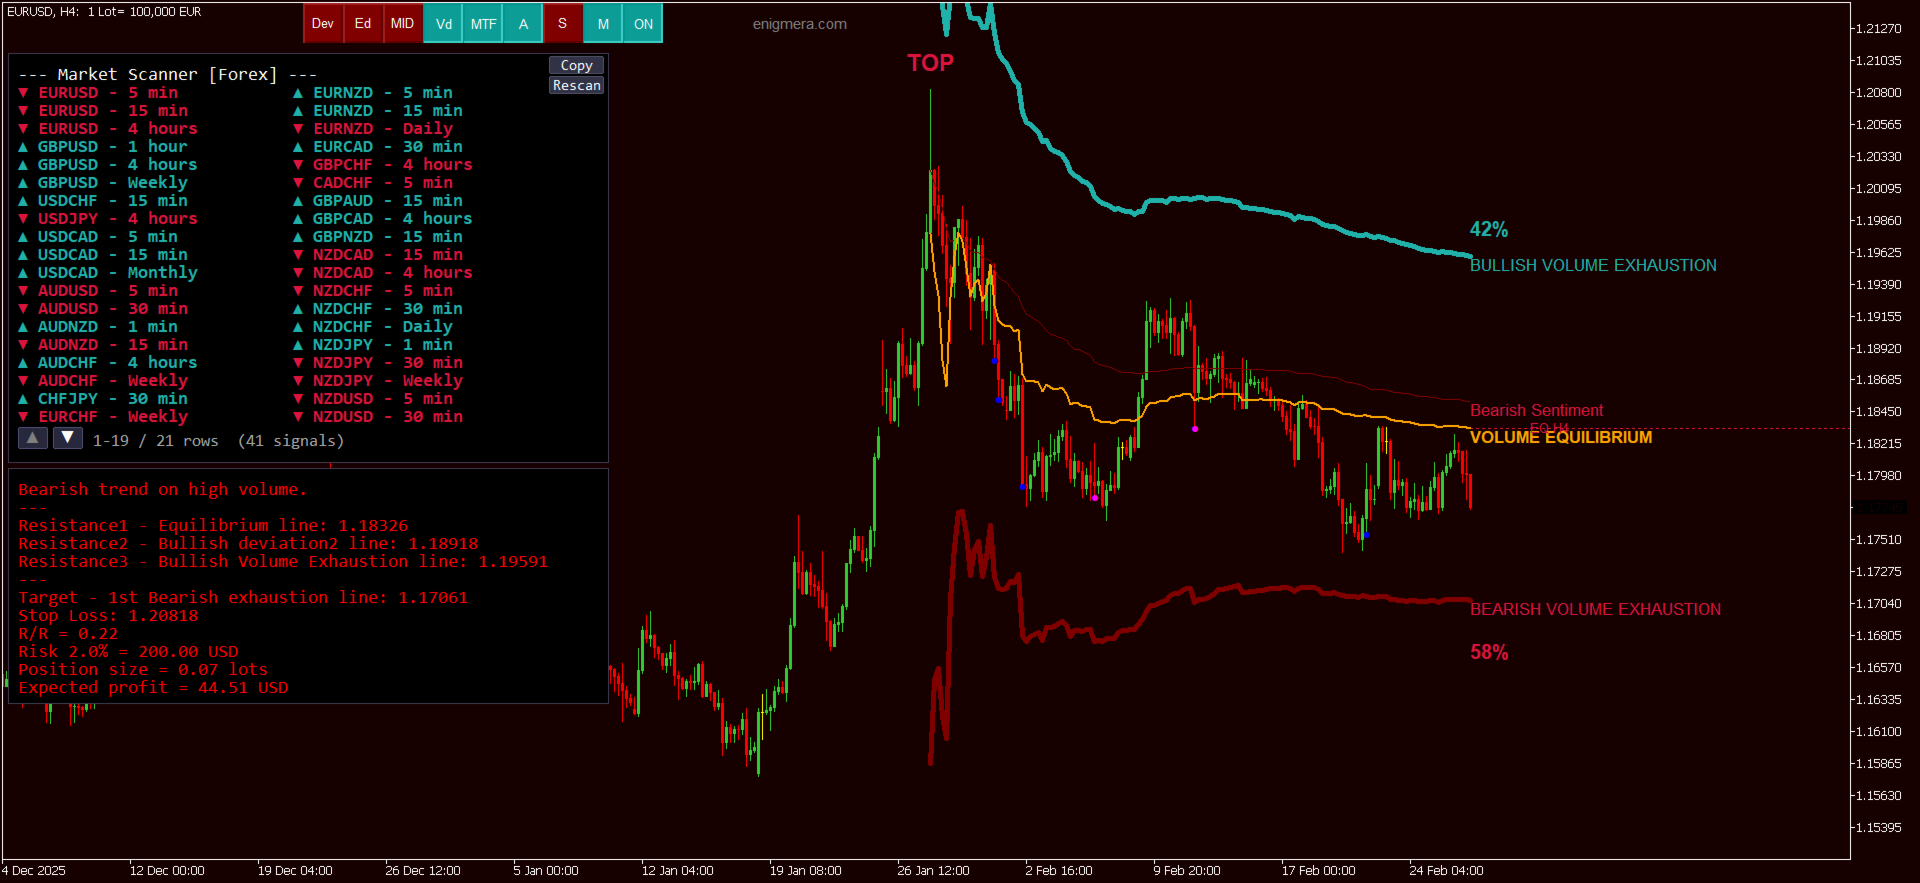
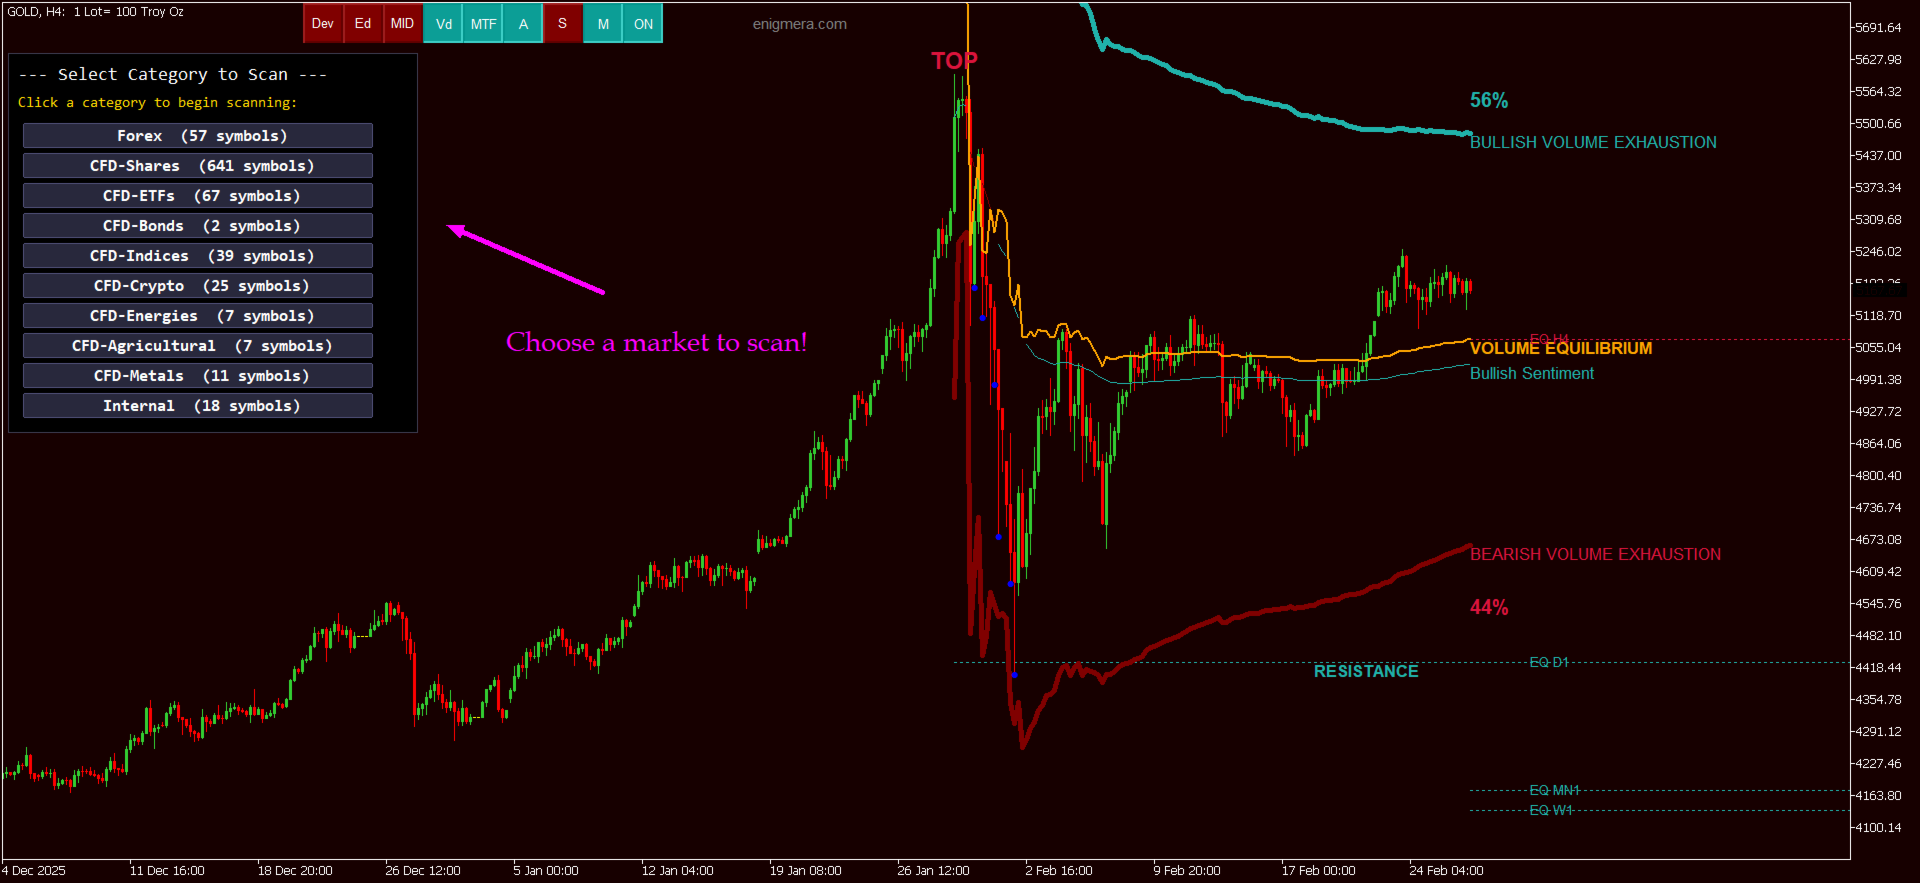
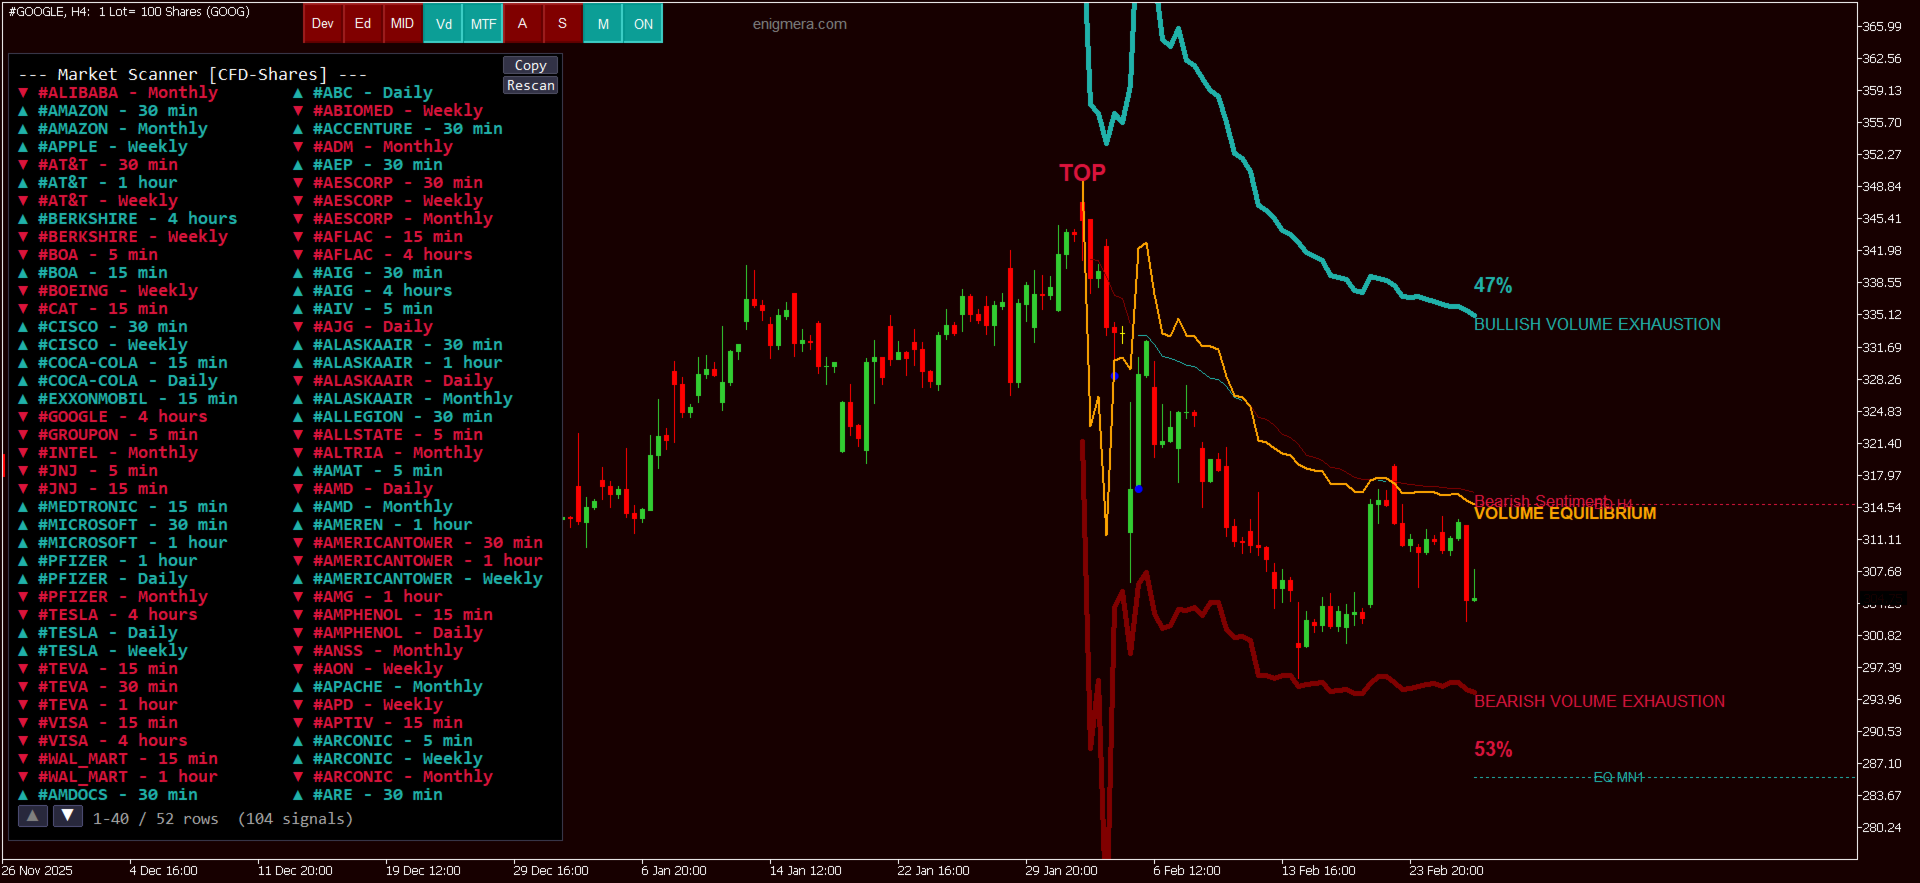
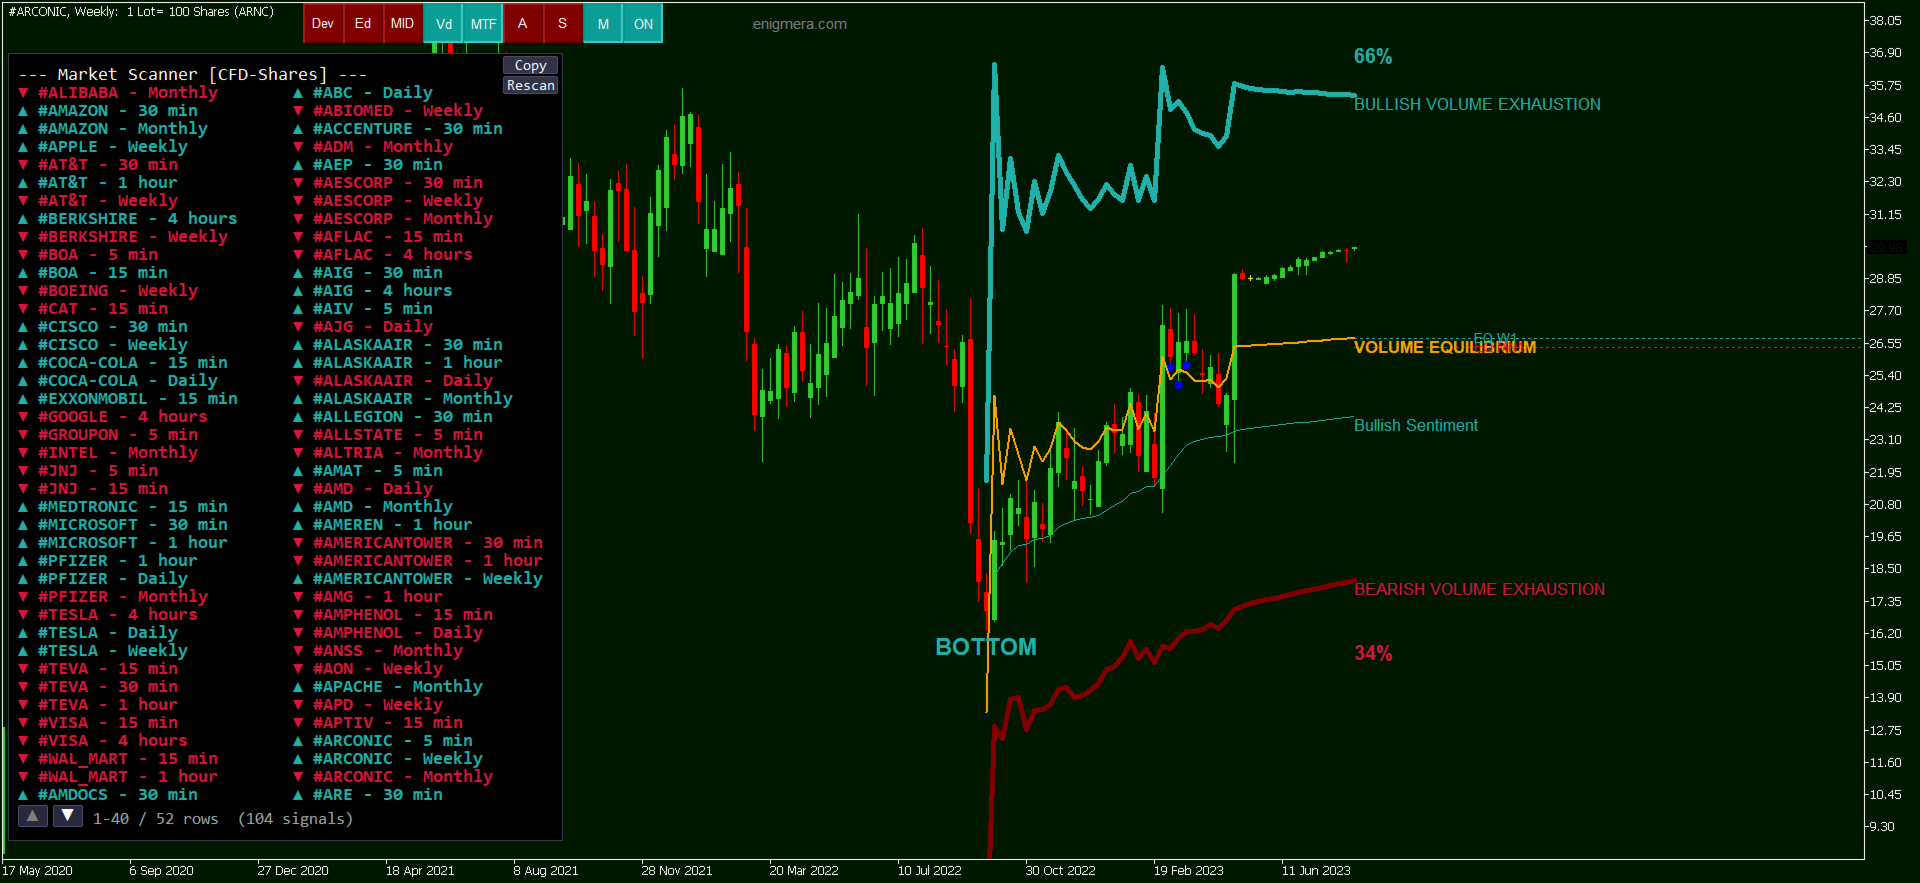
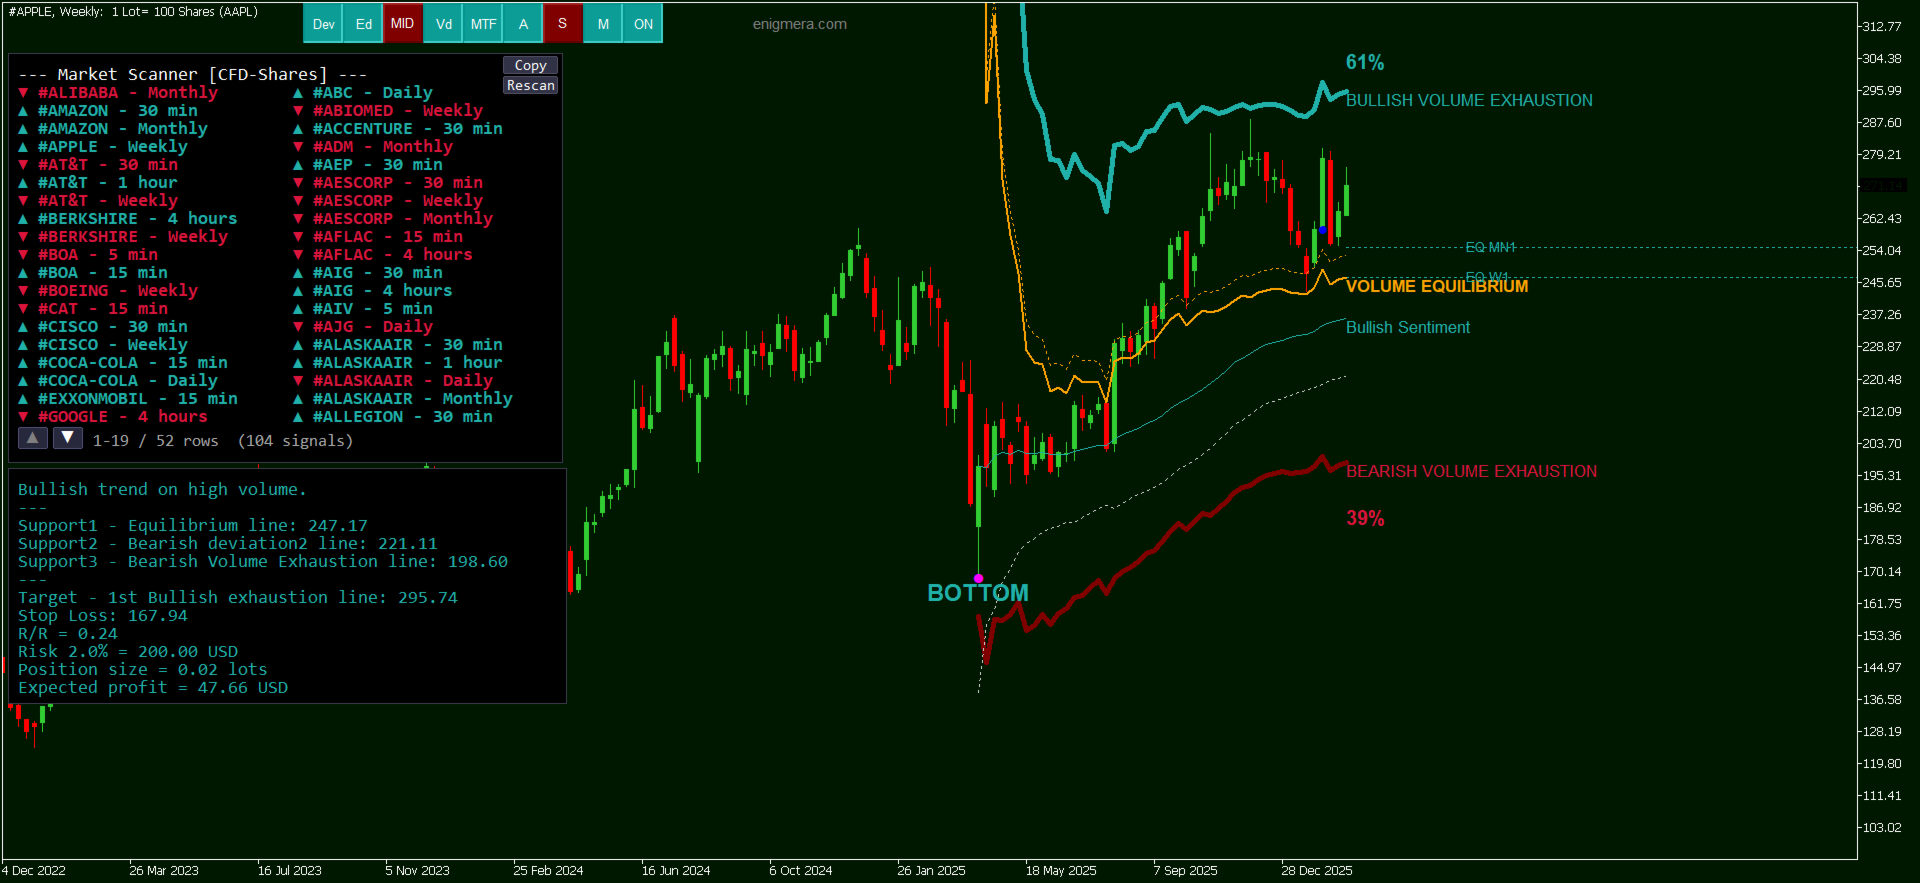
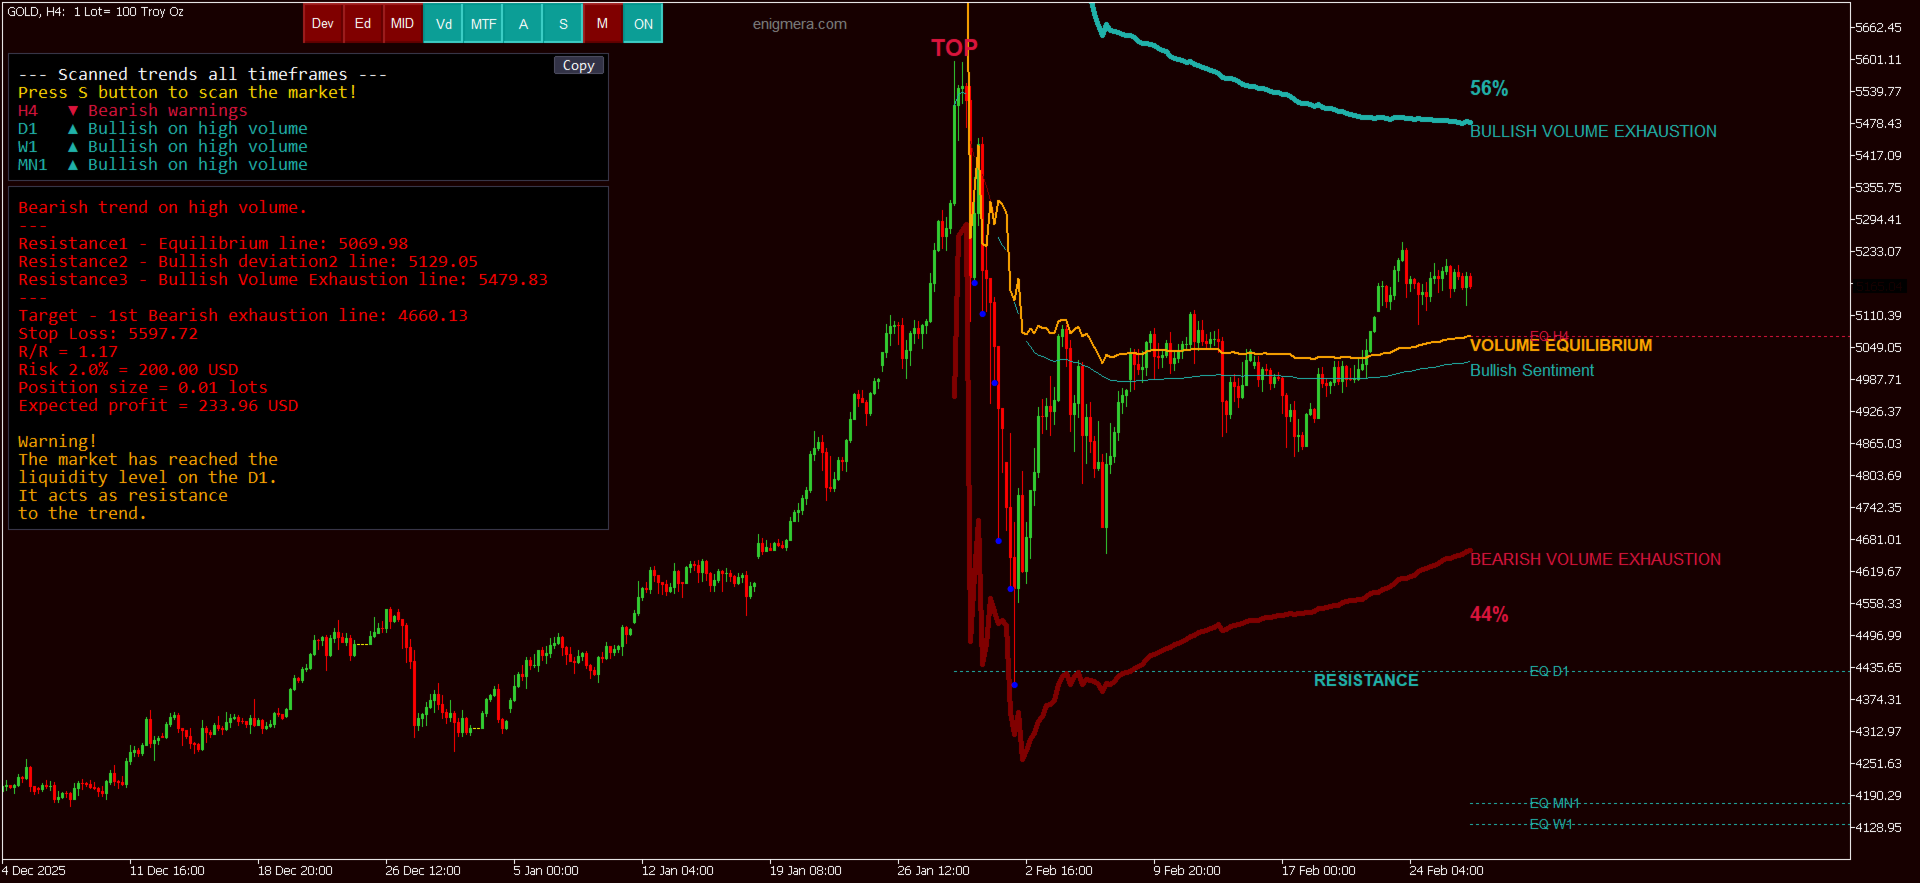
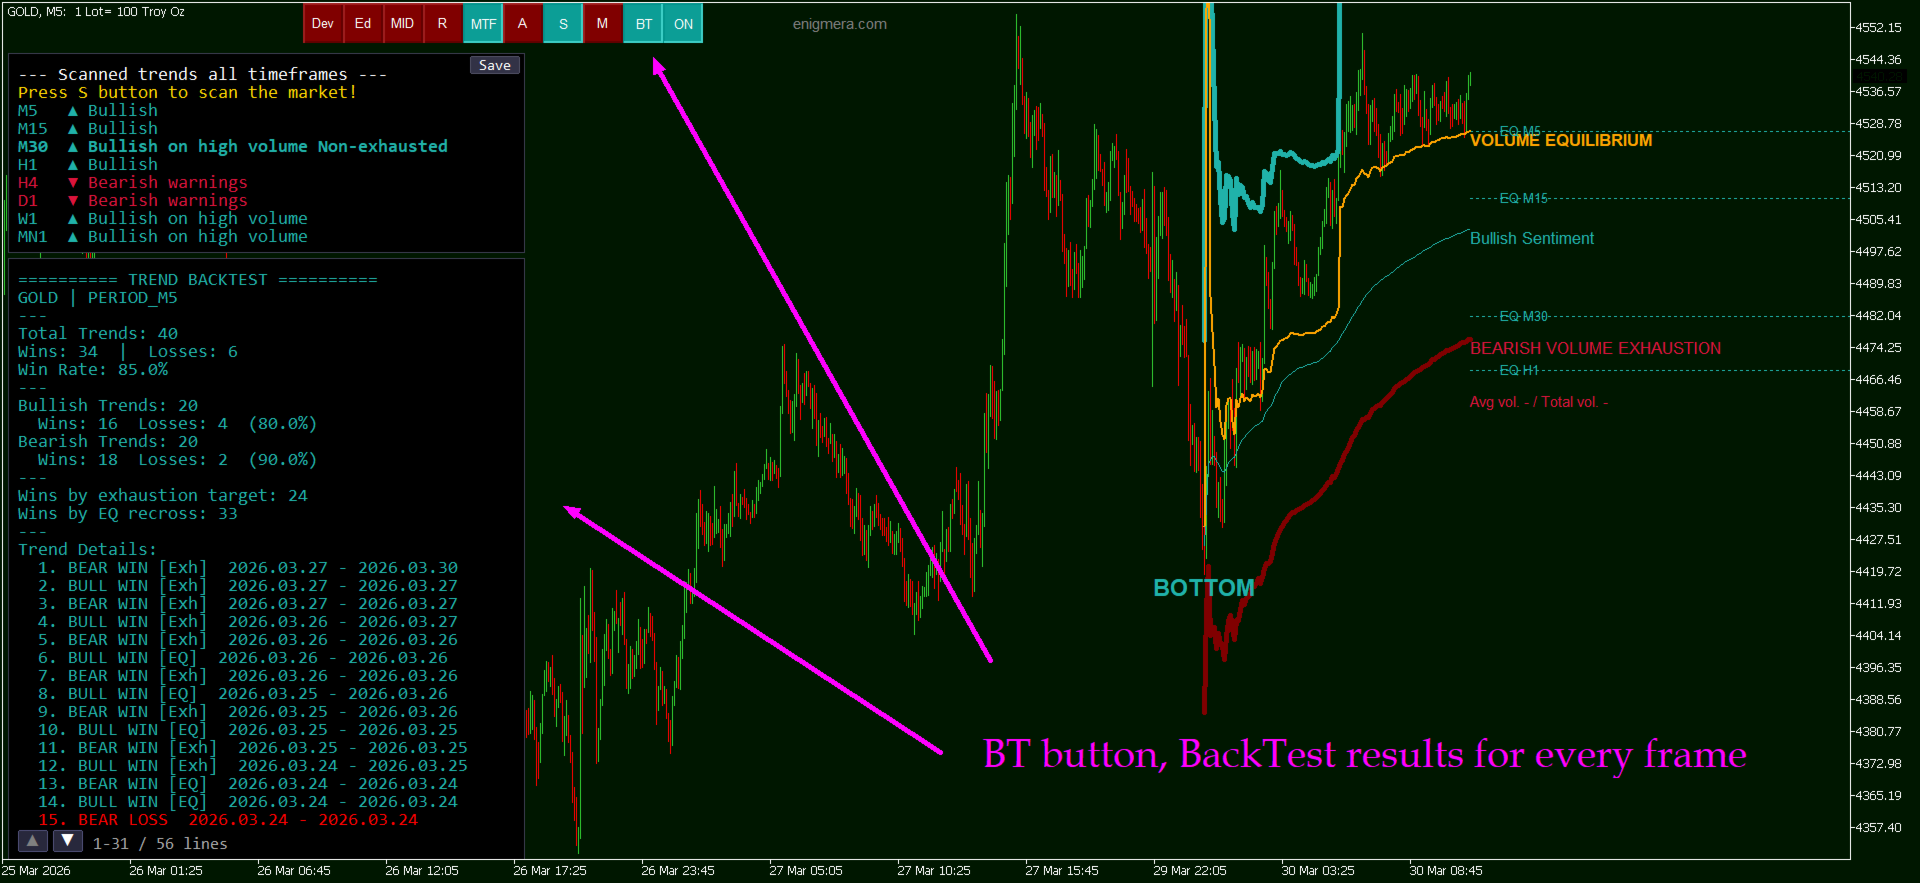
- The Origin Point marks where all computations begin. The indicator automatically positions it at the optimal location. A red label (TOP) indicates a market peak with bearish bias. A green label (BOTTOM) indicates a market trough with bullish bias.
- The Sentiment Line is a dynamic curving line reflecting market sentiment derived from volume-weighted computation. Red means bearish regime, green means bullish regime, and white indicates a rare transitional state.
- Exhaustion Lines are thick solid lines indicating where directional volume becomes exhausted. Green thick lines represent bullish exhaustion levels (upside targets). Red thick lines represent bearish exhaustion levels (downside targets). These levels appear sequentially, up to 12 levels deep. Each new level appears only after price reaches the previous one. When levels stop appearing, the move is approaching full exhaustion.
- The Volume Equilibrium Line is a solid orange line representing the midpoint between the highest bullish and the lowest bearish exhaustion level. It functions as the liquidity axis where primary volume concentrates, as dynamic support in a bullish trend, as dynamic resistance in a bearish trend, and as the Stop Loss reference point. A sustained breach invalidates the current trend thesis.
- Volume Dots appear beneath candles with statistically significant volume. A Blue Dot means volume exceeds 2 standard deviations, indicating significant institutional activity. A Purple Dot means volume exceeds 3 standard deviations, indicating exceptional high-conviction institutional involvement. Volume dots appearing only on one side of the equilibrium line confirm the trend. If they appear on both sides, conditions may be range-bound.
- MTF Horizontal Lines are dashed horizontal equilibrium lines from higher timeframes. Viewing an H1 chart will display lines from H4, D1, W1, and MN1. Green lines indicate bullish trend on that timeframe, red lines indicate bearish. When price approaches a higher-timeframe equilibrium with an opposing trend, the line blinks and a RESISTANCE label appears.
Chart Background Colouring provides instant directional awareness. Dark green background means bullish regime. Dark red background means bearish regime.
Control Buttons
The indicator features 9 control buttons at the top of the chart. Green illumination indicates active, dark red indicates inactive.
- Sup – Displays support line.
- SupL - Displays all timeframes supports on your chart.
- Sd – Shows support's deviation lines this way making a support channel.
- MID – Marks the midpoint (50%) of the entire move, along with 0% and 100% levels.
- R – Ribbon (scalping utility)
- MTF (Multi-Timeframe Lines) toggles horizontal dashed equilibrium lines from higher timeframes, revealing structural barriers that are invisible on lower timeframes. Should remain always active.
- A (Analysis) displays a comprehensive text panel providing complete analysis: trend direction, volume quality, support/resistance levels, target, Stop Loss, Risk/Reward ratio, position size in lots, expected profit, higher-timeframe target levels, and any active warnings. Warnings include volume on both sides, price below or above liquidity, higher-timeframe resistance, market in range, and wrong-side volume.
- S (Scan / Multi-Timeframe Trend Summary) displays a panel showing trend direction across all timeframes from the current timeframe up to Monthly. Bold rows marked Non-exhausted with high volume represent the highest-conviction signals, indicating timeframes where the trend is supported by institutional volume and no exhaustion level has been reached. Clicking any row switches the chart to that timeframe. A Copy button exports results to a text file.
- M (Market Scanner) is a comprehensive market scanner that systematically analyses all instruments available from your broker across all 9 timeframes, fully automated. Press M, select a category (Forex, Indices, Crypto, Commodities, etc.), and the scanner performs complete analysis. Results appear in a colour-coded panel showing only instruments with optimal conditions: high institutional volume, non-exhausted trend, no active warnings. Click any result and the chart navigates instantly. The scanner preserves results from all previously scanned categories. Scanning Forex and then Crypto will cache both. Returning to Forex later displays cached results immediately without rescanning. This persistence survives chart symbol changes and terminal restarts. A Rescan button forces a fresh scan of the current category.
- BT - Back testing results of the previous trends
- ON / OFF – Turns the entire indicator on or off.
Alert System
- Triple-clicking on the chart creates a yellow dashed horizontal alert line at that price level. When price reaches the line, the indicator displays an alert dialogue, plays an audible notification, and optionally sends an email, a push notification, or captures a screenshot. Clicking on it to remove it.
- Configurable alert options include email alerts, mobile push notifications, equilibrium line touch alerts, contra-trend volume alerts, and first exhaustion breach alerts.
Risk Management
The RiskPercent input (default 2%) configures the percentage of account equity risked per trade. The analysis panel automatically calculates the appropriate position size in lots and the projected profit based on this parameter.
Inputs
- IndicatorID - Unique identifier enabling multiple indicator instances on a single chart without conflict.
- IgnoreWeekendBars - Excludes Saturday and Sunday bars on D1. Recommended enabled.
- ShowFirstTouchDots - Renders diamond markers on the initial contact with an exhaustion level.
- RiskPercent - Account risk percentage per trade, default 2%.
- BlinkVolumeDots - Enables blinking animation on volume dots when warnings are active.
- EnableEmailAlerts - Email notifications on signals.
- EnablePushAlerts - Mobile push notifications.
- EnableEquilibriumAlert - Alert when price reaches the equilibrium line.
- EnableWrongSideDotAlert - Alert when a volume dot appears on the wrong side of the trend.
- EnableExhaustionAlert - Alert when the first exhaustion line is reached.
- EnableChartScreenshot - Automatic screenshot on alert, sent via FTP.
- AutoScanTFTrend - Auto-scan all timeframes periodically.
- AutoScanIntervalMin - Auto-scan interval in minutes.
- Colour customisation inputs for button backgrounds, button text, and label colours.
The indicator works on all instruments available from your broker and on all timeframes. Higher timeframes produce stronger, more reliable levels. All levels are computed algorithmically, ensuring ten traders using MERAVITH on the same chart will observe identical levels. Exhaustion levels are derived from standard deviations, and as price reaches successively higher exhaustion levels, the statistical probability of mean reversion increases.
If you want to check the indicator in real trading send me a message.
If you want to check the indicator in real trading send me a message.

like all of Ivans Indicators big value add. In this case its masterpiece, highly recommend it. As always Ivan is very supportive and steady improving, its big joy with him. Big thx Ivan