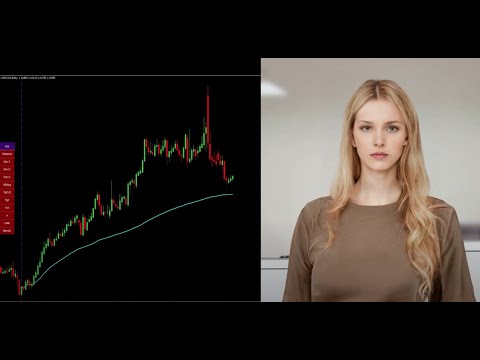
Enigmera MT5

3.67

ENIGMERA: The core of the market

Introduction
This indicator and trading system is a remarkable approach to the financial markets. ENIGMERA uses the fractal cycles to accurately calculate support and resistance levels. It shows the authentic accumulation phase and gives direction and targets.  A system that works whether we are in a trend or a correction. 

How It Works
Most of the indicator’s functionality is controlled through buttons on the left side of the chart, allowing rapid response to different market conditions.
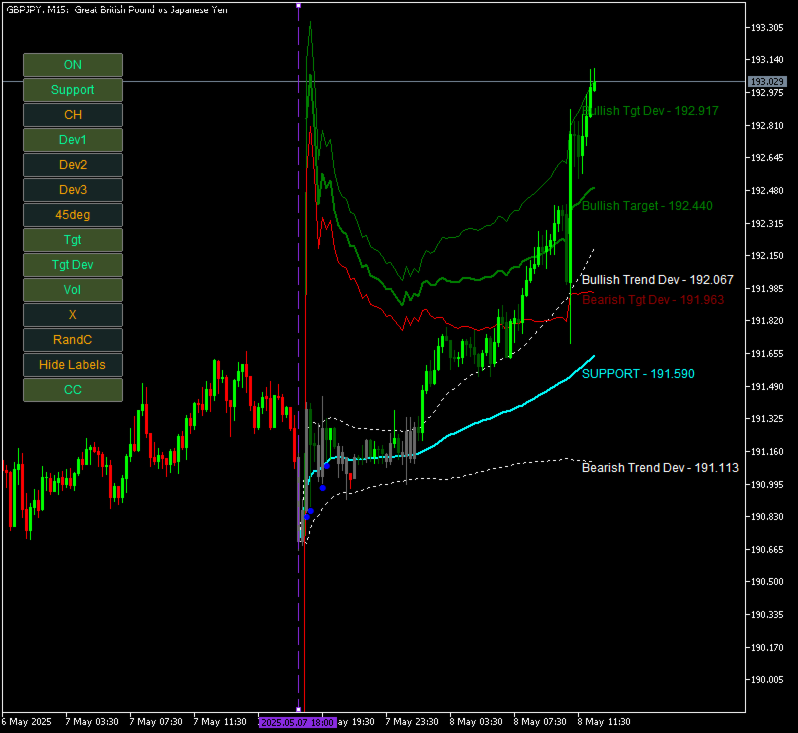
Buttons

  1. ON/OFF - Shows or hides the entire indicator.
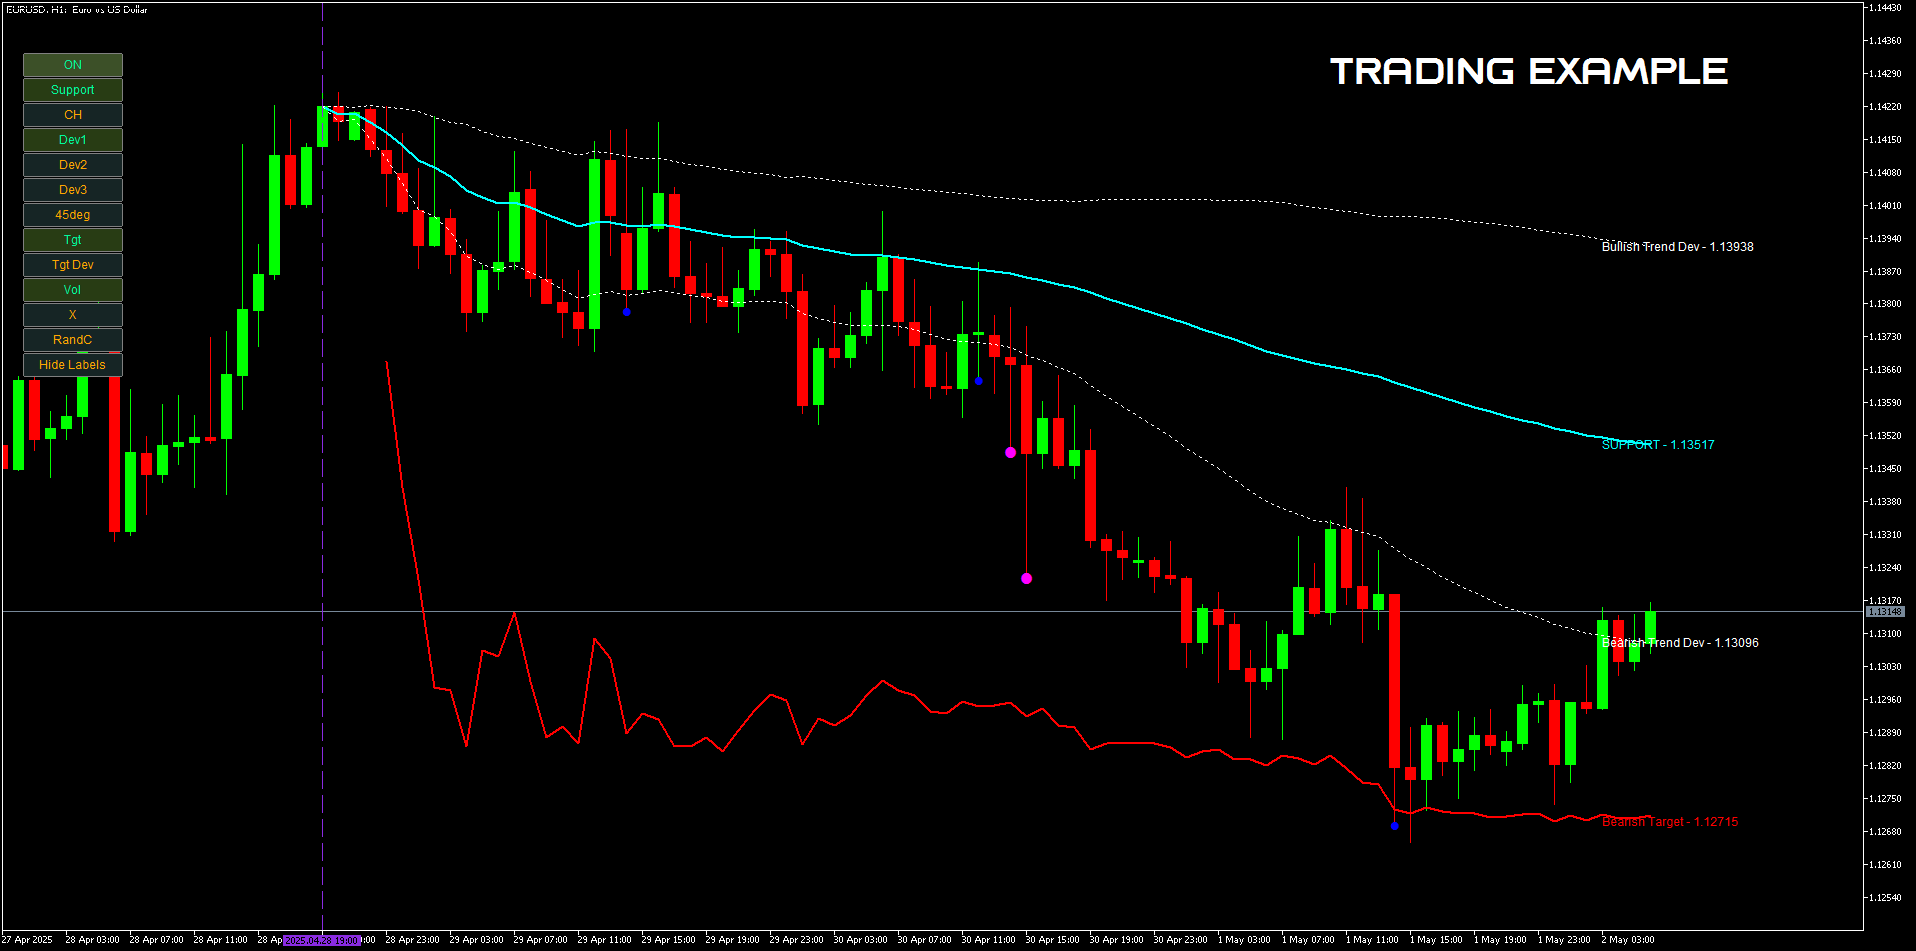
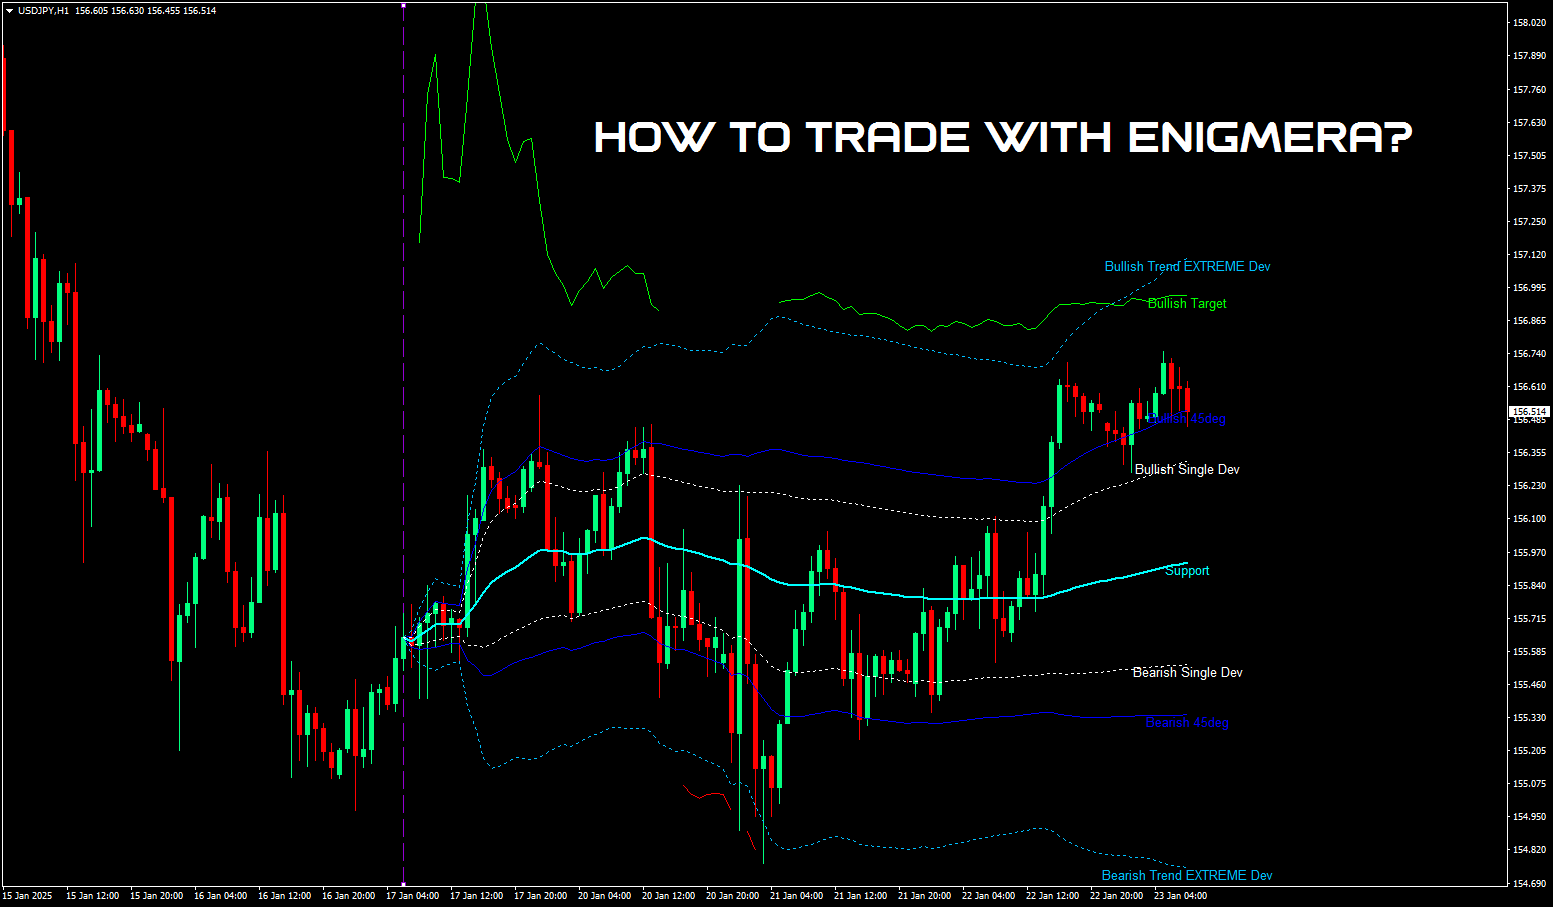
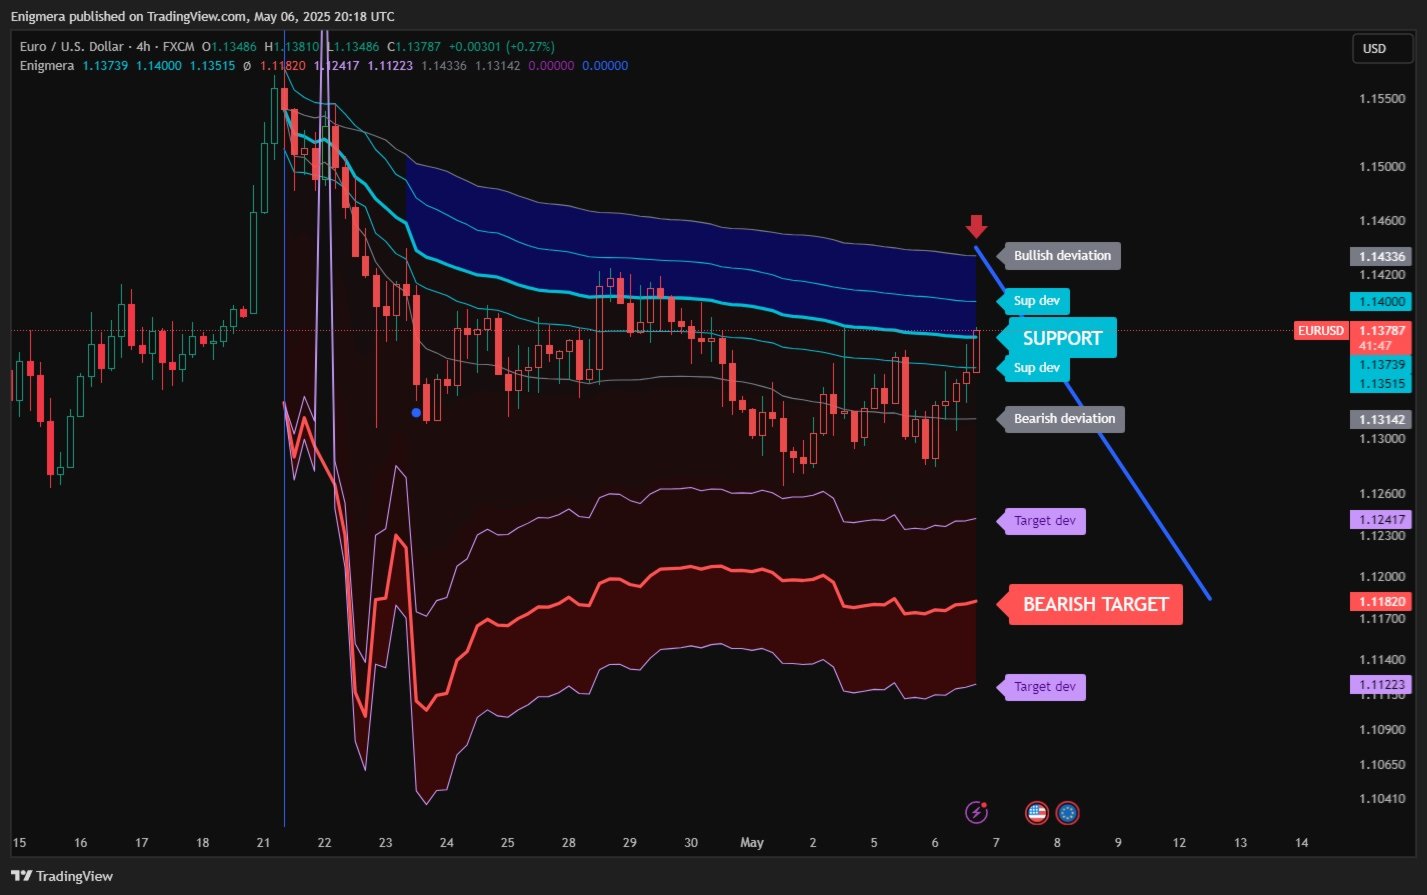
  2. Support - The main support line of the trend
  3. Ch - Activates the support channel, indicating an acceptable range of deviation.
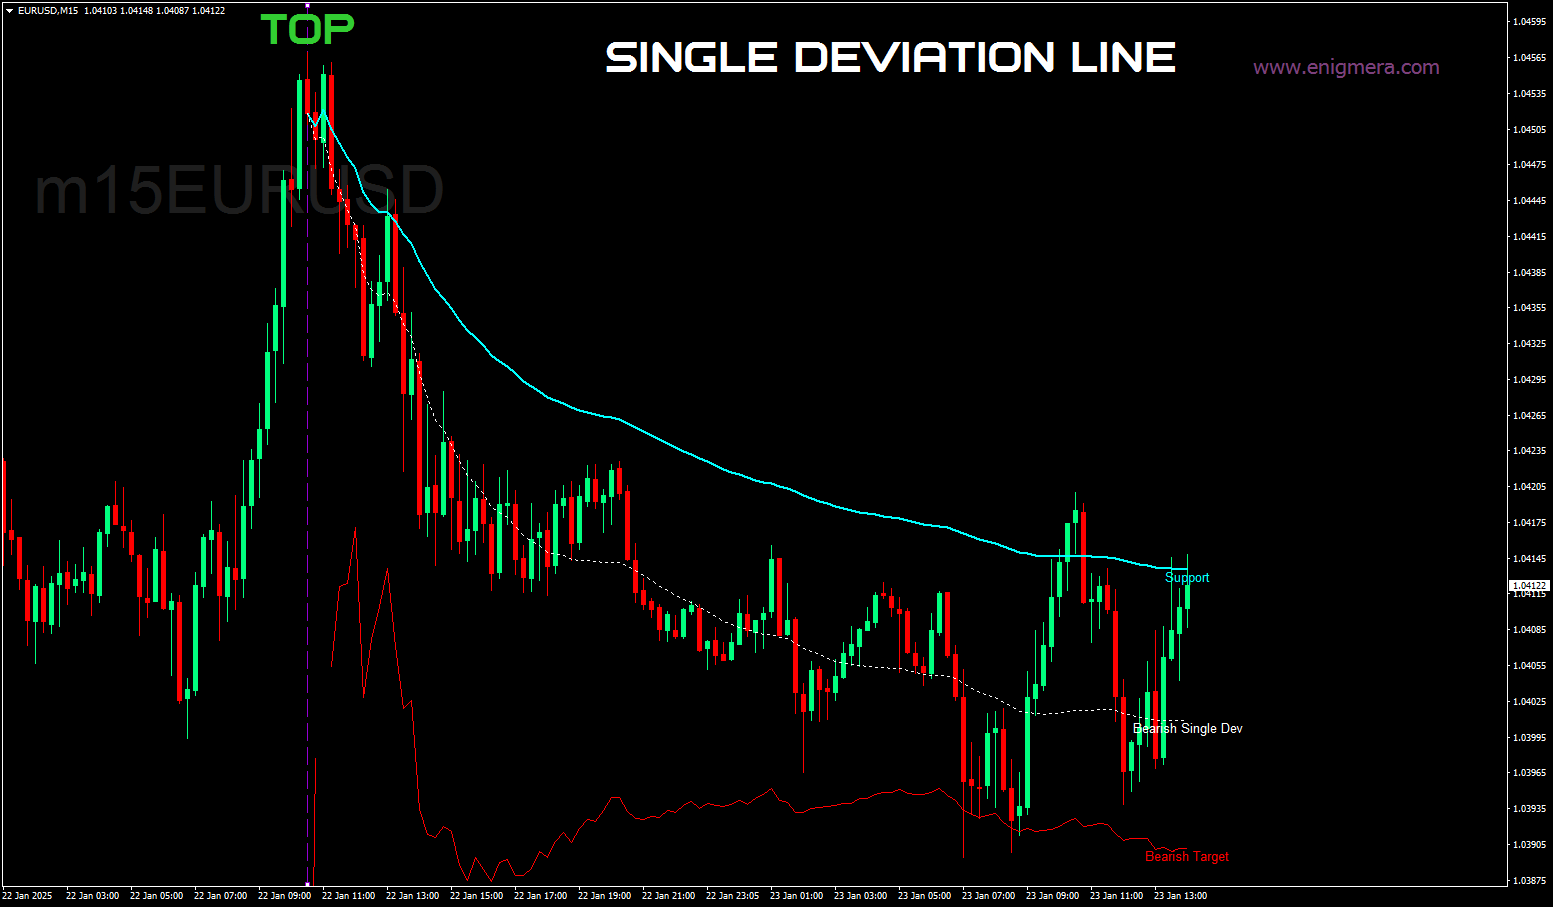
  4. Dev1 (First Deviation) - Indicates price movement within the support deviation, signaling market consolidation or strength accumulation.
  5. Dev2 (Second Deviation) - Shows price movement between deviations, signaling trend formation and direction.
  6. Dev3 (Third Deviation) - Indicates significant trend acceleration and high volatility.
  7. 45deg (45 Degrees) - Shows market pace and movement stability relative to the 45-degree line.
  8. Tgt (Target) - The trend’s target line, indicating levels to close positions.
  9. Tgt Dev - Channel within which the market target can vary.
  10. Vol (Volume) - Displays volume dots on candles to indicate significant changes in market volume.
  11. X - Displays an “X” when the market reaches the target line.
  12. RandC (Random Colors) - Changes the indicator’s lines and labels to random colors for better visualization.
  13. Hide/Show Labels - Shows or hides the labels on the lines
  14. CC - A new button has been added that, when pressed, turns candles above the support line green, those below the line red, and those touching the line neutral gray. This way, the market’s condition is clearly visualized.

The system provides a complete picture of the present—unlike typical market indicators that merely extrapolate past data into the present and future. If you’re on support, it’s genuine support; if you’re on resistance, it’s genuine resistance. A broken level indicates a change in trend.

ENIGMERA is designed for financial analysts and consultants who need dependable insights to share with clients, as well as investors who demand the utmost precision and confidence.

It stands out for its optimal precision, enabling traders to evaluate their options with clarity and confidence.

Combining 20 years of trading expertise and knowledge into one comprehensive package, ENIGMERA is both intuitive and user-dependent. Its effectiveness relies on proper configuration by the user to maximize performance.


Recommendations:

  • Currency Pair: All pairs, all markets
  • Timeframe: All timeframes
  • Minimum Deposit: No minimum deposit
  • Account Type: No limitations
  • Brokers: No limitations

This sophisticated indicator is ideal for effective day trading and scalping strategies. Optimize your discretionary trading with Enigmera’s advanced algorithms, suitable for Forex, stocks, indexes, and crypto markets. Designed for MetaTrader 4, MetaTrader 5 and TradingView, Enigmera streamlines stop-loss and risk management in trading.

All the tools you need to become a successful trader. Enigmera works on every market and every timeframe—with no redrawing.


Before you buy:
This product can be tested directly in the MetaTrader Strategy Tester.
I highly recommend that you explore how it behaves with your preferred instruments, timeframes, and market conditions before making a purchase decision.

Have questions or need clarification?
Feel free to send me a private message here on MQL5.
I’m available to assist and provide clear guidance to ensure you fully understand what the product offers.

Unlock a world of trading wisdom. Are you ready to take your financial decision-making to the ultimate level?

Enigmera is available for MT4


Reviews 3
Gabriel De Araujo Lobo
1322
Gabriel De Araujo Lobo 2025.06.18 15:48 
 

It's amazing how this works, excellent to add to strategies that use price action. Excellent attention given by the seller

Nath
129
Nath 2025.05.26 06:35 
 

This is the best indicator I have used to date. It is worth every dollar. Ivan promptly clarified all my 'humble' questions, supporting a very effective use of the indicator. He also provides a lot of supporting material. **Also available on Tradingview Ivan, thanks again, you genius!

Recommended products
Smooth price for Monarch
Konstantin Gruzdev
5 (1)
The Smooth Price technical indicator is used for plotting a smoothed line as close to the price of the financial instrument as possible, and serves to eliminate its noise components. The indicator is part of the Monarch trading system, but here it is presented as an independent technical analysis tool. The indicator is based on the cluster digital filter , which, unlike the ClusterSMA , is applied directly to the price time series. Smooth Price does not redraw (except the very last, zero bar) an
Trainable artificial intelligence and neural networks. SolarTrade Suite Financial Indicator - Theia Market Indicator! This is an indicator that uses special innovative and advanced algorithms to calculate its values, Your Assistant in the World of Financial Markets. SolarTrade Suite - Theia Market Indicator predicts the price of a financial instrument several values ahead and displays its readings as a comment in the terminal window. Check out our other products from the SolarTrade Suite ser
MSnR Lines
Pierre Paul Amoussou
MSnR Lines is a custom indicator designed to display Support and Resistance levels on a chart. These levels are based on Malaysian Support and Resistance theory, which defines levels not as areas but as specific price levels derived from line chart peaks and valleys. Features: Three types of levels: A-Level, V-Level, and Gap Level. Freshness indication for levels: Fresh levels are more significant than unfresh levels. Customizable color and style for fresh and unfresh levels. Option to display o
WanaScalper
Isaac Wanasolo
1 (1)
A scalping indicator based on mathematical patterns, which on average gives signals with relatively small SL, and also occasionally helps to catch big moves in the markets (more information in the video) This indicator has three main types of notifications: The first type warns of a possible/upcoming signal on the next bar The second type indicates the presence of a ready signal to enter the market/open a position The third type is for SL and TP levels - you will be notified every time price re
WAPV Weis Wave Chart Forex
Eduardo Da Costa Custodio Santos
The Weis Wave Chart Forex for MT5 is a Price and Volume indicator. The Price and Volume reading was widely disseminated through Richard Demille Wyckoff based on the three laws created by him: Supply and Demand, Cause and Effect and Effort vs. Result. In 1900 R.Wyckoff already used the wave chart in his analyses. Many years later, around 1990, David Weis Automated R. Wyckoff's wave chart and today we bring you the evolution of David Weis' wave chart. It shows the amount of Volume and the amount o
GannTools
issam rahhal sabour
GannTools Indicator The GannTools Indicator is a powerful trading tool inspired by W.D. Gann's strategies. This indicator provides traders with dynamic support and resistance levels, trend analysis, and key price patterns using Gann angles and cycles. Key Features: Customizable Gann Fans, Angles, and Cycles for precise market analysis. Automatic identification of key price levels and trend directions. Works on all timeframes and instruments for flexible trading strategies. Integrated visualiza
Engulfing with EMAs Indicator Unlock the power of advanced candlestick pattern detection with the Engulfing with EMAs Indicator , a cutting-edge tool designed for MetaTrader 5. This futuristic indicator combines the precision of engulfing pattern analysis with the trend-following strength of Exponential Moving Averages (EMA 21 and EMA 50), empowering traders to identify high-probability setups across all currency pairs and timeframes. Key Features: Comprehensive Engulfing Detection : Detects b
Fibonacci sequence is defined by integer sequence: 0, 1, 1, 2, 3, 5, 8, 13, 21, 34, 55, 89, 144, ... By definition, it starts from 0 and 1, the next number is calculated as a sum of two previous numbers. Instead of the standard moving average, the indicator uses the following calculation of average price: Bar0 + Bar1 + Bar2 + Bar3 + Bar5 + Bar8 + Bar13 + Bar21 + ... Input parameters: fiboNum - numbers in the following integer sequence for Fibo Moving Average 1. 5 on default. fiboNum2 - numbers i
How to use? • Buy Low and Sell High. • Brighter zones means strong Support or Resistance. • Weaker zones appear lighter. • Brighter zones are formed by overlapping of lines from multiple levels of support or resistance. Indicator Menu • The indicator can input 5 different Lengths. • The default settings uses 13, 21, 52, 100 & 200. • Every option are customizable.
ZigZag SMC Premium MT5
Kallebe Lins De Oliveira Santos
If you are looking for precision in identifying strategic tops and bottoms, the ZigZag SMC/SMT Indicator for MT5 is the tool that will contribute to your technical analysis. Developed based on the advanced concepts of Smart Money Concepts (SMC) and Smart Money Trap (SMT), it offers an insight into market behavior, helping you make decisions. What will you find in this indicator? Automatic identification of strategic tops and bottoms Based on institutional strategies Ideal for analyzing liqu
Introduction to X3 Chart Pattern Scanner X3 Cherart Pattern Scanner is the non-repainting and non-lagging indicator detecting X3 chart patterns including Harmonic pattern, Elliott Wave pattern, X3 patterns, and Japanese Candlestick patterns. Historical patterns match with signal patterns. Hence, you can readily develop the solid trading strategy in your chart. More importantly, this superb pattern scanner can detect the optimal pattern of its kind. In addition, you can switch on and off individu
Fibonacci sequence is defined by integer sequence: 0, 1, 1, 2, 3, 5, 8, 13, 21, 34, 55, 89, 144, ... By definition, it starts from 0 and 1, the next number is calculated as a sum of two previous numbers. Instead of the standard moving average, the indicator uses the following calculation of average price: Bar0 + Bar1 + Bar2 + Bar3 + Bar5 + Bar8 + Bar13 + Bar21 + ... This indicator shows 2 moving Fibonacci lines and arrows when 2 these lines crossing each other. If an Aqua line is crossing a Yell
VeMAs mt5
Roman Kuleshov
The VeMAs indicator is an innovative trading tool designed to improve your trading strategy by analyzing volume dynamics and market structure. Whether you are a beginner or an experienced trader, VeMAs gives you an edge. VeMAs indicator available for only $50. Original price of the indicator $299 LIMITED TIME OFFER. Contact me after purchase for a personalised bonus! You can get absolutely free cool utility (VeMAs Utility MTF) that makes VeMAs indicator multitimeframe, please pm. me! Version MT
Introducing the revolutionary MT5 indicator, DARWIN Assistant   - your ultimate gateway to the world of successful trading! Designed with precision and expertise, DARWIN Assistant     operates on a special strategy that harnesses the power of advanced technical indicators - RSI, Stochastics, CCI, and Trends - across all time frames. Brace yourself for an extraordinary trading experience as this cutting-edge indicator offers you the most accurate signals for entry, enabling you to navigate the m
This indicator uses support and resistance, volume and some special formula to calculate the volume to filter the candles. If the volume reaches a specific value, And at the same time, Candle breaks the support/resistance line, There would be a signal and we can enter the market. Signals appear when the current candle closes. then you can enter the trade when a new candle appears. Please don't forget to follow your money management plan. MT4 Version Support/Resistance Breakout MT4 :   https:/
Looking for reliable levels on a price chart? Already tired of searching for similar indicators? Are the levels not working out as they should? Then this is the indicator for you. Volume Prices Universal is a reliable indicator of horizontal volumes. What does it show? First of all, the main idea of ​​the indicator is to display at which price mark the price has been for the longest time. Thus, the display of price volumes on the price chart is formed. With the help of which you can very simpl
Di Napoli MACD MT5
Samil Bozuyuk
4.33 (6)
Non-proprietary study of Joe Dinapoli used for trend analysis. The indicator gives trend signals when the fast line penetrates the slow line. These signals remain intact until another penetration occurs. The signal is confirmed at the close of the period. It is applicable for all timeframes.   Parameters Fast EMA: period of the fast moving average. Slow EMA: period of the slow moving average. Signal EMA: period of the signal line.                              ************************************
FREE
Overview Harmonic Patterns MT5 is a technical analysis indicator designed for the MetaTrader 5 platform. It identifies and displays harmonic price patterns, such as Butterfly, Cypher, Crab, Bat, Shark, and Gartley, in both bullish and bearish directions. The indicator calculates key price levels, including entry, stop loss, and three take-profit levels, to assist traders in analyzing market movements. Visual elements and customizable alerts enhance usability on the chart. Features Detects six ha
About the Indicator This indicator is based on Monte carlo simulations on the closing prices of a financial instrument. By definition, Monte carlo is a statistical technique used to model the probability of different outcomes in  a process that involves random numbers based on previously observed outcomes. How does it Work? This indicator generates multiple price scenarios for a security by modelling random price changes over time based on historical data. Each simulation trial uses random vari
MarketMagnet
Kelly Adediran Raymond
Are you ready to take your trading journey to new heights? Look no further than MarketMagnet, this groundbreaking indicator designed to propel your trading success with excitement and accuracy. Powered by the convergence of Momentum and CCI (Commodity Channel Index), MarketMagnet equips traders with the ultimate tool to determine direction and entry prices for a wide range of recommended currency pairs and instruments. It is designed for traders seeking to scalp for a few pips on lower timeframe
The Trend Catcher: The Trend Catcher Strategy with Alert Indicator is a versatile technical analysis tool that aids traders in identifying market trends and potential entry and exit points. It features a dynamic Trend Catcher Strategy , adapting to market conditions for a clear visual representation of trend direction. Traders can customize parameters to align with their preferences and risk tolerance. The indicator assists in trend identification, signals potential reversals, serves as a trail
FREE
The "No Reversal Accumatrix AI" is a cutting-edge MetaTrader 5 indicator designed to assist traders in confirming trends without the inconvenience of repainting. Built upon advanced artificial intelligence algorithms, this indicator offers a reliable tool for identifying and validating trends in financial markets. Key Features: Non-Repainting Technology : Unlike traditional indicators prone to repainting, the "No Reversal Accumatrix AI" utilizes innovative algorithms to provide accurate trend co
Professional Trading Analytics Suite v3.01 - The Ultimate Performance & Risk Management Dashboard Transform Your Trading with Institutional-Grade Analytics and Real-Time Risk Management Professional Trading Analytics Suite is the most advanced and comprehensive trading performance analysis tool available for MetaTrader 5. This latest version (3.01) delivers institutional-level analytics, real-time monitoring, and sophisticated risk management tools that professional traders and fund managers re
The Trend Terminator
Javier Antonio Gomez Miranda
Trend Terminator - Market Opening Strategy with Enhanced Filters Trend Terminator implements a strategy inspired by STOCKS & COMMODITIES magazine. The purpose of this EA is to trade the market opening, meeting specific conditions detailed below, and taking long or short positions accordingly. To enhance the results, I’ve added 3 filters: Trend -> Uses a 200 Moving Average (MA 200). Inside Range -> Checks if the previous bar is an inside range bar. Low Volatility -> Uses ATR to confirm if volati
EFW Pattern Trader is a powerful pattern scanner for Forex and Stock trading. The pattern detection in EFW Pattern Trader uses the Fractal Wave Theory, which captures the endless up and down movement of the market. Therefore, EFW Pattern Trader can be considered as the robust price action indicator. Any patterns in EFW Pattern Trader can be backtested visually in your strategy tester. Visual backtesting with pattern will show you how pattern will likely behave in the live trading. Therefore, you
Candle Pattern Finder MT5
Pavel Zamoshnikov
4.2 (5)
This indicator searches for candlestick patterns. Its operation principle is based on Candlestick Charting Explained: Timeless Techniques for Trading Stocks and Futures by Gregory L. Morris. If a pattern is detected, the indicator displays a message at a bar closure. If you trade using the MetaTrader 4 terminal, then you can download the full analogue of the " Candle Pattern Finder for MT4 " indicator It recognizes the following patterns: Bullish/Bearish (possible settings in brackets) : Hammer
The indicator builds a graphical analysis based on the Fibonacci theory. Fibo Fan is used for the analysis of the impulses and corrections of the movement. Reversal lines (2 lines at the base of the Fibonacci fan) are used to analyze the direction of movements. The indicator displays the of 4 the target line in each direction. The indicator takes into account market volatility. If the price is above the reversal lines, it makes sense to consider buying, if lower, then selling. You can open posi
Naked Forex Kangaroo Tail Pro Indicator Kangaroo Tail Pro Indicator is a pattern recognition indicator for Forex, Stocks, Indices, Futures, Commodities and Cryptos. The Kangaroo Tail is a multi-bar pattern. The Kangaroo Tail pattern is very effective and is very simple to trade. The strategy that comes with the Kangaroo Tail is based on price action. The indicator does what it was designed for: displaying Kangaroo Tail patterns.     Don't expect to follow the up and down arrows and make mone
The indicator is the advanced form of the MetaTrader 4 standard Fibonacci tool. It is unique and very reasonable for serious Fibonacci traders. Key Features Drawing of Fibonacci retracement and expansion levels in a few seconds by using hotkeys. Auto adjusting of retracement levels once the market makes new highs/lows. Ability to edit/remove any retracement & expansion levels on chart. Auto snap to exact high and low of bars while plotting on chart. Getting very clear charts even though many ret
Fibonacci retracement is a method of technical analysis for determining support and resistance levels. The TSO Fibonacci Chains Indicator is different from a simple Fibonacci Retracements indicator in that it provides the targets for each retracement level. In other words, there is an Extension Level (D) for every Retracement Level (C). In addition, if an Extension Level is reached, then a new Fibonacci setup is created automatically. These consecutive Fibonacci setups create a chain that reveal
Buyers of this product also purchase
AriX
Temirlan Kdyrkhan
1 (1)
AriX Indicator for MT5 A powerful trend-following and signal-evaluation tool AriX is a custom MT5 indicator that combines Moving Averages and ATR-based risk/reward logic to generate clear buy/sell signals. It visualizes dynamic SL/TP levels, evaluates past trade outcomes, and displays win/loss statistics in a clean on-chart panel. Key features include: Buy/Sell signals based on MA crossovers ATR-based SL/TP1/TP2/TP3 levels with visual lines and labels Signal outcome tracking with real-time stat
ARIPoint
Temirlan Kdyrkhan
ARIBot is a powerful trading companion designed to generate high-probability entry signals with dynamic TP/SL/DP levels based on volatility. Built-in performance tracking shows win/loss stats, PP1/PP2 hits, and success rates — all updated live. Key Features: Buy/Sell signals with adaptive volatility bands Real-time TP/SL/DP levels based on ATR Built-in MA Filter with optional ATR/StdDev volatility Performance stats panel (Success, Profit/Loss, PP1/PP2) Alerts via popup, sound, push, or email Cus
Integrated Dashboard Scanner
Krzysztof Janusz Stankiewic
Integrated Dashboard Scanner – Your Market Command Center (v2.0) Short Description: Stop wasting time manually switching between dozens of charts. The   Integrated Dashboard Scanner   is a powerful multi-symbol, multi-timeframe scanner that keeps an eye on every instrument you select from a single panel.   Following a major architectural overhaul, version 2.0 is faster, more stable, and more powerful than ever.   Receive instant visual alerts for price patterns, divergences, and trend signals,
This indicator identifies and displays zones, as it were areas of strength, where the price will unfold. The indicator can work on any chart, any instrument, at any timeframe. The indicator has two modes. The indicator is equipped with a control panel with buttons for convenience and split into two modes. Manual mode: To work with manual mode, you need to press the NEW button, a segment will appear. This segment is stretched over the movement and the LVL button is pressed. The level is displayed
Get the FREE AUX Indicator, EA Support & full Guide please visit - https://www.mql5.com/en/blogs/post/763955 Spot the Trend. Read the Pattern. Time the Entry. 3 Steps in Under 30 Seconds! Trade effortlessly — no analysis required, Your smart assistant is ready to simplify your workflow No more chart overload. Trade with confidence using smart bias detection. Compatible with all currencies, crypto, stocks, metals, indices, and any timeframe. Just click and execute — it’s that simple. Deal for bu
VTrende Pro
Andrii Diachenko
5 (1)
VTrende Pro - MTF indicator for trend trading with a display panel for MT5 *** Videos can be translated into any language using subtitles (video language - Russian) Although the signals of the VTrende Pro indicator can be used as signals of a full-fledged trading system, it is recommended to use them in conjunction with the Bill Williams TS. VTrende Pro is an extended version of the VTrende indicator. Difference between Pro version and VTrende: - Time zones - Signal V - signal 1-2 waves -    S
The First Red MT5
Krzysztof Janusz Stankiewic
1. Introduction The “First Red” Indicator is a tool designed to pinpoint dynamic market turning points by combining local price extremes with signals from the MACD (Moving Average Convergence Divergence) oscillator. Based on Dariusz Dargo’s original concept, it marks specific candles on your chart that meet the conditions of the “First Red” setup or its related variants—“Second Red,” “First Green,” and “Second Green.” These classifications let traders see at a glance when momentum may be shifti
The " Dynamic Scalper System MT5 " indicator is designed for the scalping method of trading within trend waves. Tested on major currency pairs and gold, compatibility with other trading instruments is possible. Provides signals for short-term opening of positions along the trend with additional price movement support. The principle of the indicator. Large arrows determine the trend direction. An algorithm for generating signals for scalping in the form of small arrows operates within trend wav
The Second-Level Tick Candlestick Generator is a professional-grade MT5 indicator tool specifically designed for high-frequency trading and short-term scalping. It can convert raw tick data into highly customizable second-level candlestick charts in real-time, helping traders accurately capture micro-market fluctuations and optimize entry and exit timing. This tool provides clear chart displays, allowing you to more intuitively identify price action patterns and improve trading decision efficien
Purpose of the Inside Bar and Outside Bar Breakout Scanner Indicator: The Inside Bar & Outside Bar Breakout Scanner  is an advanced dashboard designed to scan multiple instruments and timeframes simultaneously. Its primary function is to identify two powerful candlestick patterns—the  Inside Bar (IB)  and the  Outside Bar (OB) —and then to detect and classify breakouts from these formations. The indicator presents its findings in a clean, organized table, signaling potential trend continuation o
Cycle Maestro MT5
Stefano Frisetti
5 (1)
NOTE: CYCLEMAESTRO is distributed only on this website, there are no other distributors. Demo version is for reference only and is not supported. Full versione is perfectly functional and it is supported. CYCLEMAESTRO , the first and only indicator of Cyclic Analysis, useful for giving signals of TRADING, BUY, SELL, STOP LOSS, ADDING. Created on the logic of   Serghei Istrati   and programmed by   Stefano Frisetti ;   CYCLEMAESTRO   is not an indicator like the others, the challenge was to inter
This indicator is based on the mathematics of the great trader W.D. Ganna. With its help, you can easily find strong levels by analyzing swings to find the optimal entry point. The indicator works on all instruments and all timeframes. The indicator is fully manual and has control buttons. All you need to do is press the NEW button, a segment will appear, which you can place on any movement, swing or even 1 candle that you want to analyze. By placing the segment, press the OK button. A grid (th
The indicator is designed to work on any trading platform. The program is based on proprietary algorithms and W.D.Ganna's mathematics, allowing you to calculate target levels of price movement based on three points with the highest degree of certainty. It is a great tool for stock trading. The indicator has three buttons: NEW - call up a triangle for calculation. DEL - delete the selected triangle. DELS - completely remove all constructions. The probability of achieving the goals is more than 80
Core Concept: Naveen Saroha's Advanced time and price angles are drawn from significant highs or lows at specific geometric ratios that represent the relationship between price movement and time. The Main Gann Angles and Percentage together Most Important: 1x1 Angle : One units of price for one unit of time  1x2 Angle : One unit of price for two units of time  1x3 Angle 1x4 Angle 1x5 Angle 1x6 Angle 1x7 Angle 1x8 Angle: (45) : Eight unit of price for one unit of time - considered the most i
Jeslyn MT5
Justine Kelechi Ekweh
This is a multi-purpose system that suits both Binary options, and Forex. Manual traders can use this either as a scalping system or a strategy to get into very strong momentum, or it can be automated for forex trading with Universal EAs.   This is a less-risky system if you know what to do with it or just use a universal EA. Use on M5 timeframe There is of course no chance of repainting or recalculation. Once the price closes, the arrows remain there forever! This is because prices don't lie.
A tool for on-chart strategy backtesting and performance analysis. A utility for developing, debugging, and testing custom trading ideas and indicator functions. An indicator designed to quickly test trading concepts and visualize the effectiveness of different input parameters. An all-in-one sandbox for testing everything from simple crossovers to complex, multi-condition trading systems.
IVISTscalp5
Vadym Zhukovskyi
5 (6)
What's new about iVISTscalp5 forecast indicator (Version 10)? iVISTscalp5 is a unique nonlinear forecasting for a week ahead system for any financial instrument which executes fast scalping using time levels. iVISTscalp5 is a tool for easy study and understanding of financial market. 1) iVISTscalp5 forecast indicator has been completely rewritten into another programming language (C++), which has accelerated data loading and processing. As a result, a different graphical display of forecasts
Viking Strategy Signal Indicator
E Bahamlong Bagoudjare
5 (1)
Viking Strategy Indicator – The Beating Heart of the BT 3.0 System The Viking Strategy Indicator is not just another indicator… It’s one of the pillars of the revolutionary BT 3.0 trading system , built to transform the trading experience for everyone — from beginners to experts . BT 3.0 is much more than a tool: It’s a complete trading solution , both semi-automated and fully automated , integrating 6 powerful indicators and a smart assistant that analyzes, detects, alerts, and executes
Supply Demand Ranger
Krzysztof Janusz Stankiewic
The indicator draws supply and demand zones. The zone timeframe can be set independently of the chart timeframe. For instance, it is possible to set M5 zones on an H4 chart. The importance of zones can be adjusted using the zone strength parameter. Demand zones are displayed if at least one candle in the range of the zone is entirely above the zone. Similarly, supply zones are displayed if at least one candle within the zone is entirely below the zone.
MACD Divergence and TFR for MT5
Krzysztof Janusz Stankiewic
The indicator identifies divergence by analyzing the slopes of lines connecting price and MACD histogram peaks or troughs. Bullish Divergence (Convergence): Occurs when the lines connecting MACD troughs and corresponding price troughs have opposite slopes and are converging. Bearish Divergence: Occurs when the lines connecting MACD peaks and corresponding price peaks have opposite slopes and are diverging. When a divergence signal is detected, the indicator marks the chart with dots at the pric
Channel Trend Bands – A Comprehensive Indicator for Market Analysis MetaTrader 4 Version Simple to Use, Effective in Application User-Friendly and Suitable for All Traders This indicator stands out due to its straightforward functionality. Whether you're a beginner exploring the market or an experienced trader refining your strategy, this tool offers valuable insights. Using a   Triangular Moving Average (TMA)   with additional   ATR-based bands , it provides structured market data to support w
Supply Demand FVG Zones
Krzysztof Janusz Stankiewic
Supply or demand zones refer to price areas where a significant amount of supply or demand had previously entered the market, causing prices to either fall or rise. If the price returns to the demand or supply zone, it is likely to bounce off due to the large number of orders previously placed within the zone. These orders will be defended in these areas. The Fair Value Gap (FVG) is a concept used to identify imbalances in the equilibrium of buying and selling. Fair Value Gaps are formed in a t
Multi-Timeframe Bollinger Bands Indicator Enhance your trading analysis with our Multi-Timeframe Bollinger Bands indicator for MQL5! This powerful tool allows you to visualize Bollinger Bands across five different timeframes simultaneously, all using the same period setting . Gain a clearer understanding of market volatility and potential trend reversals at a glance. Simplify your multi-timeframe analysis and make more informed trading decisions.
The indicator is designed to close positions on the market in time. For example: to take profits ahead of schedule if the price has not reached TakeProfit, and the market is turning around. The indicator analyzes the momentum, not the trend. He does not give any information about the trend. The indicator is well suited for finding divergence. The Ershov 38 Parrots indicator dynamically adjusts to the market and detects price movement impulses of medium and high amplitude. It almost does not rea
Trend Compass MT5
Paul Edunyu Carissimo
Trend Compass: All-in-One Trend Tracking The Trend Compass indicator is a sophisticated yet user-friendly trading tool designed for both novice and experienced traders. By combining multiple technical analysis approaches into one comprehensive package, it eliminates the need for multiple indicators cluttering your charts. Key Features: Multiple analysis modes including VSA for effort/result evaluation Dynamic trailing stops using fractal levels Seven color visualization options for clear market
The Expert Advisor and the video are attached in the Discussion tab . The robot applies only one order and strictly follows the signals to evaluate the indicator efficiency. Pan PrizMA CD Phase is an option based on the Pan PrizMA indicator. Details (in Russian). Averaging by a quadric-quartic polynomial increases the smoothness of lines, adds momentum and rhythm. Extrapolation by the sinusoid function near a constant allows adjusting the delay or lead of signals. The value of the phase - wave s
Классификатор силы тренда. Показания на истории не меняет. Изменяется классификация только незакрытого бара. По идее подобен полной системе ASCTrend, сигнальный модуль которой, точнее его аппроксимация в несколько "урезанном" виде, есть в свободном доступе, а также в терминале как сигнальный индикатор SilverTrend . Точной копией системы ASCTrend не является. Работает на всех инструментах и всех временных диапазонах. Индикатор использует несколько некоррелируемых между собой алгоритмов для класси
FFx Universal Strength Meter PRO is more than a basic strength meter. Instead of limiting the calculation to price, it can be based on any of the 19 integrated strength modes + 9 timeframes. With the FFx USM, you are able to define any period for any combination of timeframes. For example, you can set the dashboard for the last 10 candles for M15-H1-H4… Full flexibility! Very easy to interpret... It gives a great idea about which currency is weak and which is strong, so you can find the best pai
The FFx Universal MTF alerter shows on a single chart all the timeframes (M1 to Monthly) with their own status for the chosen indicator. 9 indicators mode (MACD-RSI-Stochastic-MA-ADX-Ichimoku-Candles-CCI-PSAR). Each can be applied multiple times on the same chart with different settings. Very easy to interpret. Confirm your BUY entries when most of the timeframes are showing green color. And confirm your SELL entries when most of the timeframes are showing red color. 2 Alert Options : input to s
The FFx Watcher PRO is a dashboard displaying on a single chart the current direction of up to 15 standard indicators and up to 21 timeframes. It has 2 different modes: Watcher mode: Multi Indicators User is able to select up to 15 indicators to be displayed User is able to select up to 21 timeframes to be displayed Watcher mode: Multi Pairs User is able to select any number of pairs/symbols User is able to select up to 21 timeframes to be displayed This mode uses one of the standard indicators
More from author
Enigmera
Ivan Stefanov
5 (8)
ENIGMERA: The core of the market The indicator’s code has been completely rewritten. Version 3.0 adds new functionalities and removes bugs that had accumulated since the indicator’s inception. Introduction This indicator and trading system is a remarkable approach to the financial markets . ENIGMERA uses the fractal cycles to accurately calculate support and resistance levels. It shows the authentic accumulation phase and gives direction and targets.  A system that works whether we are in a tre
Imbalance Pro
Ivan Stefanov
5 (3)
The indicator measures the imbalance between bulls and bears over a chosen period and shows a straight line in color between the two points right on your chart. Additionally indicator's window shows how exactly the volume developed in time. If the bulls have more volume than the bears, the line turns green.  If the bears have more volume, it is red. The line also shows the percentage difference in volume. Adjustable alert available.  Using volume imbalance in Forex trading can be a powerful
Levelss
Ivan Stefanov
5 (1)
The LEVELSS indicator shows: - Daily bullish and bearish zone. It is visible everyday from 00:00 to 23:59.  - The weekly bullish and bearish zone. It is visible from Monday 0:00 to Friday 23:59 every week. - Specially calculated channel from a specific timeframe that is displayed on all other timeframe. By default, this is the 4-hour timeframe that you can change to whichever other timeframe you wish to trade. It is calculated non-stop. At the top left of the screen there is an indication of t
Sense
Ivan Stefanov
5 (2)
SENSE is an automated fusion of  GANN target levels combined with fractal trend support lines. Mighty powerful combination. The system tells us where to open and close our trades. No redrawing.  No more wasting time on complex calculations— SENSE does it all for you. Just insert the indicator. Key Principles: Market is bullish when price is above the white lines - Buy above the white lines, stop below - Green lines are bullish targets Market is bearish when price is below the white lines - S
The indicator highlights zones where interests are being declared then shows their accumulation zone. It works like an order book in big scale. This is the indicator for the biggest money. It's performance is exceptional. Whatever interest there is in the market you will see it. ( This is a fully rewritten, automated version—manual analysis is no longer required.)  The Transaction Speed is a new concept indicator that shows where and when large orders accumulates on the market and benefits o
Meravith
Ivan Stefanov
The indicator analyzes volume from every point and calculates exhaustion market levels for that volume. It consists of three lines: - Bullish volume exhaustion line - Bearish volume exhaustion line - A line indicating the market trend. This line changes color to reflect whether the market is bearish or bullish. You can analyze the market from any starting point you choose. Once a volume exhaustion line is reached, identify a new point from which to start your next analysis. How to use it: Dou
This indicator accurately identifies bullish and bearish divergences between price movements and the MACD histogram, using Exponential Moving Averages (EMA) periods of 5 (fast), 34 (slow), and a signal line period of 5. The indicator highlights points where momentum weakens, signaling potential trend reversals.  Rules for Correct Divergence Identification Bullish divergence is valid when price forms lower lows and the MACD histogram simultaneously forms higher lows above the zero line. Bearish d
FREE
Legendary William Gann levels in a fully automated MT5 indicator. GANN Master pinpoints key zones where price is most likely to reverse or continue its trend based on daily, weekly and monthly figures. Key Features: One-click time period buttons. Click Daily, Weekly or Monthly to instantly plot the zones for today, the current week or month. Automatic and Manual modes. In automatic GANN Master computes all levels for you, no manual input required. In manual drag the Top and Bottom lines to defi
SPEKULATOR is a manual trading system and indicator that helps you identify key support zones and market direction. Master the market with a simple strategy and hidden wisdom! You choose any top and bottom on the chart, and the indicator draws: A support zone for your trend. For a bullish trend, a green zone appears; for a bearish trend, a red one. The support zone's sensitivity can be adjusted within the indicator. This zone indicates where support is likely to appear, based on your selected tr
Fifty Pro
Ivan Stefanov
5 (1)
One of the very few indicators that calculate levels solely based on price. The indicator is not affected by time frames, trends, or market cycles. One of the most logical indicators ever made. The indicator automatically calculates the daily levels of interest for market participants based on the activity from the previous day. It also calculates weekly, monthly, and yearly levels based on the activity from the previous week, month, or year. Combining everything this way, every day you know exa
Two Snakes
Ivan Stefanov
5 (1)
2 SNAKES  is a first class scalping system. As the entries are quite precise, you are likely to become addicted to this system very quickly.  You have 2 snakes. When you see a candle above or below them that does not touch them - that is your scalping signal. Then buy or sell at the green line or close. If you use a larger time frame, scalping can become trend following. The snakes are calculated precisely in relation to the current state of the market. They ARE NOT moving averages.  You decide
Separated Volume
Ivan Stefanov
5 (1)
This indicator effectively separates the tick volume in the forex market into bullish and bearish categories. Additionally, it provides the functionality to calculate and display the sum of bullish and bearish tick volumes for any selected period of your choice. You can easily adjust the period by moving the two blue lines on the chart, allowing for customizable and precise volume analysis tailored to your trading needs. If you find it usefull your reviews will be appreciated! Happy trading!
FREE
This indicator is based on practical experience.  Insert the date/time of your top/bottom. It calculates the most visited level from top/bottom up to the current moment. It updates automatically with each new candle. You can simultaneously use multiple indicators for different trends and timeframes. The length is always plotted from the beginning of your period to the present. Recommendations: Currency pair: All pairs, all markets Timeframe: All timeframes Minimum deposit : No minimum deposi
FREE
GANN Master
Ivan Stefanov
5 (1)
Master GANN’s precise targets are calculated based on his time-tested methods and presented right in front of you. This tool is designed to make trading smoother and more intuitive. By adjusting the white line upwards or the green line downwards, you’ll immediately see the reason GANN's techniques remain influential in the world of trading. GANN’s strategies revolve around predicting market movements with a high degree of accuracy, and this tool brings that power to your fingertips. Whether you’
Naturu MT4
Ivan Stefanov
'Naturu' is a manual indicator that uses nature’s symmetry as its algorithm. Master the market with a simple strategy and hidden wisdom!   When you load the indicator, you’ll see two lines—Top and Bottom. Click once on a line to activate it. To move it, simply click on the candlestick where you want it placed. You define a high point and a low point, and the indicator then calculates: A magenta zone showing where bulls’ and bears’ interests are closest—that is, the area with the highest potent
Naturu
Ivan Stefanov
'Naturu' is a manual indicator that uses nature’s symmetry as its algorithm. Master the market with a simple strategy and hidden wisdom!   When you load the indicator, you’ll see two lines—Top and Bottom. Click once on a line to activate it. To move it, simply click on the candlestick where you want it placed. You define a high point and a low point, and the indicator then calculates: A magenta zone showing where bulls’ and bears’ interests are closest—that is, the area with the highest potent
Filter:
Gabriel De Araujo Lobo
1322
Gabriel De Araujo Lobo 2025.06.18 15:48 
 

It's amazing how this works, excellent to add to strategies that use price action. Excellent attention given by the seller

Vasyl Daki
459
Vasyl Daki 2025.06.16 18:55 
 

I bought this indicator mostly because of the reviews because I couldn't test it with the demo version to the full extent. After the purchase, I started checking the system's operation on history. During the check, I found that the indicator gives weak results. My first observation concerns the fact that after the trend has changed and I notice it and of course I set the indicator to the top point of the beginning of the downward trend at the next price touch of the main support line and the formation of a pattern for concluding a deal to sell in 50% of cases the market turns around and goes against the pattern or makes a deep correction that confuses the indicator and it can create a false pattern that creates new losses, the same applies to patterns to buy. When working with this indicator, there is no sense of control over the market. That is, there is some interval where the indicator works very well, but then there comes an interval where the indicator shows bad results. I still couldn't understand what its advantage is and how you can make money with it. In my opinion, its price is 40 dollars. If the author thinks otherwise he can write a program for a profitable robot based on this indicator, I would be happy to test this robot.

Ivan Stefanov
3826
Reply from developer Ivan Stefanov 2025.06.18 12:38
Dear Mr. Daki, I deeply regret your dissatisfaction; however, the facts of our interactions clearly indicate a different situation. Immediately after your purchase, I proactively provided extensive support, offering multiple channels (email, Telegram) to clarify any questions. Despite several attempts to help you, you consistently refused to provide any concrete examples or screenshots of your claimed issues, making it impossible to assist you effectively. When I offered a full refund, you supplied inconsistent payment details with multiple conflicting identities—first a Bulgarian name, then an Arabic one, and later cryptocurrency addresses in romanian language—raising legitimate concerns about the authenticity of your claims. Enigmera is a proven system, highly rated and validated by numerous satisfied traders. Each customer requesting a trial receives full access to test thoroughly before buying. Your allegation that testing was impossible is false and contradicts clear evidence. Moreover, records show that you never downloaded a demo from the location of your purchase (Norway), which raises further doubts about your claims to have tested the system thoroughly. Given your pattern of threats and suspicious behavior, I have escalated this issue to mql5.com for further investigation. Transparency and integrity are fundamental to my practice. Any interested parties may request full documentation of our communication to verify the truthfulness of my statements. Regards, Ivan Stefanov Enigmera Support
Nath
129
Nath 2025.05.26 06:35 
 

This is the best indicator I have used to date. It is worth every dollar. Ivan promptly clarified all my 'humble' questions, supporting a very effective use of the indicator. He also provides a lot of supporting material. **Also available on Tradingview Ivan, thanks again, you genius!

Reply to review