
KAMA Confluence Engine
- Indicators
- Version: 2.61
- Updated: 27 September 2026
- Activations: 20

KAMA Confluence Engine
KAMA Confluence Engine is a multi-timeframe trend indicator for MetaTrader 5 built on Kaufman's Adaptive Moving Average (KAMA) and tick volume. It shows the trend as a coloured ribbon, gives buy and sell signals checked on four timeframes, and draws a complete trade plan on the chart: entry, Stop Loss and three Take Profit levels, with a scanner of the pairs to trade and alerts. Works on Forex, gold (XAUUSD), indices and crypto.A moving average reacts to a real move and to random noise in the same way. KAMA adapts instead: it follows price closely when the market moves efficiently and slows down when the market moves sideways. In this version the Efficiency Ratio is also weighted by tick volume, so a move with volume behind it is followed faster than a move without it.
What you see on the chart
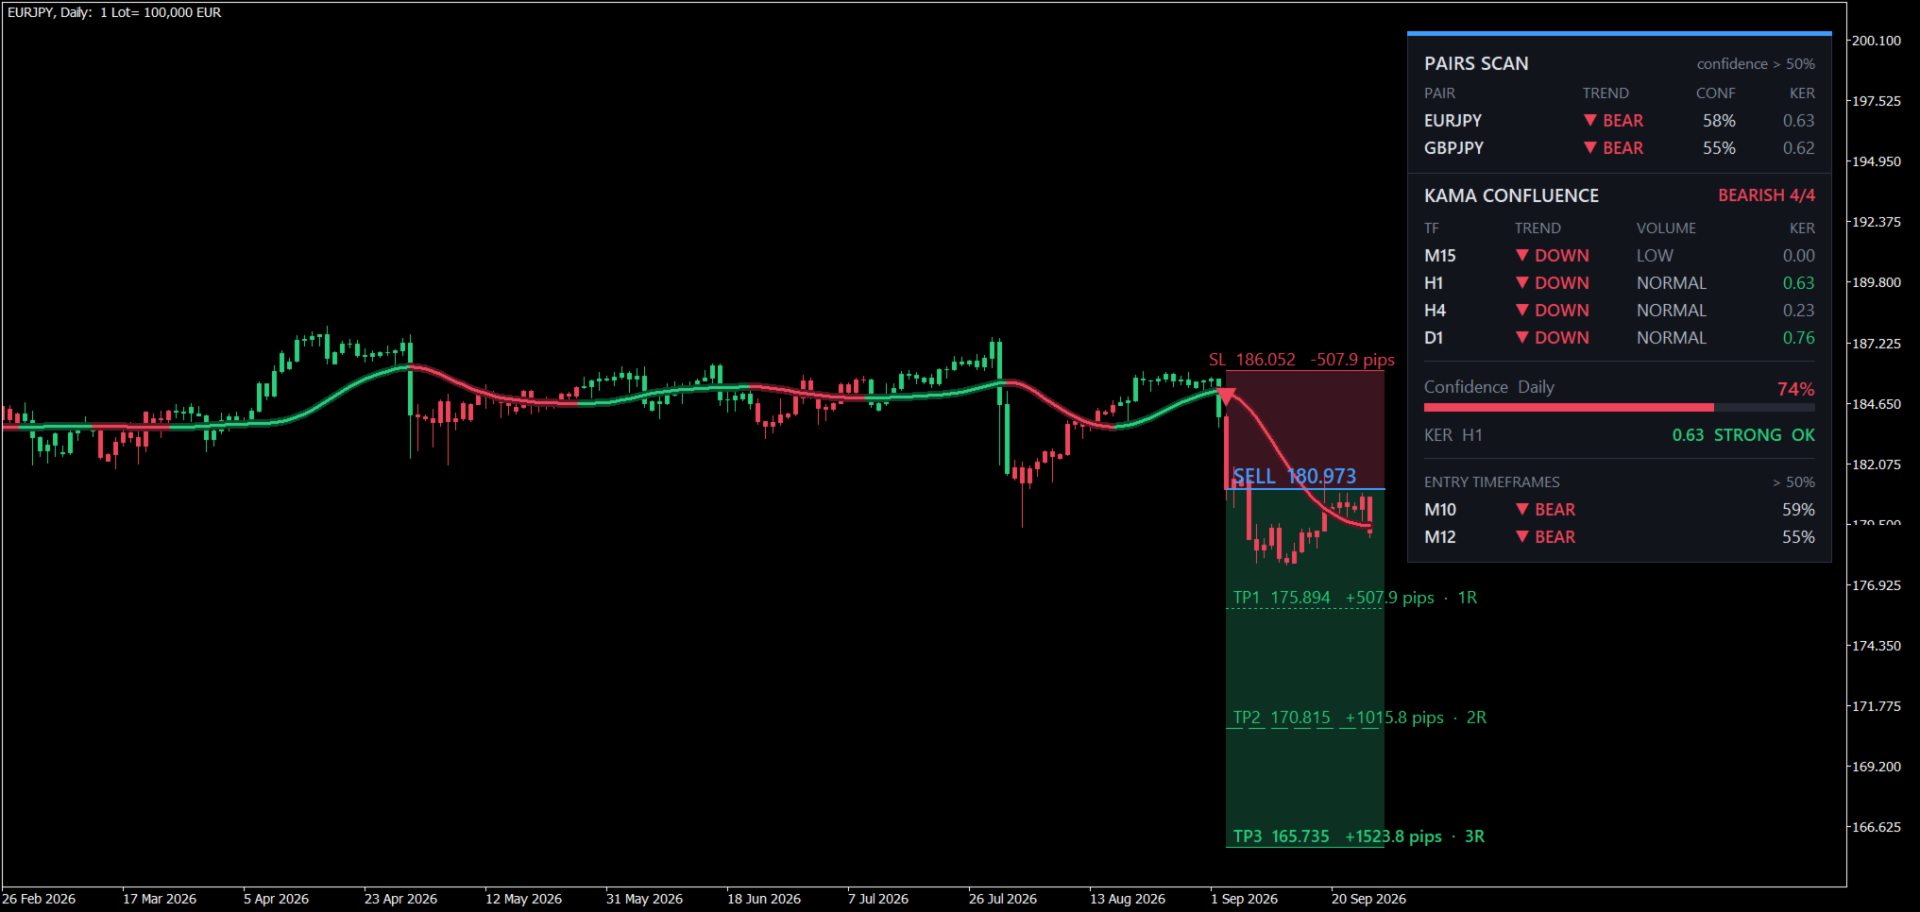
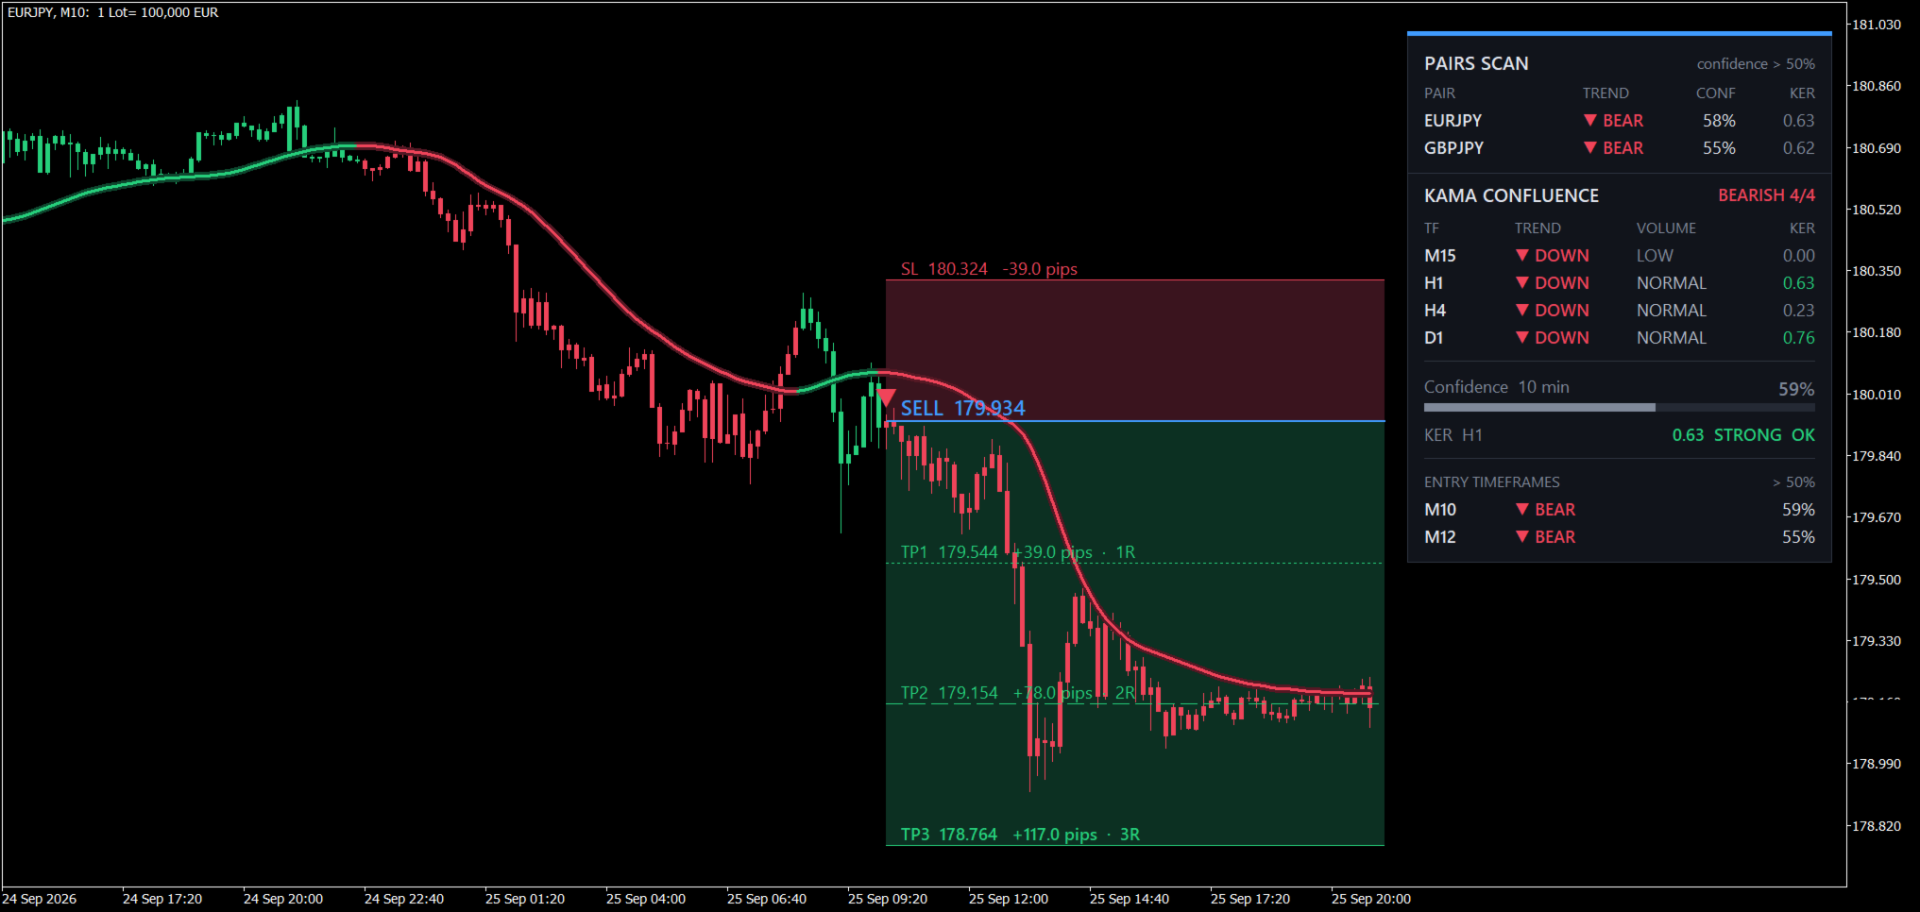
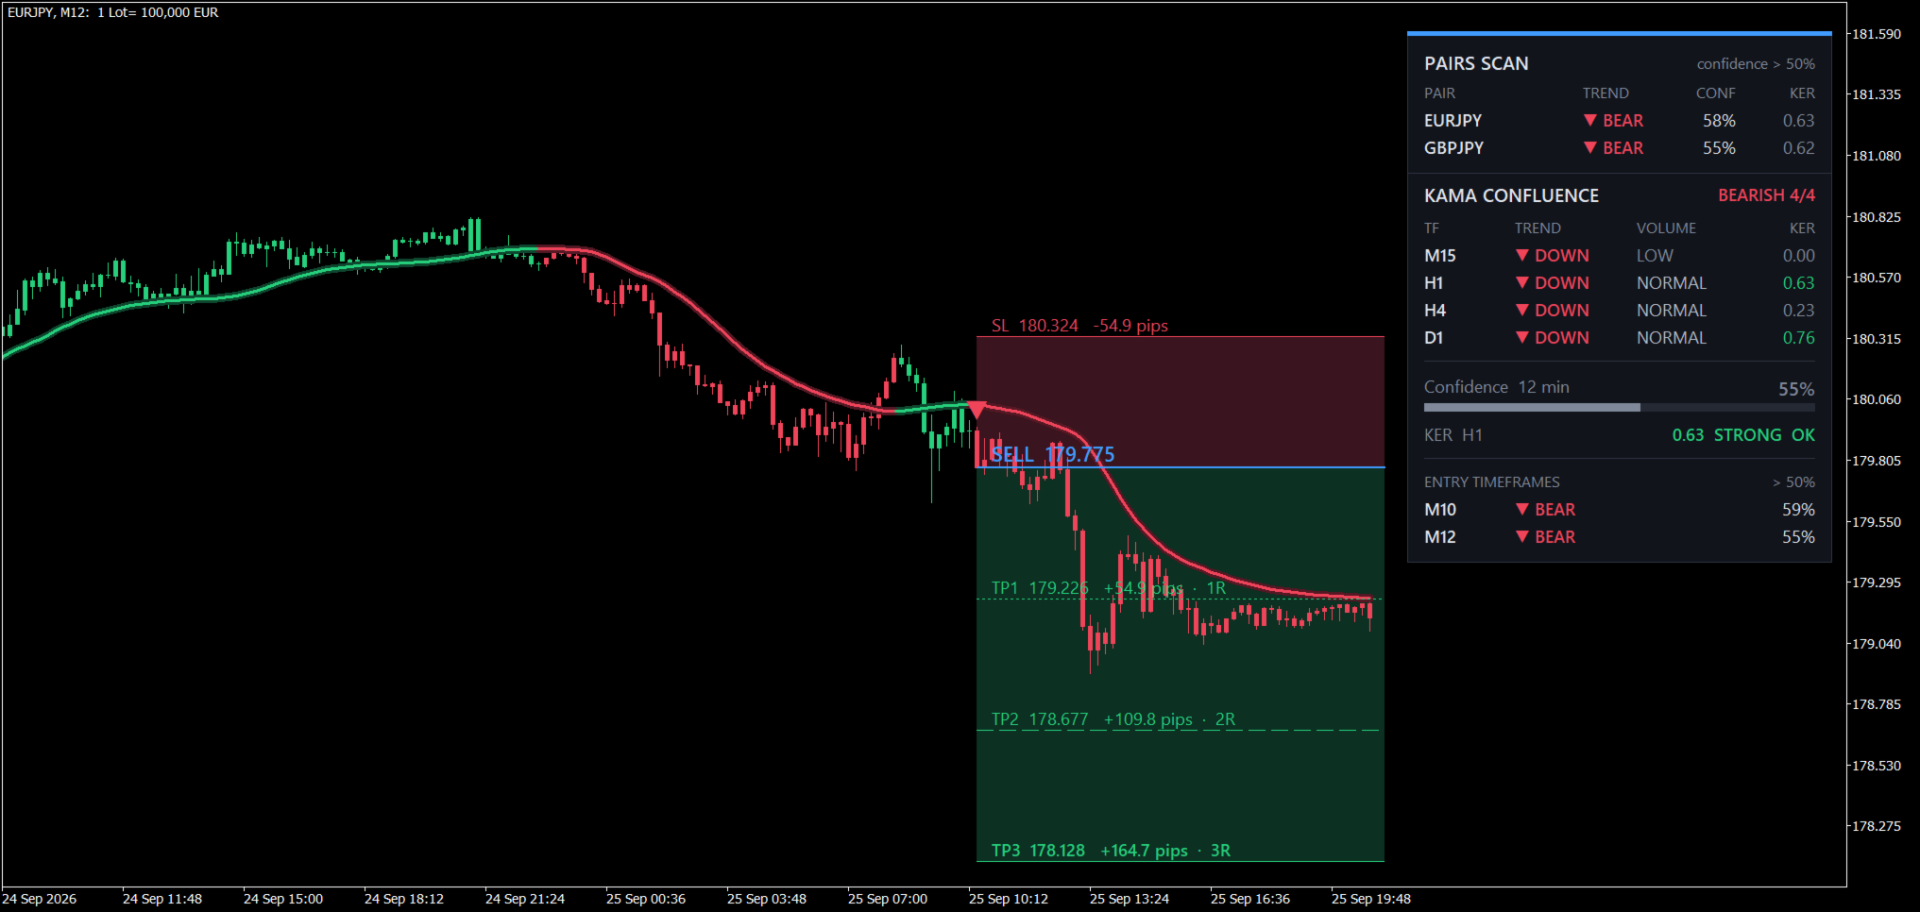
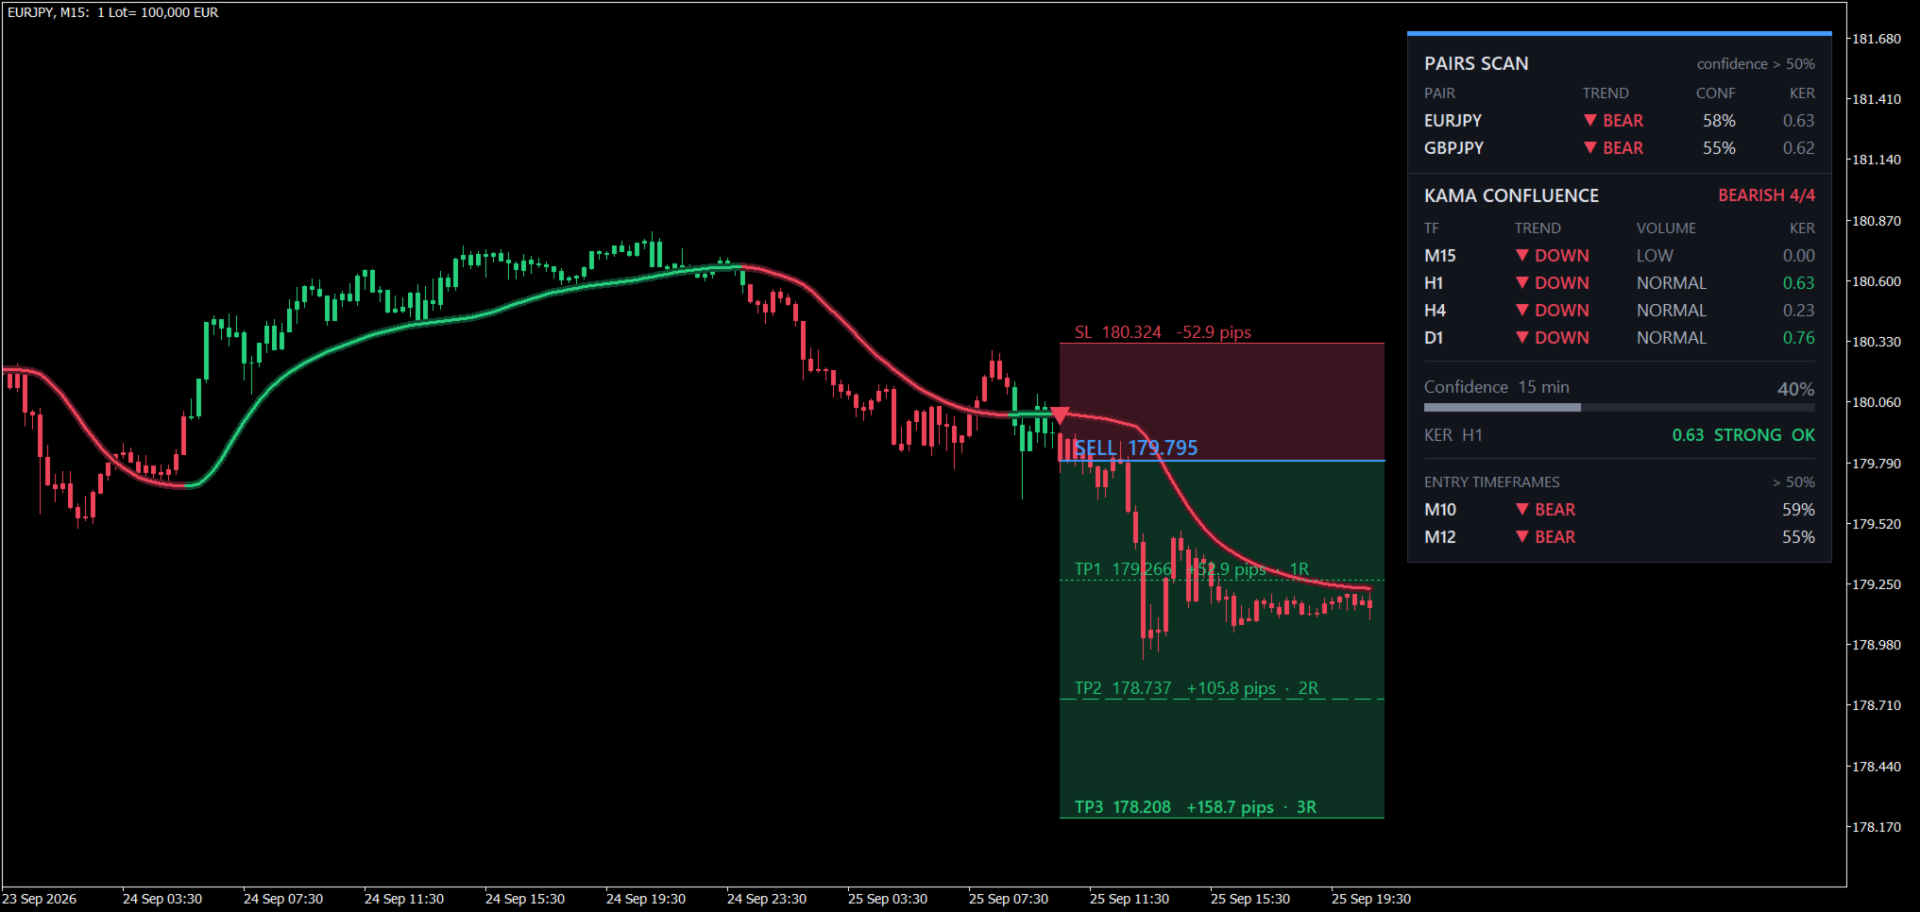
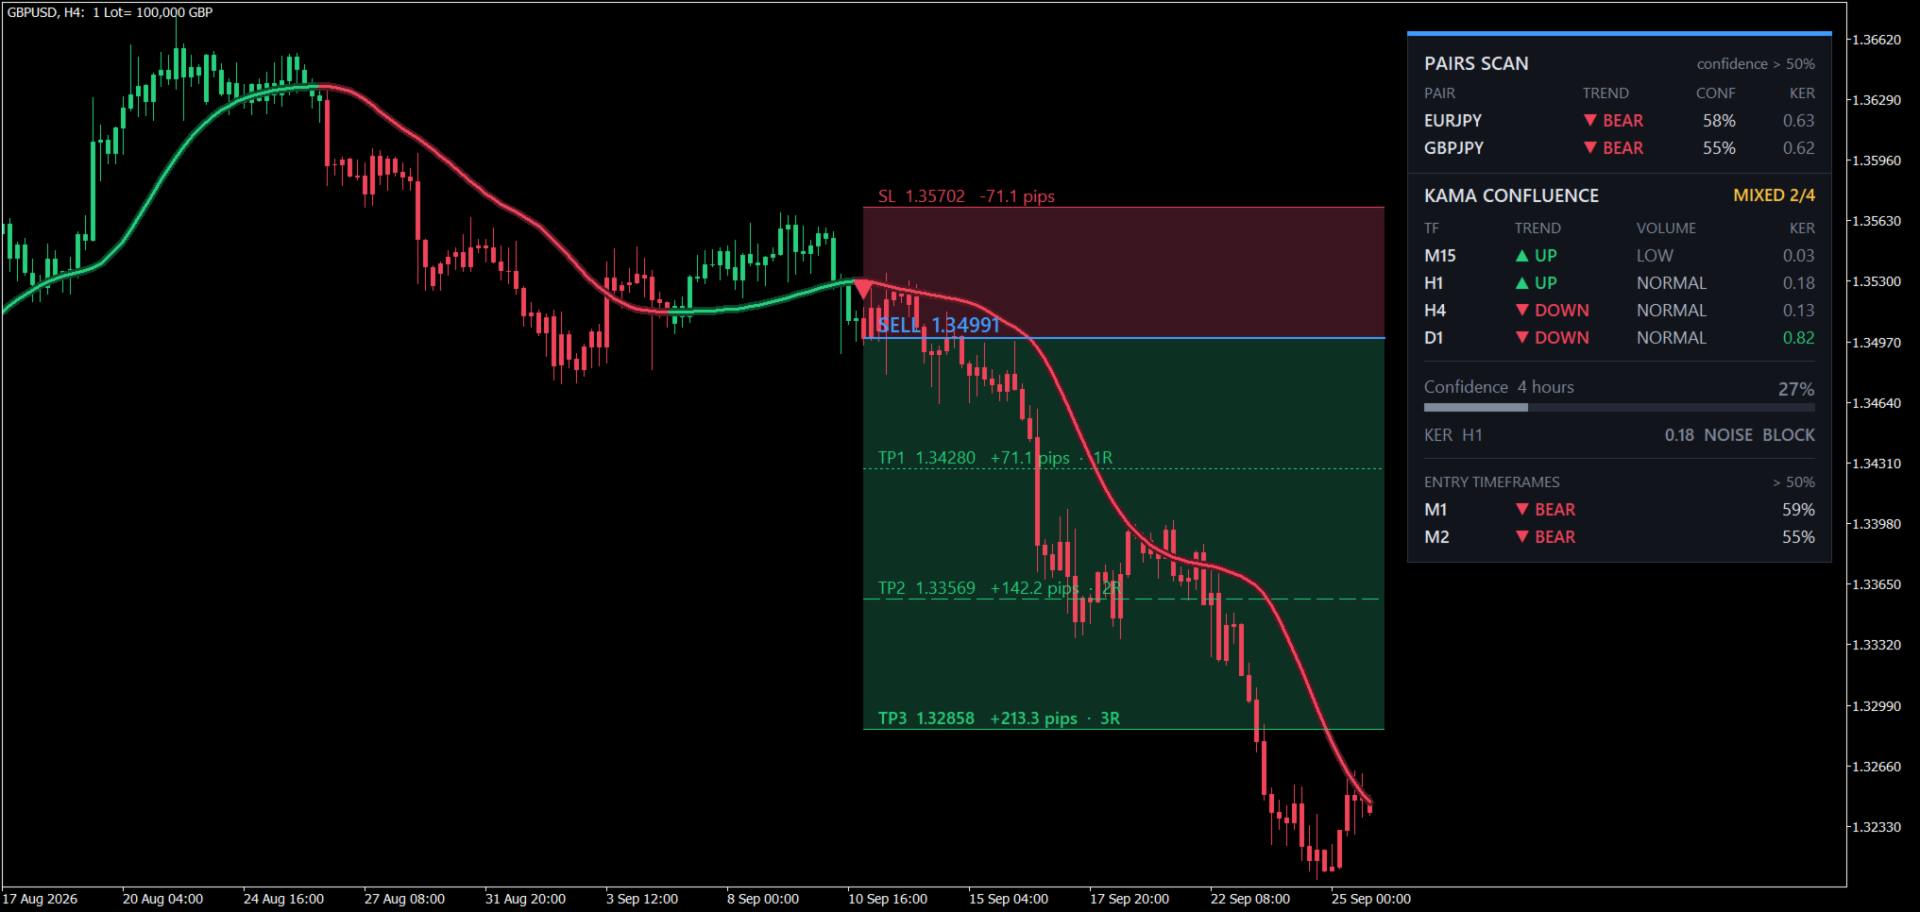
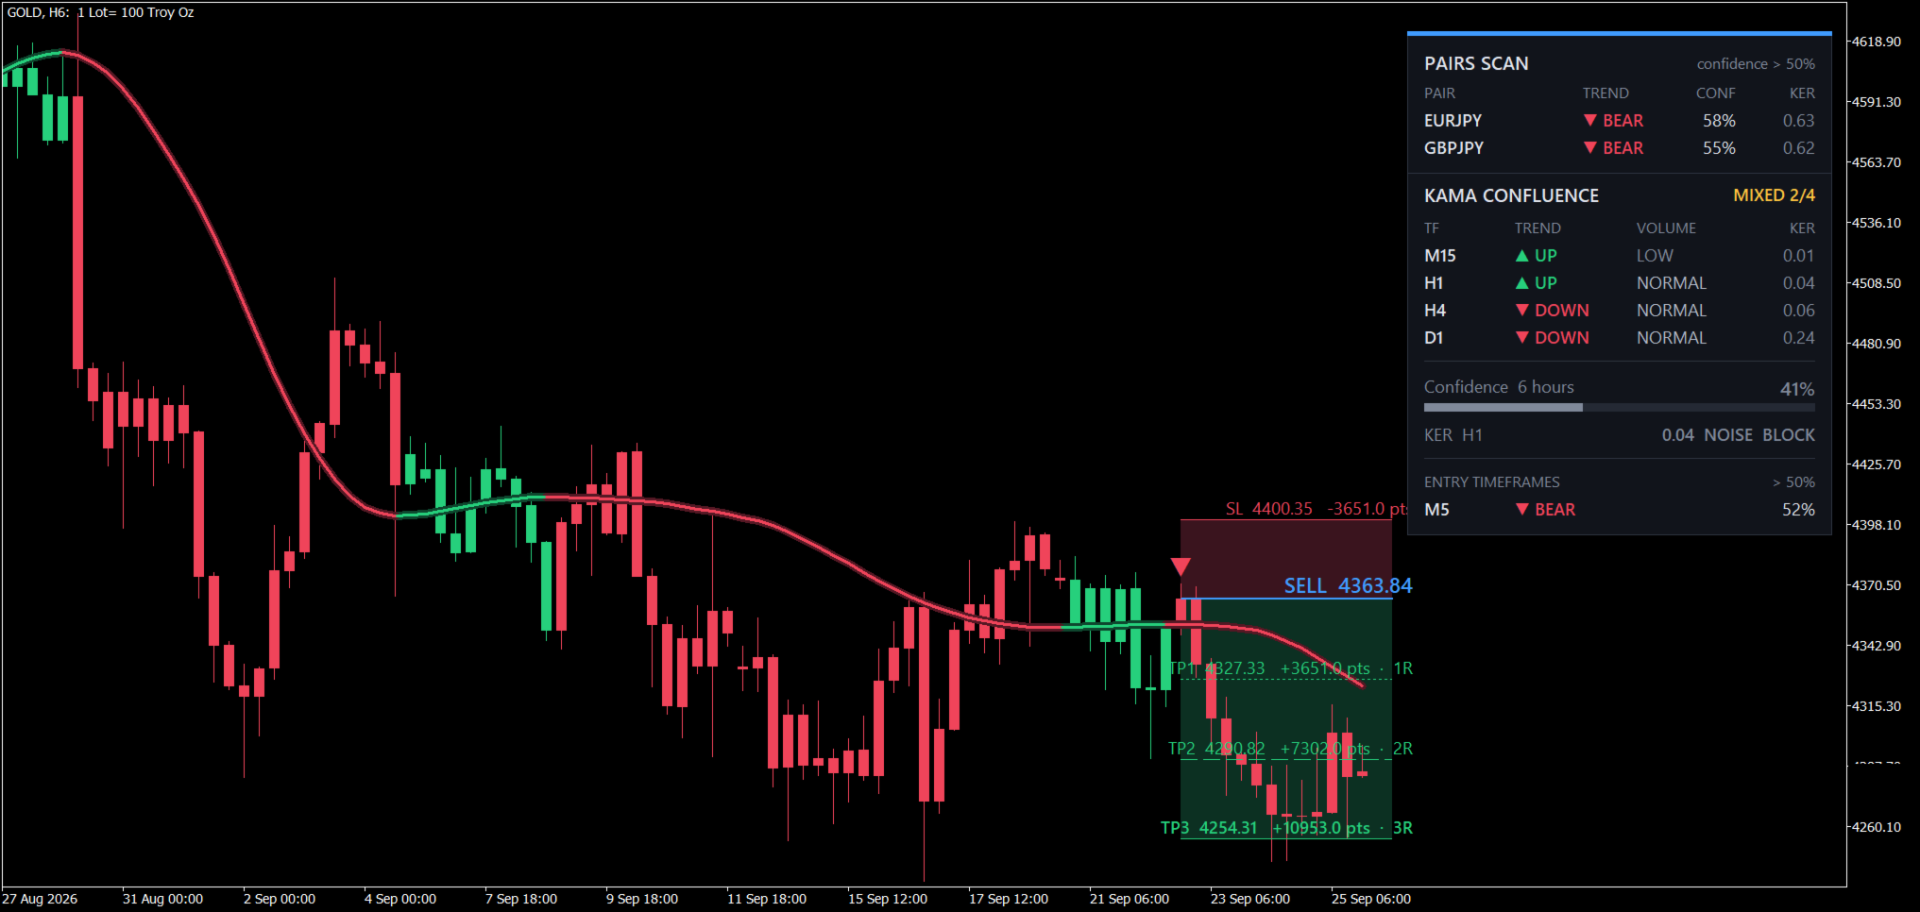
The ribbon. Green when the trend is up, red when it is down, gray when there is no clear trend. The candles take the same color, so the state of the market is visible at a glance.
The signal. When the ribbon changes color, a triangle marks the candle where the trend turned. That candle is the entry.
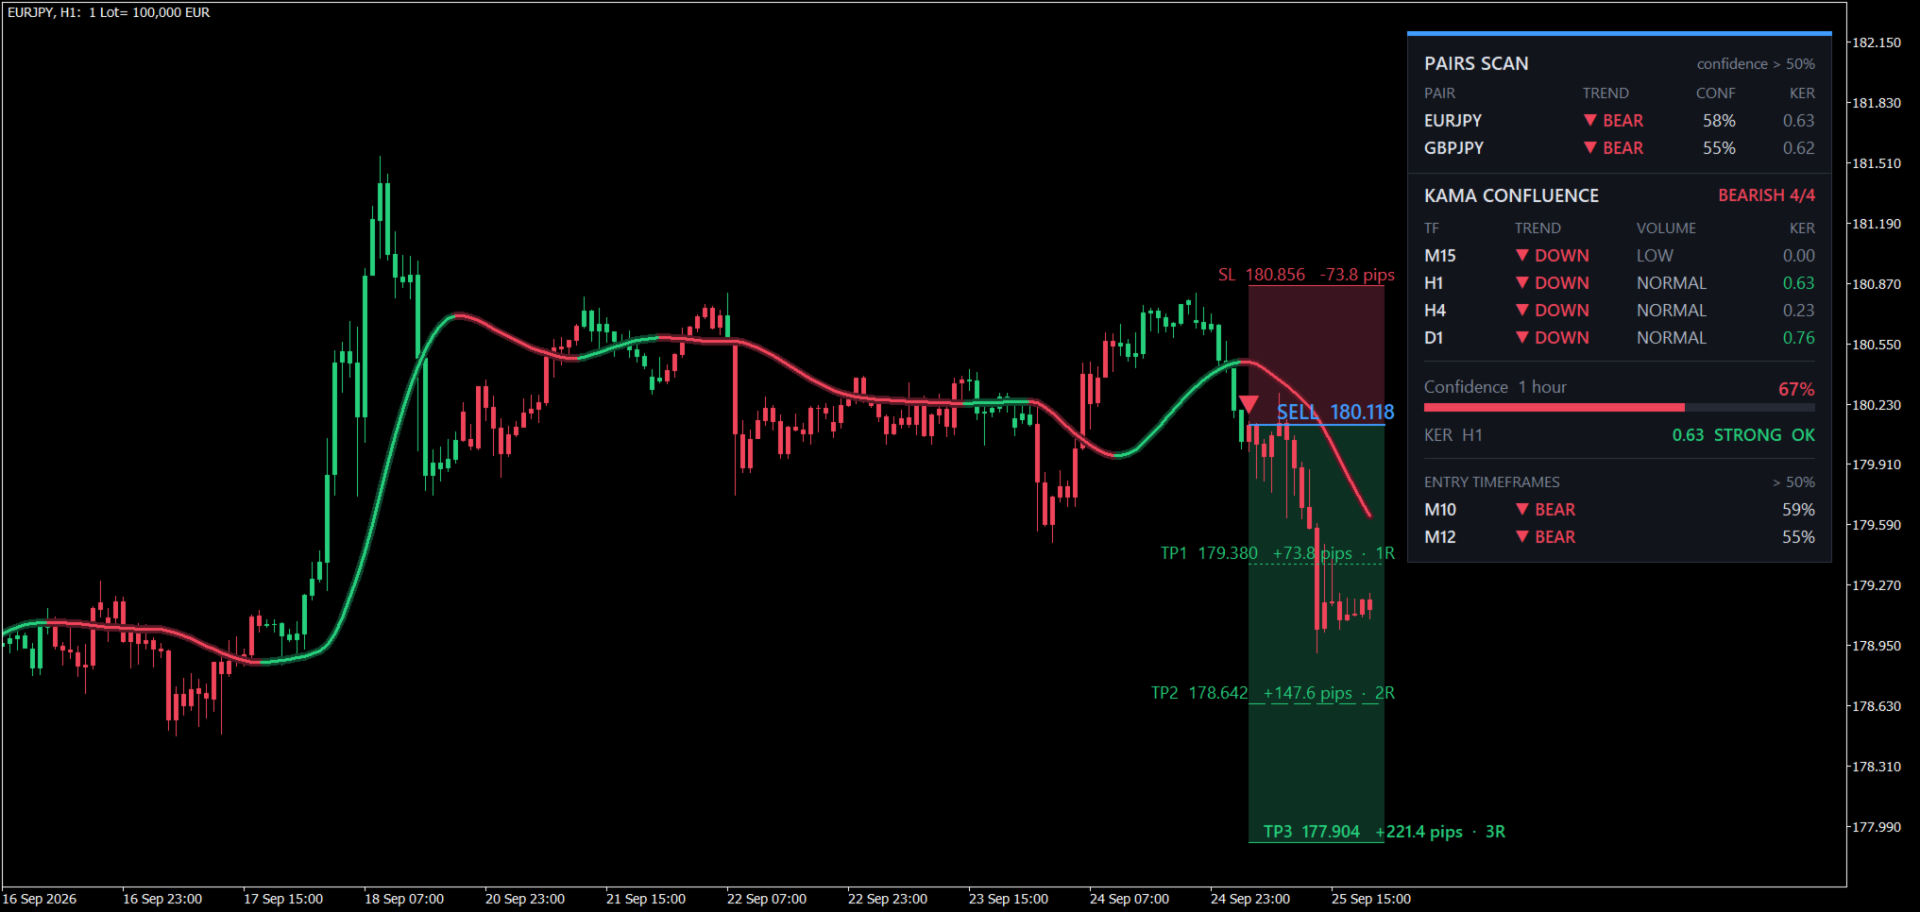
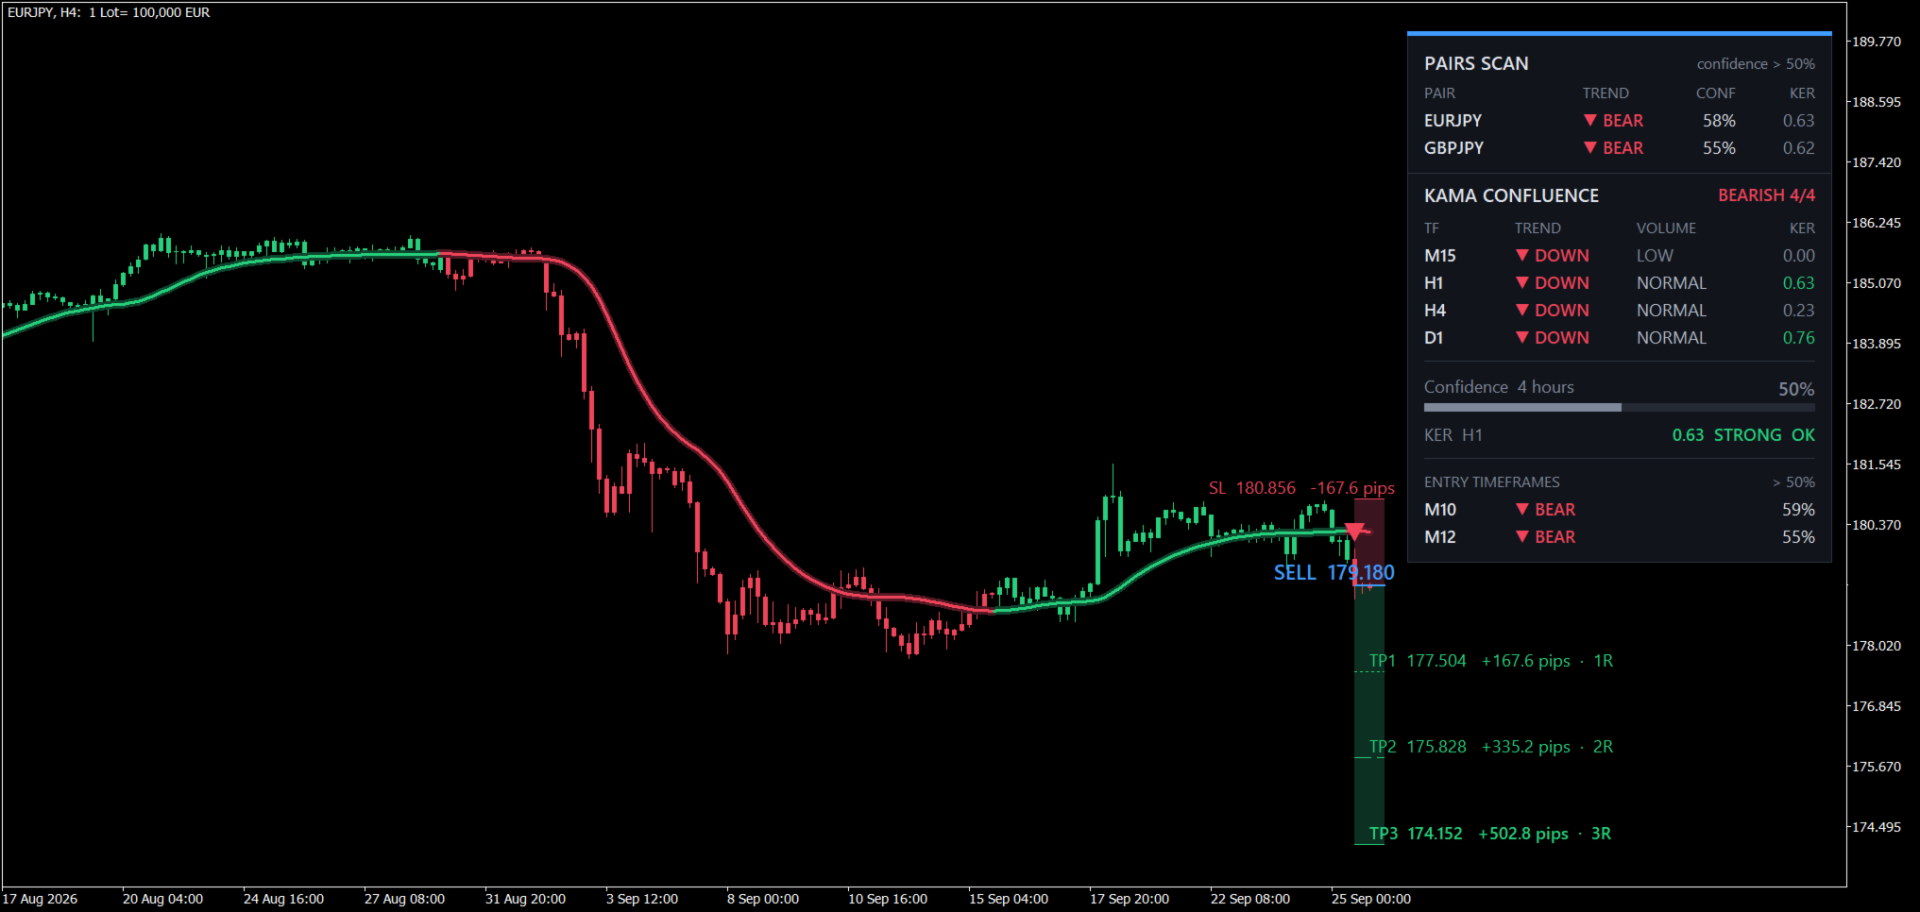
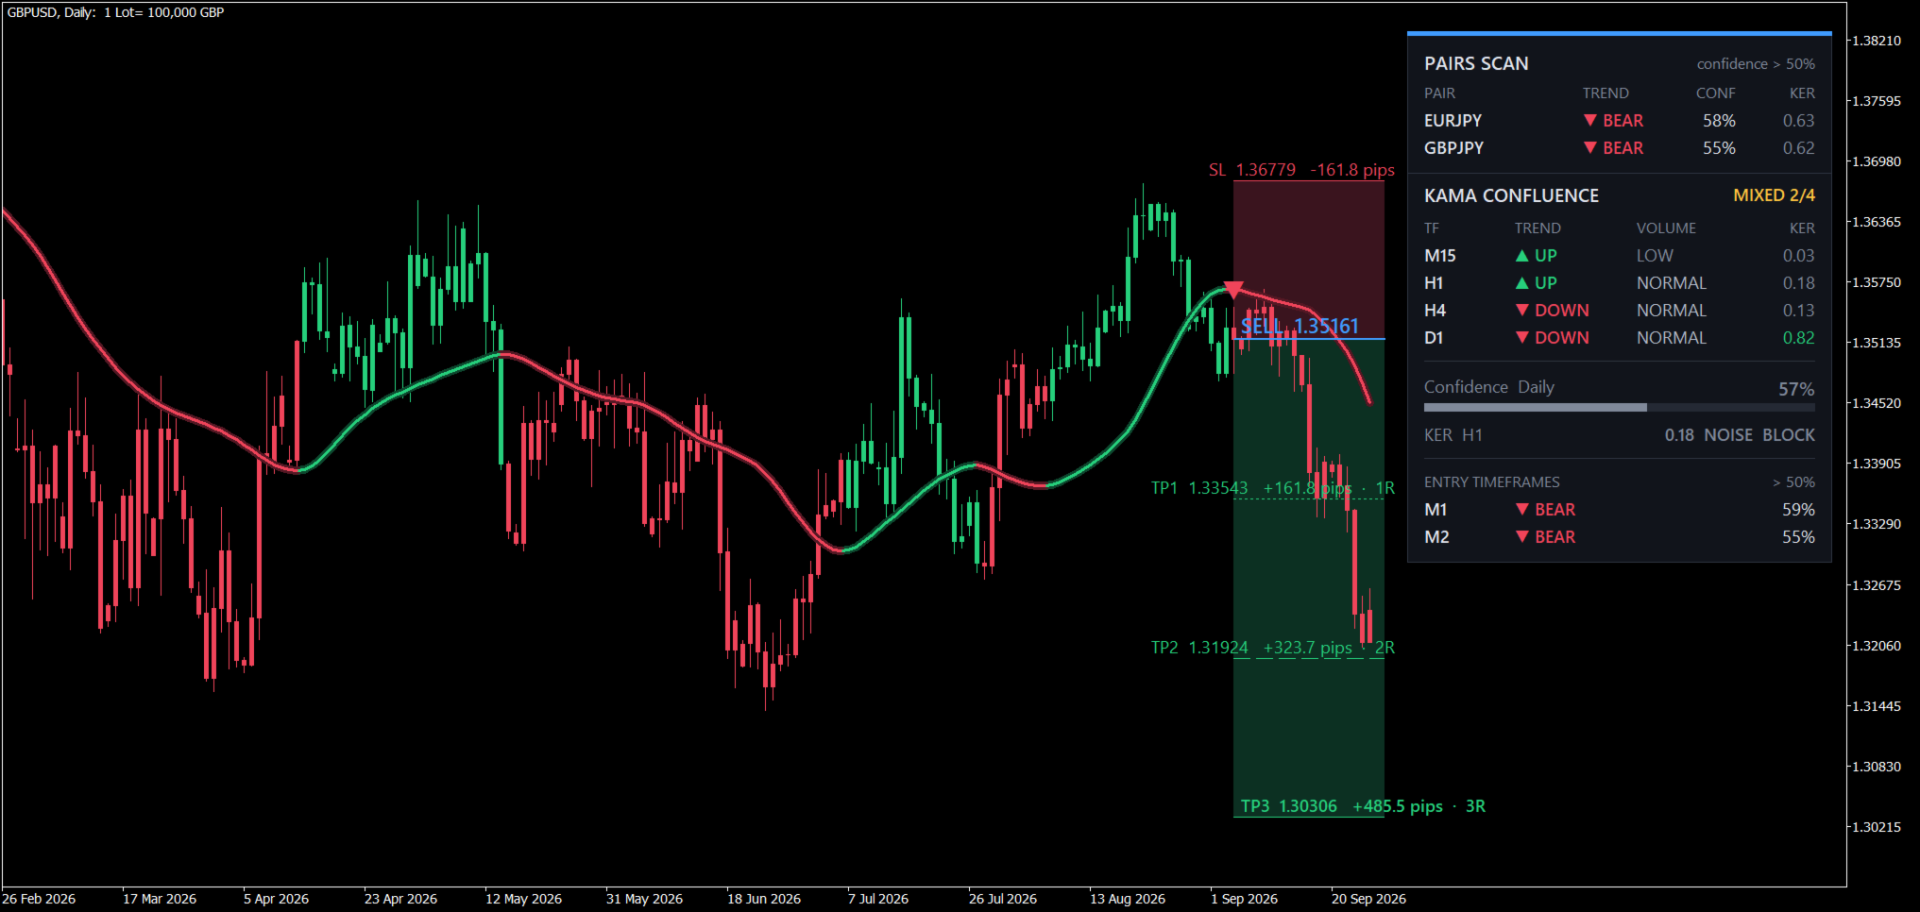
The trade levels. The Stop Loss is placed behind the last swing high (for a sell) or the last swing low (for a buy). Take Profit 1, 2 and 3 are set at one, two and three times that risk. Each level is labeled with its price and its distance in pips. The risk area and the reward area are shaded, so you see the size of the trade before you open it.
The panels
Multi-timeframe panel. The direction of the ribbon on M15, H1, H4 and D1, the volume status on each timeframe and its Efficiency Ratio. The header shows how many of the four timeframes agree, for example "Bearish 4/4".
Confidence. A score from 0 to 100 percent for the current timeframe, combining the Efficiency Ratio, volume and the agreement of the four timeframes. It is shown as a number and as a bar.
Efficiency filter. The Kaufman Efficiency Ratio of a leading timeframe (H1 by default) tells whether the market is trending or noisy. Below the minimum you set, signals are blocked. A warning appears when the ratio on H4 or D1 starts to fall.
Entry timeframes. The lower timeframes where the same direction currently has confidence above your threshold and the last signal has not yet reached Take Profit 3. Click a row to switch the chart to that timeframe.
Pairs scan. All symbols in your Market Watch, filtered by confidence and by the efficiency filter and sorted by confidence. Click a pair to open it on the chart.
The panels scale with your screen settings. The chart is shifted to the left so the panels do not cover the candles.
How to use it, step by step
Step 1. Choose the pair. Open the pairs scan and pick a pair near the top of the list.
Step 2. Check the direction. In the multi-timeframe panel, look for at least three of the four timeframes pointing the same way. If they disagree, wait.
Step 3. Choose the entry timeframe. Use one of the timeframes listed under Entry timeframes.
Step 4. Enter on the triangle. Sell when the ribbon turns red, buy when it turns green, with confidence above your minimum.
Step 5. Manage the trade with the drawn levels. For example, take part of the position at Take Profit 1, move the stop and let the rest run to Take Profit 2 and 3. Close the trade if the ribbon turns against you.
Alerts
Alerts for filtered signals (popup, sound, push notification, e-mail) and a separate alert when the ribbon changes color. All alerts are off by default. Turn on only the ones you need.
Main settings
- KAMA: Efficiency Ratio period, fast and slow periods, applied price, smoothing.
- Volume: volume weighting and its strength, thresholds for high and low volume.
- Timeframes: the four timeframes of the panel, the leading timeframe of the efficiency filter and its minimum.
- Signals: minimum confidence, volume and multi-timeframe confirmation.
- Trade levels: bars used to find the last swing, the stop buffer, the risk-to-reward multiples of the three targets, shaded zones on or off, colors.
- Appearance: ribbon and glow width, candle coloring, panel position.
Notes
- The indicator does not open, change or close trades. It works on any symbol and timeframe.
- Signals and alerts are evaluated on closed bars. The ribbon on the current, unfinished bar can still change until the bar closes.
- To use the pairs scan, add the symbols you want to scan to Market Watch so that the terminal can load their history.




















































★★★★★ — Un indicatore completo e ben progettato Il KAMA Confluence Engine di Ivan è molto più di un semplice indicatore di tendenza: è uno strumento completo che integra trend, volume, confluenza multi-timeframe e qualità del segnale in una lettura chiara e immediata. La linea KAMA si adatta alla dinamica del mercato, diventando più reattiva nei movimenti sostenuti e filtrando il rumore nelle fasi meno direzionali. I colori permettono di riconoscere rapidamente trend rialzisti, ribassisti e situazioni laterali. Particolarmente utili sono il Confidence Score, che valuta l’affidabilità del setup, e i livelli automatici di entrata, Stop Loss e tre Take Profit configurabili in base al rapporto rischio/rendimento. Anche gli avvisi possono essere filtrati attraverso volume, confluenza tra time frame e livello minimo di affidabilità, riducendo i segnali poco significativi. L’indicatore offre inoltre numerose possibilità di personalizzazione e può adattarsi a differenti stili operativi. Naturalmente non sostituisce l’analisi e la gestione del rischio, ma rappresenta un valido supporto per leggere il mercato con maggiore ordine e consapevolezza. Complimenti a Ivan per aver realizzato uno strumento professionale, intuitivo e curato nei dettagli. Un indicatore serio e ben strutturato, che consiglio a chi cerca conferme operative chiare senza appesantire il grafico.