GANN Master MT5
- Indicators
- Version: 1.52
- Updated: 9 August 2026
- Activations: 10

GANN Master MT5 — non-repainting Gann support and resistance levels for any instrument and any timeframe.
Know where price is likely to react — before it gets there.
GANN Master maps the daily, weekly and monthly reaction levels of any instrument using W. D. Gann's square-of-nine algorithm. One click and your chart shows the support, resistance and breakout levels that the market is most likely to respect for the session, the week or the month ahead.
The levels are calculated from closed data only. They do not move, they do not repaint and they do not need a confirmation candle. What you see at the open of the period is what you will see at the close of it.
Works on Forex, indices, metals, crypto and stocks, on every timeframe.
WHAT YOU SEE ON THE CHART
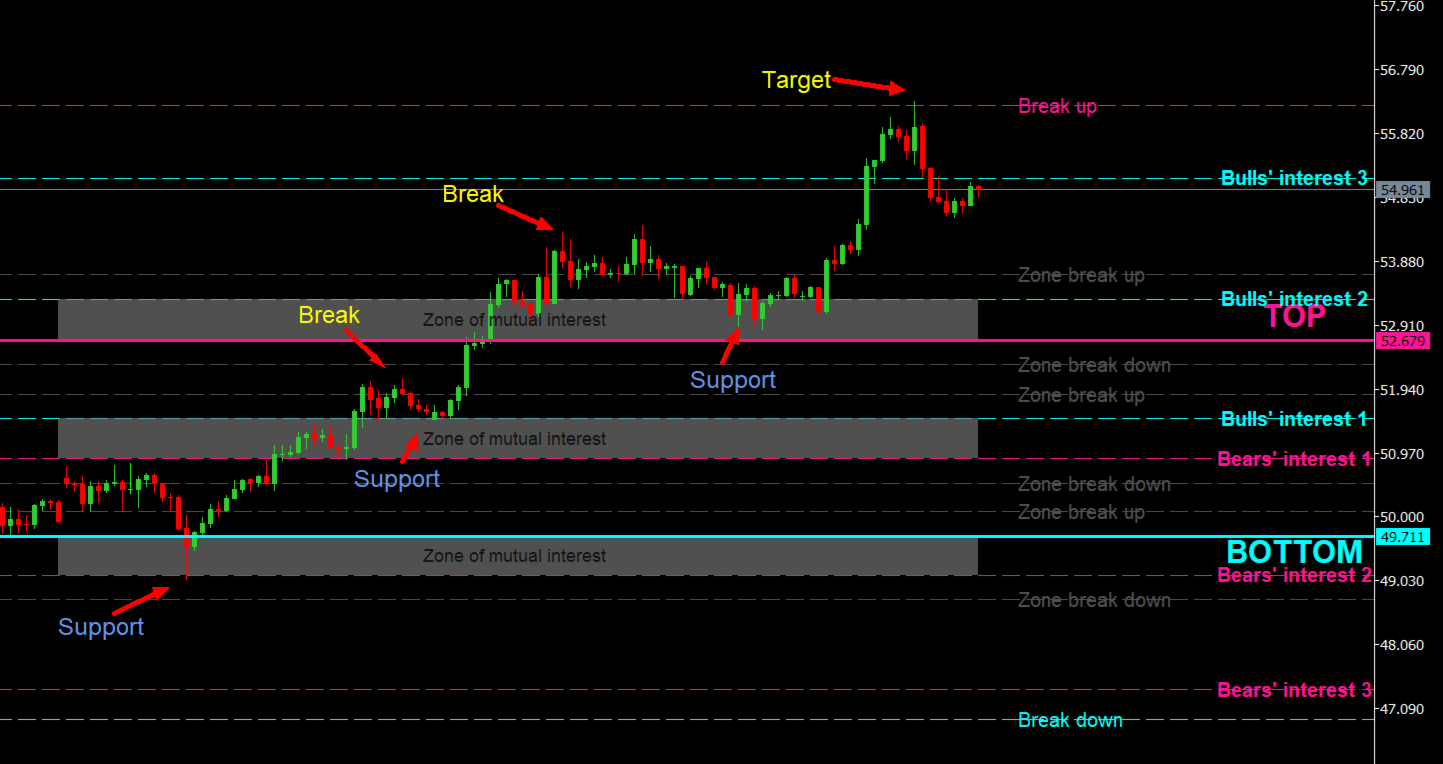
TOP and BOTTOM — the previous day's, week's or month's high and low. These two lines are the reference frame of the entire calculation.
Bulls' interest 1, 2 and 3 — the upside levels at which buying pressure is statistically absorbed.
Bears' interest 1, 2 and 3 — the downside equivalents.
Zone of Mutual Interest — the areas where bullish and bearish levels converge. These are the areas in which price has both an upside and a downside reference at the same time, and where reactions are most often visible on the chart.
Zone break up and Zone break down — the levels that invalidate a zone. A close beyond them turns support into resistance, or the reverse.
Target — the projected objective once a zone has been broken.
Daily, Weekly and Monthly buttons — switch the entire map with one click, without reloading the indicator or changing the chart.
ON/OFF button — remove every element from the chart instantly and restore it just as fast.
HOW TO TRADE IT
-
Choose your horizon. Daily for intraday trading, Weekly for swing trading, Monthly for position trading.
-
Locate the nearest Zone of Mutual Interest. This is your decision area. Work with the zone, not with a single line — the market respects areas, not exact prices.
-
Trade the reaction. Price arriving at a zone from below and stalling inside it is a short setup. Price arriving from above and holding above it is a long setup. Enter at the edge of the zone, place the stop loss beyond the opposite edge.
-
Trade the break. A close beyond the Zone break up or Zone break down level flips the role of the zone. Enter on the retest, place the stop loss on the far side of the broken zone and use the Target line as the objective.
-
Combine two horizons. A Daily zone that falls inside a Weekly zone is confirmed by two independent calculations. When the two horizons disagree, the higher one has priority.
-
Stay out of the middle. The space between two zones carries no information. The tool is designed to keep you waiting at the levels that matter instead of trading the noise in between.
RECOMMENDED USE
Instruments: any liquid instrument with a clean daily high and low — XAUUSD, EURUSD, GBPUSD, USDJPY, US30, NAS100, BTCUSD.
Timeframes: M15 to H1 in Daily mode, H1 to H4 in Weekly mode, H4 to D1 in Monthly mode. The calculation itself is timeframe-independent; the timeframe only determines how much detail you see inside the zones.
Trading style: manual intraday, swing and position trading. GANN Master is an analytical tool — it does not open, modify or close positions.
INPUTS
Calculation
Calculation mode — the mode loaded on startup: Daily, Weekly or Monthly. Can be changed at any time with the on-chart buttons.
Show Zones of Mutual Interest — draw the convergence zones on or off.
Levels and colours
TOP / BOTTOM colour — colour of the previous period's high and low.
Bulls' interest colour — colour of the three upside levels.
Bears' interest colour — colour of the three downside levels.
Zone colour — fill colour of the Zones of Mutual Interest.
Zone break colour — colour of the Zone break up and Zone break down levels.
Target colour — colour of the projected objective.
Line width — thickness of all level lines.
Labels and panel
Show labels — display the name of each level on the chart.
Label font size — size of the level labels.
Panel corner — the chart corner in which the button panel is placed.
Panel X offset / Panel Y offset — fine positioning of the button panel.
Every visual parameter is adjustable, so the indicator can be matched to any chart template, light or dark.
WHY IT IS DIFFERENT
Non-repainting by construction. The levels are derived from the previous closed period. Once drawn, they never move, so what you see on historical data is what you would have seen in real time.
Nothing is optimised and nothing is fitted. The algorithm is arithmetic, not a model trained on past data. It behaves identically on a symbol it has never seen and in a market regime that has never occurred before.
Zones instead of lines. A single Gann line is easy to dismiss. A convergence of several of them defines an area rather than a price, and that is what this indicator isolates for you.
Three horizons, one chart. Intraday, swing and position levels from the same window, switchable in one click.
Universal. No symbol list, no preset per broker, no per-instrument tuning. Load it and it works.
REQUIREMENTS
MetaTrader 5.
Any broker and any account type.
No additional indicators, libraries or DLLs required.
AFTER PURCHASE
Send me a private message after purchase and I will send you the setup guide with the recommended configuration per instrument class, together with the chart template used in the screenshots above.
Questions before buying are welcome. I answer every message personally.
A NOTE ON THE STRATEGY TESTER
GANN Master is an interactive tool with on-chart buttons. In visual test mode, press the Daily, Weekly or Monthly button once to calculate the levels for the tested period. On a live chart the calculation is automatic.