Pivot Point Fibo RSJ
- Indicators
-
JETINVEST
 Roberto Junqueira, is Trader for over 20 years and has been developing indicators and trading experts for more than 10 years for the Forex, Cryptocurrencies and Stock Exchanges markets.
 - Version: 1.0
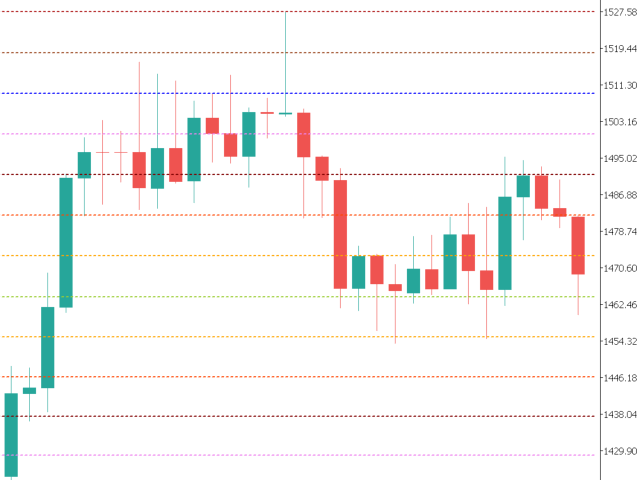
Pivot Point Fibo RSJ is an indicator that traces the support and resistance lines of the day using Fibonacci rates.
This spectacular indicator creates up to 7 levels of support and resistance through Pivot Point using Fibonacci rates.
It is fantastic how the prices respect each level of this support and resistance, where it is possible to perceive possible entry/exit points of an operation.
Features
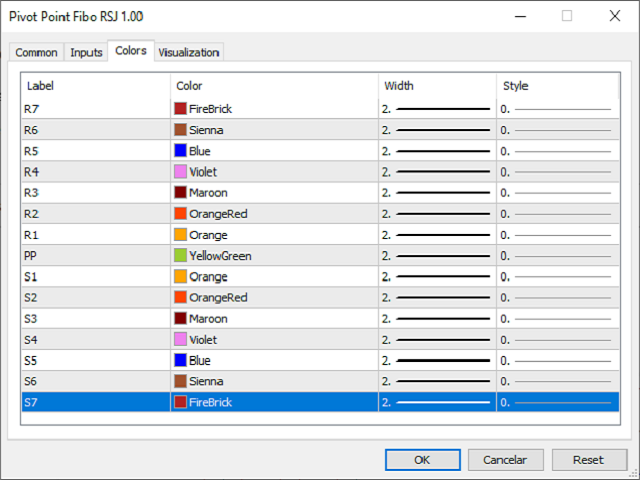
- Up to 7 levels of support and 7 levels of resistance
- Set the colors of the levels individually
Inputs
- Pivot Type
- Pivot Fibo RSJ1 = Fibo ratio 1 Calculation
- Pivot Fibo RSJ2 = Fibo ratio 2 Calculation
- Pivot Fibo RSJ3 = Fibo ratio 3 Calculation
- Pivot Fibo Classic = Classic Pivot Calculation
- Minimum Pivot Levels
- Pivot 3 Levels
- Pivot 4 Levels
- Pivot 5 Levels
- Pivot 6 Levels
- Pivot 7 Levels
If you still have questions, please contact me by direct message: https://www.mql5.com/en/users/robsjunqueira/


a good guide for me...i use it also as a measure of volatility