Pivot Point Fibo RSJ
- Indicatori
-
JETINVEST
 Roberto Junqueira, is Trader for over 20 years and has been developing indicators and trading experts for more than 10 years for the Forex, Cryptocurrencies and Stock Exchanges markets.
 - Versione: 1.0
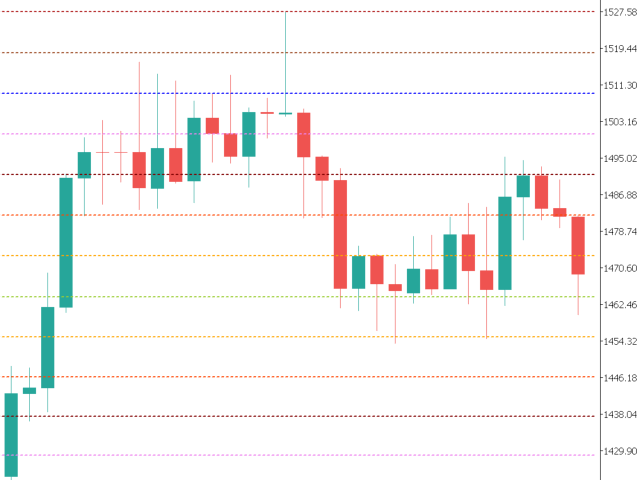
Pivot Point Fibo RSJ è un indicatore che traccia le linee di supporto e resistenza del giorno utilizzando i tassi di Fibonacci.
Questo spettacolare indicatore crea fino a 7 livelli di supporto e resistenza tramite Pivot Point utilizzando i tassi di Fibonacci.
È fantastico come i prezzi rispettino ogni livello di questo supporto e resistenza, dove è possibile percepire possibili punti di entrata/uscita di un'operazione.
Caratteristiche
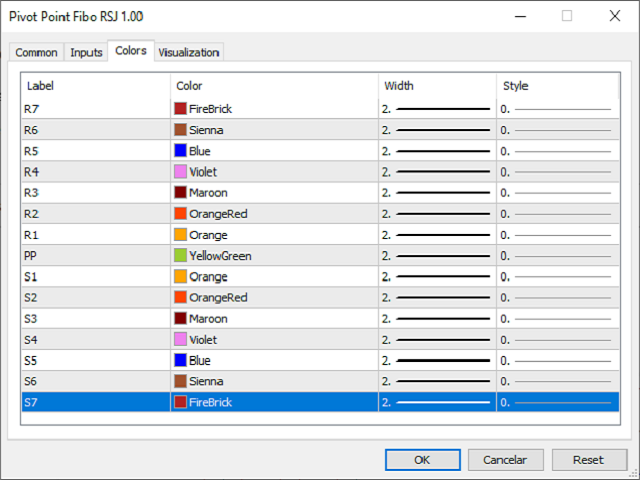
- Fino a 7 livelli di supporto e 7 livelli di resistenza
- Imposta i colori dei livelli individualmente
Ingressi
- Tipo di perno
- Pivot Fibo RSJ1 = Rapporto Fibo 1 Calcolo
- Pivot Fibo RSJ2 = Rapporto Fibo 2 Calcolo
- Pivot Fibo RSJ3 = Rapporto Fibo 3 Calcolo
- Pivot Fibo Classic = Calcolo Pivot classico
- Livelli di pivot minimi
- Pivot 3 livelli
- Pivot 4 livelli
- Pivot 5 livelli
- Pivot 6 livelli
- Pivot 7 livelli
Se hai ancora domande, contattami tramite messaggio diretto: https://www.mql5.com/it/users/robsjunqueira/


a good guide for me...i use it also as a measure of volatility