MACD Enhanced
- Indicators
-
Nikita Berdnikov
 Good afternoon! I'm a developer of trading indicators and Expert Advisors. If you have an interesting idea or an unconventional task — feel free to reach out in DMs, and we'll figure out the implementation together. Always open to collaboration!
 - Version: 1.1
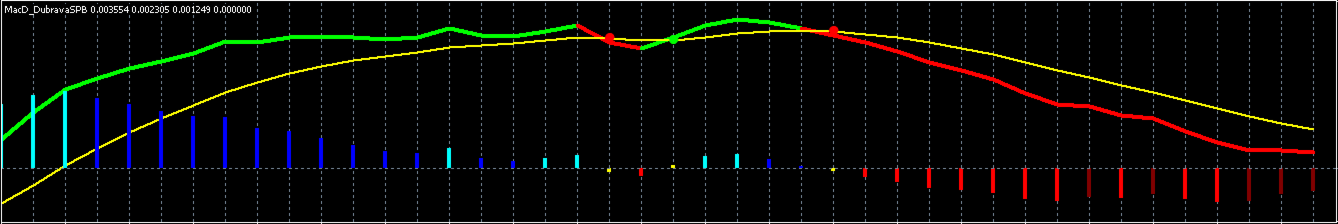
Introducing the MACD Enhanced – an advanced MACD (Moving Average Convergence Divergence) indicator that provides traders with extended capabilities for trend and momentum analysis in financial markets. The indicator uses the difference between the fast and slow exponential moving averages to determine momentum, direction, and strength of the trend, creating clear visual signals for potential entry and exit points.
Attention! To achieve the best results, it is recommended to adapt the indicator parameters for specific trading instruments and timeframes.
Key Features:
Improved MACD Visualization:
-
Color differentiation of the MACD line based on its position relative to the signal line
-
Multicolored histogram reflecting dynamic changes (rise, fall, crossing zero line)
-
Clear visual signals upon MACD and signal line crossover
Enhanced Display Features:
-
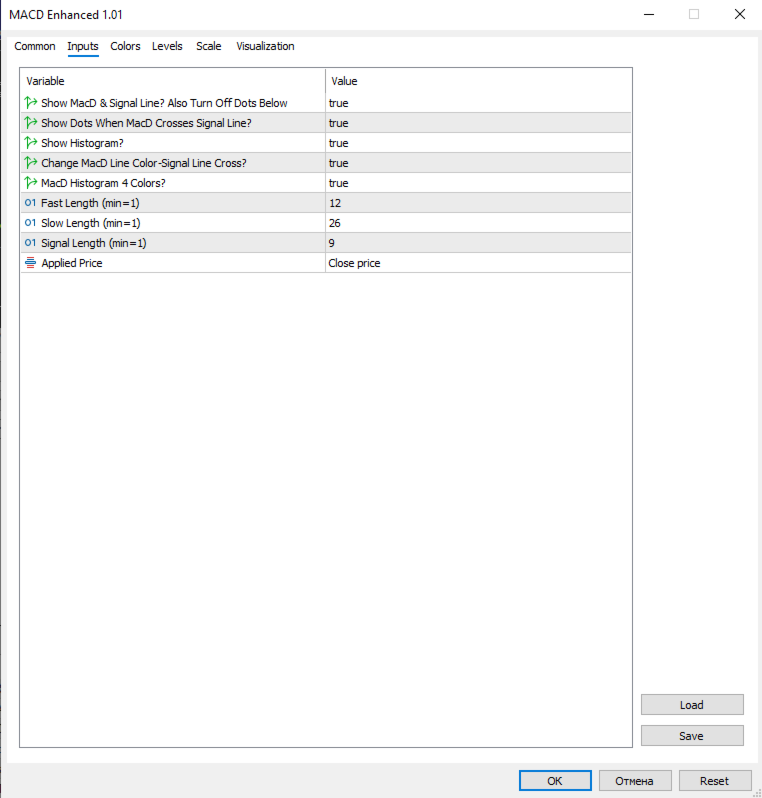
Customizable display of all indicator components (MACD line, signal line, histogram)
-
Automatic entry/exit signals with visual confirmation via arrows
-
Optimized color scheme for quick visual analysis
Flexible Settings:
-
Customizable periods for fast and slow EMAs, as well as the signal line
-
Option to select price type for calculations (close, open, high, low, etc.)
-
Customizable color display for all indicator elements
-
Ability to enable/disable individual components for simplified analysis
Technical Advantages:
-
Optimized EMA calculation algorithm for enhanced performance
-
Stable operation on all timeframes
-
Improved historical data processing system
-
Optimized memory usage when working with large data volumes
Usage Recommendations:
-
Timeframes: Effective on any timeframe, from M1 to MN
-
Financial Instruments: Suitable for all trading instruments (currency pairs, indices, stocks, commodities)
-
Strategies: Applicable for both short-term scalping trading and long-term position trading
Signals:
-
MACD and signal line crossover (confirmed with arrows)
-
Histogram color change (indicates a change in momentum)
-
Histogram crossing the zero line (confirms a trend reversal)
The indicator is recommended to be used in conjunction with additional analysis methods to confirm signals and reduce the number of false triggers.
We also recommend checking out the extended version of this indicator: https://www.mql5.com/ru/market/product/146117?source=Site
If you find a critical error, please notify me about it. I will attempt to fix it as soon as possible.


Thanks, great indicator