MACD Intraday Trend PRO

5

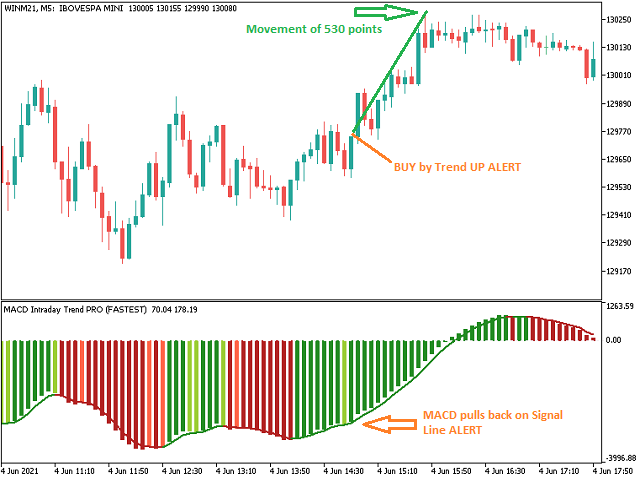
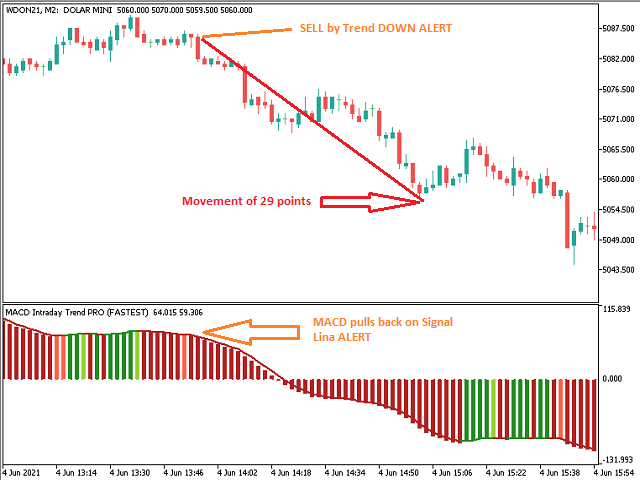
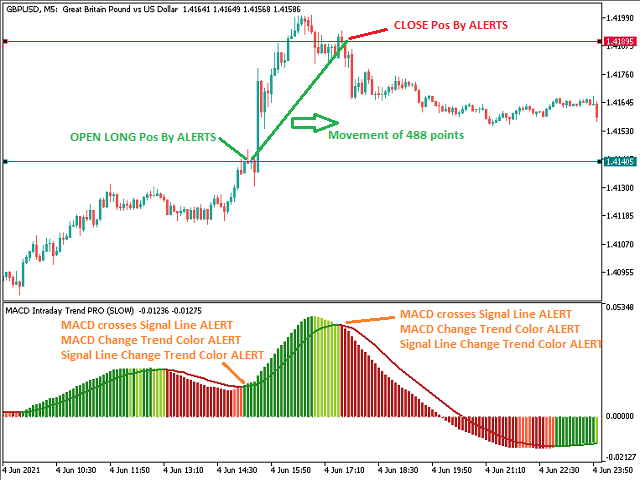
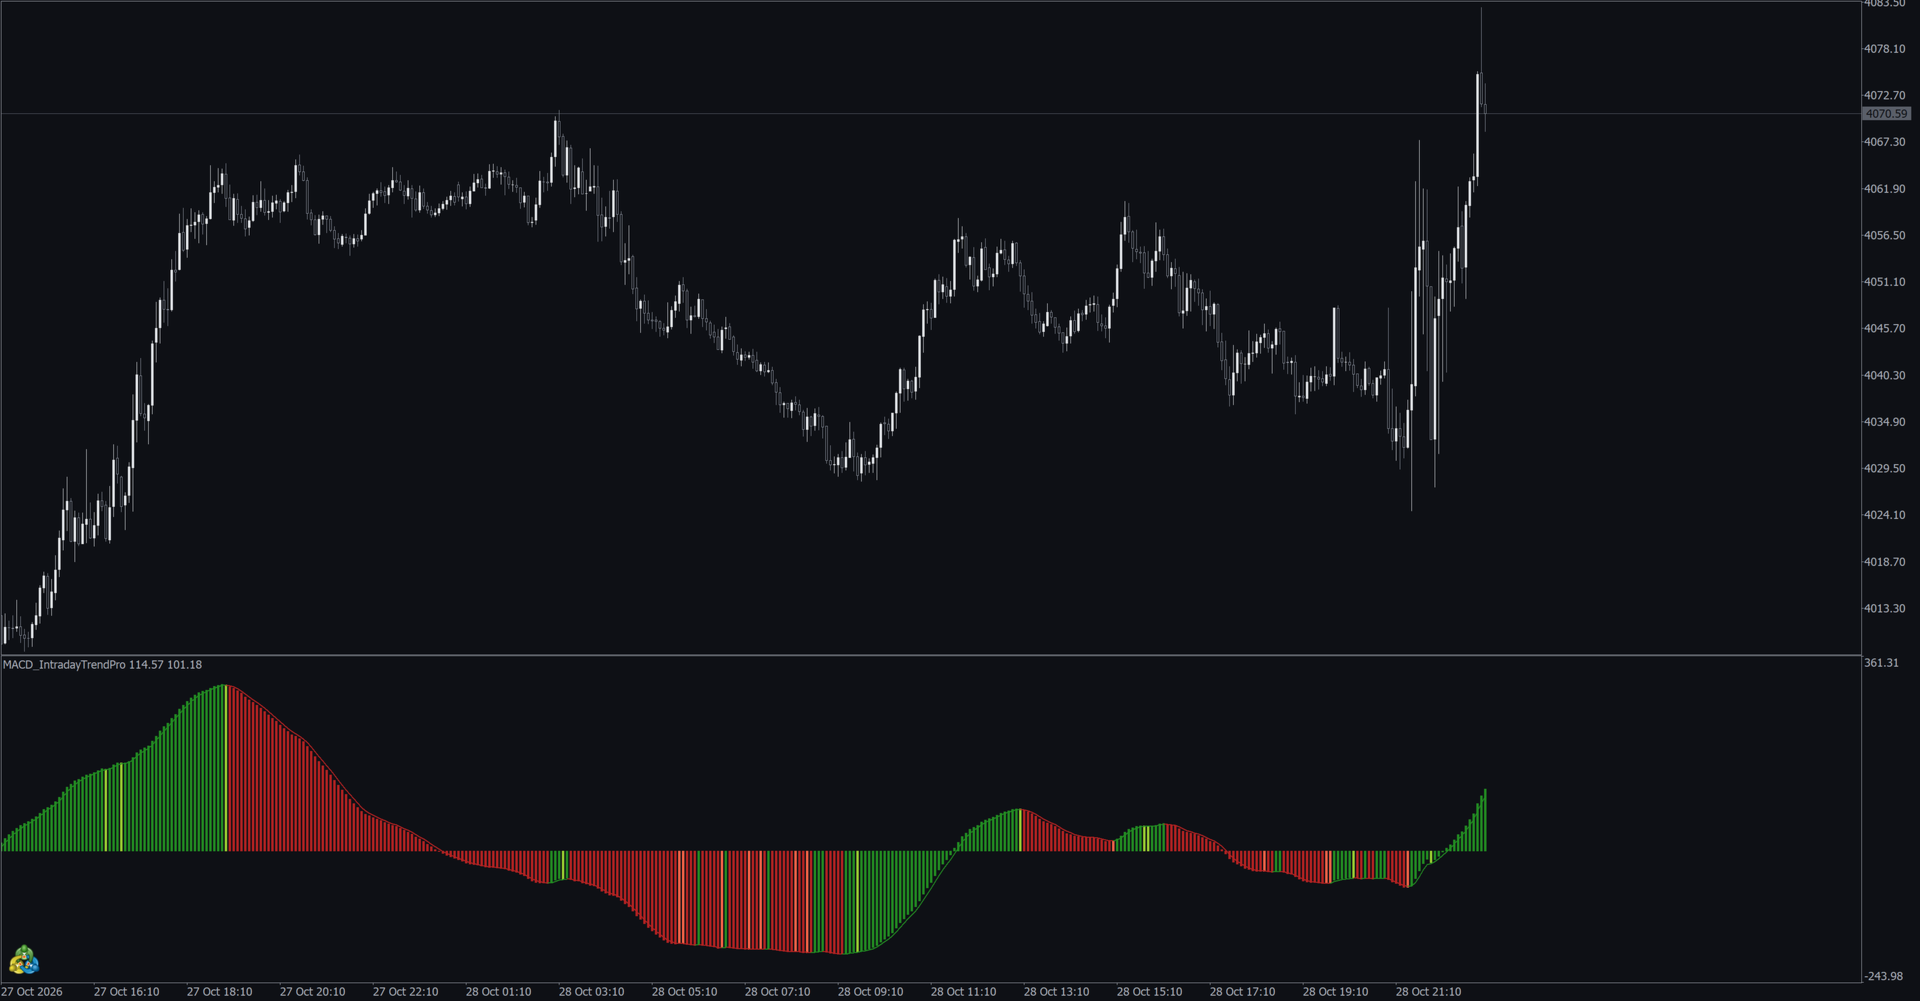
MACD Intraday Trend PRO shows when an intraday trend starts and when it runs out of strength, using a MACD re-tuned with Fibonacci proportions. Works on any symbol, any timeframe and on Renko charts.

The free version is rated 4.8 by 56 traders. PRO is the full toolkit built on the same engine.

What it does

  • Fibonacci-proportioned MACD settings that keep trend moves readable instead of choppy
  • Highlights trend start and trend exhaustion on the indicator window
  • Same logic as the free MACD Intraday Trend, so you can test the engine before buying

Free vs PRO

  • Fibonacci MACD engine: Free yes / PRO yes
  • 6 configurable alerts (pop-up, sound, push): Free no / PRO yes
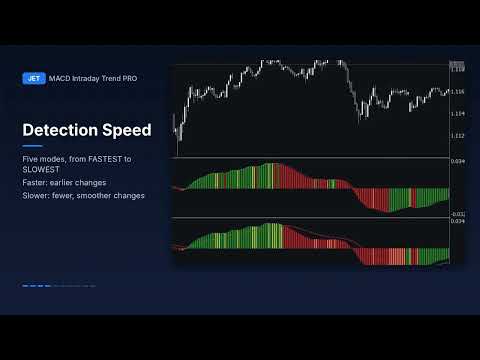
  • Trend detection speed (Fastest to Slowest): Free no / PRO yes
  • 8 buffers for EA integration: Free no / PRO yes

How to use

  1. Attach to the chart you trade (M5 to H1 for intraday).
  2. Trade in the direction of the histogram trend; treat a loss of momentum as an exit warning.
  3. Combine with your own levels and risk management. The indicator does not open trades.

Alerts

6 alerts: MACD pulls back on the Signal Line, MACD crosses the Signal Line, MACD crosses level zero, Signal Line crosses level zero, MACD changes trend color, Signal Line changes trend color. Each one notifies by pop-up, sound (13 sounds available), smartphone push, or any combination.

Integration with Expert Advisors

Buffers are filled even with the alerts turned off:

  • Buffer 5: MACD value
  • Buffer 6: Signal Line value
  • Buffers 12 to 17: alerts 1 to 6 (-1 downtrend, 0 undefined, +1 uptrend)

FAQ

  • Does it repaint? No. The signal appears while the candle is forming and is confirmed only when the candle closes. Closed candles never change.
  • MT4 version? Yes: MACD Intraday Trend PRO MT4.
  • Support: send me a direct message on MQL5. I answer within 24 hours.

Full user manual (with images): https://www.mql5.com/en/blogs/post/779229
Reviews 9
nadim757611
107
nadim757611 2026.06.03 08:29 

its helpful

Simon Peter Ward
972
Simon Peter Ward 2025.10.30 10:01 

Superb Indicator!!! only one i use......

ROLF WILLY ORTMANN
929
ROLF WILLY ORTMANN 2025.09.25 10:16 

DELUXE Indicator.

Recommended products
RBreaker
Zhong Long Wu
RBreaker Gold Indicators is a short-term intraday trading strategy for gold futures that combines trend following and intraday reversal approaches. It not only captures profits during trending markets but also enables timely profit-taking and counter-trend trading during market reversals. This strategy has been ranked among the top ten most profitable trading strategies by the American magazine   Futures Truth   for 15 consecutive years. It boasts a long lifecycle and remains widely used and st
This is Gekko's customizable version of the famous Heiken Ashi indicator. It extends the use of the famous Heiken Ashi and calculates strong entry and exit signals.  Inputs Number of Bars to Plot Indicator:  number of historical bars to plot the indicator, keep it low for better performance; Produce Arrow Signals:  determine if the indicator will plot arrow signal for long/short; Produces Signal Only When a Bar Closes:  wait for a bar to close to produce a signal (more accurate, by delayed entry
Liquidity Order Blocks MT5
Johan Adrian Nieto Resendiz
Liquidity Order Blocks MT5 Liquidity Order Blocks MT5 is a professional visual indicator for MetaTrader 5 designed to help traders identify and monitor potential bullish and bearish liquidity areas directly on the chart. The indicator detects pivot-based order block zones and displays each zone with a structured visual breakdown of estimated bullish volume, bearish volume, relative strength and delta. Its purpose is to make liquidity areas easier to read, compare and monitor during market analys
KasTon Trend System: The Complete 2-in-1 Trading Strategy Identify the Trend, Confirm the Signal, and Trade with Confidence! Do you suffer from confusion while trading? Do you find it difficult to determine the market's direction? Are you tired of losing money on false signals? The KasTon Trend System is here as an integrated solution to all these problems. This is not just an indicator; it is a complete trading strategy built on the synergy of two powerful, custom-built indicators. Our main g
Cycle Projection Pro is a cyclical analysis indicator for MetaTrader 5, designed for the Daily timeframe. It identifies and projects recurring price cycles forward in time, helping you estimate when — not how much — the market may be approaching a turning point. How it works The indicator sums six harmonic cycles with explicit periods — Weekly, Biweekly, Monthly, Quarterly, Semiannual, Annual — each independently adjustable and can be turned on or off. Their combination produces a composite wav
Range Volume Hybrid Generator
Trade The Volume Waves Single Member P.C.
1. Introduction Range Volume Hybrid (RVH) is a MetaTrader 5 Expert Advisor that creates custom chart symbols using a unique dual-condition bar formation method. Unlike traditional charts where bars close based on a single criterion (time, range, or volume), RVH bars close only when BOTH a minimum price range AND a minimum volume threshold are met simultaneously.  Download also and install RVH Monito r Indicator - to control the EA from the custom charts (it's Free)  https://www.mql5.com/en/marke
HMA Trend Professional MT5
Pavel Zamoshnikov
4.25 (4)
Improved version of the free HMA Trend indicator (for MetaTrader 4) with statistical analysis. HMA Trend is a trend indicator based on the Hull Moving Average (HMA) with two periods. HMA with a slow period identifies the trend, while HMA with a fast period determines the short-term movements and signals in the trend direction. The main differences from the free version: Ability to predict the probability of a trend reversal using analysis of history data. Plotting statistical charts for analyzi
RVE Echo Indicator MT5 — Rejection Velocity Echo RVE Echo Indicator is a custom MetaTrader 5 technical indicator designed to detect abnormal price rejection, sharp velocity changes, and possible reversal zones in the market. RVE stands for Rejection Velocity Echo . The indicator studies how strongly price moves compared to its recent rejection behavior, then highlights moments where the current price movement appears unusually aggressive. This can help traders identify possible exhaustion, rejec
Structure King AI Signal Structure King AI Signal is a professional MetaTrader 5 trading indicator designed to help traders analyze market structure, trend direction, multi-timeframe confirmation and trade management from one clean dashboard. Key Features • Market Structure & Trend Analysis • BUY / SELL Signals • Multi-Timeframe (HTF) Confirmation • Entry Price Levels • Dynamic Stop Loss (SL) • TP1 / TP2 / TP3 Levels • ATR Volatility Analysis • ADX Trend Strength Filter • Adaptive Market Filter
Oscillator trading signals - это динамический индикатор, определяющий состояние к продолжению тенденции роста или падению цены торгового инструмента и отсечению зон с нежелательной торговлей. Индикатор состоит из 2 линий осцилляторов. Медленная и быстрая сигнальная линия.  Шкала отображения перевернутая. Зоны вблизи 0 свидетельствуют о тенденции роста цены валютной пары. Зоны -100 свидетельствуют о падении цены валютной пары. На основном графике в виде стрелок отображается потенциально выгодные
VisualVol
Maxim Kuznetsov
The indicator highlights the points that a professional trader sees in ordinary indicators. VisualVol visually displays different volatility indicators on a single scale and a common align. Highlights the excess of volume indicators in color. At the same time, Tick and Real Volume, Actual range, ATR, candle size and return (open-close difference) can be displayed. Thanks to VisualVol, you will see the market periods and the right time for different trading operations. The indicator displays: T
C88 Projected Candle See the Bigger Picture Before the Candle Closes C88 Projected Candle is a professional market visualization indicator that projects the current higher timeframe candle directly onto your active chart. It helps traders understand the evolving market structure without constantly switching between timeframes. Whether you trade Price Action, ICT, Smart Money Concepts (SMC), or Volume Profile, this indicator provides a cleaner and more intuitive way to read market context. Key Fe
Unlock the Market's Hidden Blueprint with Advanced Pattern Recognizer Tired of staring at charts, struggling to spot high-probability trading opportunities? What if you had a professional analyst scanning the markets 24/7, drawing perfect trendlines, and calculating precise profit targets for you? Introducing Advanced Pattern Recognizer for MetaTrader 5 – Your Automated Technical Analysis Powerhouse. This isn't just another indicator. It's a sophisticated algorithmic engine designed to do the he
Divergent Stochastic Filter II Catch Reversals Early, Filter Noise, Trade with Confidence The Edge: Why This Stochastic is Different  Every trader knows the Stochastic oscillator. But knowing when to trust its signals, that's the real challenge. The Divergent Stochastic Filter II transforms this classic indicator into a precision reversal detection system by adding critical elements: divergence intelligence, signal filtering and exhaustion detection.  While standard Stochastic oscillators fire s
Confluence Meter: one consolidated rating from 26 indicators Confluence Meter calculates the signals of 26 popular indicators and merges them into a simple sell / neutral / buy rating. You don't have to open dozens of windows and compare readings by hand. One glance at the panel is enough to see which way the market is leaning on the selected timeframe. MT4-version:  https://www.mql5.com/en/market/product/199466 Our products: https://www.mql5.com/en/users/trendhunter/seller What you see on the c
The Accumulation / Distribution is an indicator which was essentially designed to measure underlying supply and demand. It accomplishes this by trying to determine whether traders are actually accumulating (buying) or distributing (selling). This indicator should be more accurate than other default MT5 AD indicator for measuring buy/sell pressure by volume, identifying trend change through divergence and calculating Accumulation/Distribution (A/D) level. Application: - Buy/sell pressure: above
Liquidity Oscillator
Paolo Scopazzo
3 (2)
A powerful oscillator that provide Buy and Sell signals by calculating the investor liquidity. The more liquidity the more buy possibilities. The less liquidity the more sell possibilities. Please download the demo and run a backtest! HOW IT WORKS: The oscillator will put buy and sell arrow on the chart in runtime only . Top value is 95 to 100 -> Investors are ready to buy and you should follow. Bottom value is 5 to 0 -> Investors are ready to sell and you should follow. Alert + sound will appe
Fibaction
Abdelkhalek Orabi
Indicator Name: Fibaction – price action candle Detector Description: Fibo Signal Boxes is a powerful Smart Money Concept (SMC)-inspired indicator that auto-detects price action candles. bullish hammers and shooting stars, then draws precise Fibonacci entry zones and multiple take-profit levels directly on the chart. as for the SL personally i use 40 pips rules  Key Features: Detects bullish hammer and shooting star reversal candles. Automatically draws Fibonacci entry and TP boxes. as
Be notified of every color change of Heiken Ashi (HA) candles. The indicator will trigger past and new signals every time that HA candles change their colors. ( Note : this tool is based on the code of Heiken Ashi indicator developed by MetaQuotes Software Corp.) Features The signals are triggered at closing of last bar/opening of a new bar; Any kind of alerts can be enabled: Dialog Box, Email message, SMS notifications for smartphones and tablets, and Sound alerts; By default, up arrows are pl
Fabii Half Trend Baseline
Fabien Georges Andre Guillemaud
Stop trading against the higher timeframe trend. Two baselines, one chart. No repaint. Any pair, any timeframe. On your chart in 2 minutes. Free demo in the Strategy Tester. Get more indicators here Baselines, volatility filters and oscillators. No repaint. Why you need it You enter a trade because a line turned green on your chart. Then you open a higher timeframe and see that the bigger trend points the other way. The signal was real. The trend behind it was not on your side. Every trade ta
CosmiCLab SMC FIBO CosmiCLab SMC FIBO is a professional trading indicator designed for traders who use Smart Money Concepts (SMC), market structure analysis and Fibonacci retracement levels. The indicator automatically detects market swings and builds Fibonacci levels based on the latest impulse movement. It also identifies market structure changes such as BOS (Break of Structure) and CHOCH (Change of Character), helping traders understand the current market direction. CosmiCLab SMC FIBO also pr
Noize Absorption Index - is the manual trading system that measures the difference of pressure between bears forces and bulls forces. Green line - is a noize free index that showing curent situation. Zero value of index shows totally choppy/flat market.Values above zero level shows how powerfull bullish wave is and values below zero measures bearish forces.Up arrow appears on bearish market when it's ready to reverse, dn arrow appears on weak bullish market, as a result of reverse expectation.
TRI Visualizer
Yoshimi Mon 三 Ura
TRI Visualizer MT5 – Thermodynamic Market Analysis Overview The TRI (Thermal Range Indicator) Visualizer Enhanced is a rare market analysis indicator that goes beyond conventional technical analysis, applying principles of thermodynamics from physics. It interprets market price fluctuations as “thermodynamic energy,” enabling the highly accurate detection of subtle market changes that are often overlooked. Innovative Mechanisms 1. Dual Calculation Engines Classic TRI Mode Formula: |Close
ReaperFusion V1 - 3TF SMC Dashboard Stop forced trades. Trade only STACKS. WHAT IT DOES: 3 Timeframe Confluence (EXT Bias + INT Setup + LTF Entry) FVG 50% MCT Auto Detection Confluence Scoring 70%+ Filter - Only shows high quality Toggle Buttons + Alerts (No chart clutter) Works on XAUUSD, BTCUSD, All Forex HOW IT WORKS: 1. EXT Timeframe defines bias 2. INT scans for 70%+ OB/FVG stack 3. LTF waits for Sweep + CHoCH entry 4. Dashboard shows WAIT or GO + Confidence Score INPUTS: - Co
FREE
DAILY OH/OL SDEV QUANT MODEL - STATISTICAL TRADING WITH PRECISION RISK MANAGEMENT TRADE WITH MATHEMATICAL CERTAINTY - KNOW YOUR EXACT STOP-LOSS AND TAKE-PROFIT BEFORE YOU ENTER This indicator analyzes 5,000+ days of price history to give you: Exact entry levels (sigma bands locked at daily open) Exact stop-loss distance (from M
Syntetic Mean Reversion
Danny Giovanni Romero Lozano
Synthetic Mean Reversion The Synthetic Mean Reversion is a technical indicator designed to analyze price momentum and its distance from dynamic equilibrium. It operates in a separate sub-window, offering a normalized view of market extensions and potential exhaustion zones based on price volatility. The indicator measures the difference between the current price and its mean, transforming market data into a visual scale of 0 to 100. This calculation helps identify periods when the price has de
Smart Support And Resistance Indicator See the Market Levels That Matter. Make your chart clearer and your technical analysis more organized with Smart Support And Resistance Indicator — a powerful trading tool designed to help traders identify important support and resistance levels directly on their MetaTrader 5 charts. Whether you trade Forex, Gold, Indices, or other available markets, this indicator helps you focus on key price areas, monitor potential market reactions, and analyze price act
Chỉ báo này sẽ thông báo cho bạn nếu cấu hình xu hướng thành công. Tín hiệu theo xu hướng không nên được tăng theo, nhưng tín hiệu mua ở mức giá thấp theo mô hình giao dịch thông thường của bạn, hoặc tín hiệu bán ở mức giá tốt, là một lựa chọn rất tốt. Hãy thiết lập nó trên khung thời gian lớn hơn và theo dõi các khung thời gian nhỏ hơn, bám sát các xu hướng chính. Tôi thường thiết lập ba khung thời gian gần nhau nhất và không bao giờ đi ngược tín hiệu của INdicator này. INdicator   này không có
Trend Master V2
Oratile Pitsoane
What Is Trend Master Pro? Trend Master Pro   is a professional-grade trend trading indicator built for MetaTrader 5. It was designed with one goal in mind — to keep you on the right side of the market at all times by combining three powerful technical tools into a single, clean, easy-to-read display directly on your price chart. Instead of cluttering your screen with multiple separate indicators, Trend Master Pro fuses an   EMA Ribbon trend filter , a   ZigZag swing point engine , and a   breako
WBS SMC Without Repaint – Ultimate XAUUSD Scalping Engine (M5 Timeframe) Take your Gold trading to the institutional level with "WBS SMC Without Repaint", a highly advanced premium indicator engineered specifically for XAUUSD (Gold) on the M5 (5-Minute) timeframe.  Built upon the core pillars of Smart Money Concepts (SMC) combined with precise algorithmic candle pattern recognition, this tool identifies high-probability institutional footprints in real-time. Best of all: 100% ABSOLUTELY
Buyers of this product also purchase
Trend Sniper X
Sarvarbek Abduvoxobov
4.86 (44)
Trend Sniper X is a multi-timeframe trend-following indicator for MetaTrader 5 that helps traders identify trend direction and potential reversal points with clarity and precision. for MT4: https://www.mql5.com/en/market/product/193245 Price Information: The current price is promotional and is subject to change as upcoming updates and new features are released. Bonus Offer: To get the FREE Auto-Trade Assistant EA for this indicator, please message the author after purchasing. Code2Profit Channe
Entry Points Pro shows you where to enter, where to put the stop and what lot to trade — before you place the order. PRICE Now 199 USD: 10 copies at this price, then 249 USD. The final price is 349 USD. I make my money trading the markets, and I show it, so I don't need to sell this indicator to everyone. It is a tool for traders who think for themselves, not a magic button. The arrow appears when the candle closes and does not repaint. Two settings: your deposit and your risk per trade. Chec
Ultra Indicator
Ihor Otkydach
5 (1)
ULTRA is a technical indicator that operates on an “all-in-one” basis—it independently analyzes the market, generates trading signals, displays levels for setting stop-loss orders, and suggests when to close trades to lock in profits or minimize losses. In other words, it doesn't matter if you don't know how to analyze the market, determine levels—where to set your stop-loss—or struggle with money management. ULTRA will do all of that for you! BUYER BONUS: After purchasing the ULTRA indicator, s
Gann Made Easy   is a professional and easy to use Forex trading system which is based on the best principles of trading using the theory of W.D. Gann. The indicator provides accurate BUY and SELL signals including Stop Loss and Take Profit levels. You can trade even on the go using PUSH notifications. PLEASE CONTACT ME AFTER PURCHASE TO GET TRADING  INSTRUCTIONS   AND GREAT EXTRA INDICATORS  FOR FREE! Probably you already heard about the Gann trading methods before. Usually the Gann theory is a
SuperScalp Pro
Van Minh Nguyen
4.54 (37)
SuperScalp Pro - Professional Multi-Layer Confluence Scalping System SuperScalp Pro is an advanced scalping indicator that upgrades the classic Supertrend with multiple intelligent confirmation filters. It helps you identify higher-probability Buy/Sell opportunities while significantly reducing false signals. Clear Buy and Sell arrows appear directly on the chart, along with automatic ATR-based Stop Loss and Take Profit levels calculated in real time. After purchase, please message me on MQL5 to
Boba Analysis Suite
Trade Ready Solutions LLC
5 (2)
Boba Analysis Suite Boba Analysis Suite is an analytical indicator for MetaTrader 5. It brings market structure, relevant price zones and broader market context together in a single chart view. Developed through practical experience as a trader and trading coach, it supports a structured analysis process: assessing market direction, identifying important levels and considering multiple timeframes together. Analysis in Context Individual signals gain meaning through context. Boba Analysis Suite h
Welcome to Entry In The Zone & SMC Multi Timeframe —  COMPLETE SMC ANALYSIS SYSTEM — ALL IN ONE INDICATOR Entry In The Zone & SMC Multi Timeframe  An indicator designed for market analysis based on Smart Money Concepts (SMC), displaying Market Structure, Key Zones (Order Blocks, Supply & Demand Zones, and Fair Value Gaps), Liquidity, and real-time BUY / SELL signals. It supports both Single-Timeframe and Multi-Timeframe analysis, along with the Confluence at Zone feature, which helps you evaluat
FX Power MT5 NG
Daniel Stein
5 (33)
FX Power: Analyze Currency Strength for Smarter Trading Decisions Overview FX Power is your go-to tool for understanding the real strength of currencies and Gold in any market condition. By identifying strong currencies to buy and weak ones to sell, FX Power simplifies trading decisions and uncovers high-probability opportunities. Whether you’re looking to follow trends or anticipate reversals using extreme delta values, this tool adapts seamlessly to your trading style. Don’t just trade—trade
M1 Sniper MT5
Oleg Rodin
5 (7)
M1 SNIPER  is an easy to use trading indicator system. It is an arrow indicator which is designed for M1 time frame. The indicator can be used as a standalone system for scalping on M1 time frame and it can be used as a part of your existing trading system. Though this trading system was designed specifically for short-term trading, it still can be helpful for all traders. This trading system can be used with any forex pair and time frame, though lower time frames are recommended from M1 up to M
FiboSniper Pro
Van Minh Nguyen
5 (4)
FiboSniper Pro - Multi-Filter Fibonacci System with Auto SL/TP and Control Panel FiboSniper Pro is a technical indicator that combines dynamic Fibonacci Envelopes with multiple confirmation filters to generate selective Buy and Sell signals. Fibonacci levels are calculated from Moving Average and ATR, then filtered by ADX, EMA, RSI, ATR, Volume, Time and Candle structure. The indicator displays automatic ATR-based Stop Loss and Take Profit levels directly on the chart, along with an interactive
Auto Optimized SpeedAngle is an institutional-grade momentum vectoring system that eliminates curve-fitting through continuous Walk-Forward Optimization (WFO). Rather than relying on static inputs that degrade when market regimes shift, the indicator dynamically recalibrates its parameters using Out-of-Sample (OOS) validation, ensuring the displayed signals represent genuine statistical edges rather than historical anomalies. By shifting the focus from subjective visual angles to normalized, qua
SQN Max indicator for MT5 by ITC
Renaud Herve Francois Candel
Sqn Max Indicator Sqn Max is an exclusive indicator to trade the market with high effectiveness. The indicator is based on price action, volatility and trend. This indicator is as simple as possible but not too simple. The indicator can generate alerts to ease the trading process. You don't have to stay all day in front of your screen. The indicator can be used with any class of assets and with any time frame. It is possible to achieve better results trading our list of selected assets. We achi
SIO Oscillator: Self-Optimizing Semivariance Imbalance Oscillator Buy the indicator and get the Expert Advisor based on it for FREE. Most oscillators treat all price movement the same. SIO separates upside and downside market pressure and measures the imbalance between them, showing which side is really in control: buyers or sellers. When the imbalance reaches an extreme, SIO prints a clear signal with entry, Stop Loss and Take Profit levels. What makes SIO different is that it doesn’t rely on f
Power Candles MT5
Daniel Stein
4.58 (12)
Power Candles - Self-Optimizing Strength Indicator Strength usually lives in a sub-window. The line runs below, the candle above, and your eye keeps connecting the two. Power Candles puts the strength into the candle itself, colored from dark red to dark green, so the chart reads at a glance and the sub-window stays closed. The indicator also finds its own settings for the symbol and timeframe in front of you. One click on [ Apply Best ] draws entry, Stop Loss and Take Profit at the exact prices
Astral Structure
Ottaviano De Cicco
Astral Structure Assess the setup. See the initial plan. Launch Special - $99. $149 after launch. A structure setup raises several questions at once: does the wider view agree, where is the stop reference, and how are targets defined? Astral Structure brings those questions into one workspace for discretionary traders who build their decisions around market structure. Focus on the relevant setup. Review the latest eligible setup, its direction and qualification together. See the wider agreement.
Crystal Heikin Ashi Signals
Muhammad Jawad Shabir
5 (5)
Crystal Heikin Ashi Signals—Professional Trend & Signal Detection Indicator Advanced Heikin Ashi Visualization with Intelligent Signal System for Manual & Automated Trading Final Price: $149 ---------> Price goes up $10 after every 10 sales . Limited slots available — act fast . Overview User Guide PDF Crystal Heikin Ashi Signals is a professional-grade MetaTrader 5 indicator that combines pure Heikin Ashi candle visualization with an advanced momentum-shift detection system. Designed for both m
Multi Currency Strength and Momentum Indicator MT5 Dynamic Forex28 Navigator is the evolution of our long-time, popular indicators, combining the power of five in one: Advanced Currency Strength28 Indicator (700 reviews) Advanced Currency IMPULSE with ALERT (530 reviews) Currency Strength EXOTICS GOLD Impulse with Alert CS28 Combo Signals (recent Bonus) No need to buy four indicators and stack them on your charts. All of it is merged into one powerful indicator: the strength of the 28 Forex pair
Scalper Vault is a powerful, fully-equipped trading system designed for traders who want to achieve consistency in intraday trading . This high-precision indicator serves as a complete, standalone trading system that delivers institutional-grade analysis for both Forex and Binary Options traders. PLEASE CONTACT ME AFTER PURCHASE TO GET MY TRADING TIPS PLUS A GREAT BONUS! By eliminating the guesswork and complex manual analysis, Scalper Vault allows you to focus purely on execution using easy to
The same chart, read in the same order, every day. Structure, the nearest zone, where you sit in the range and which way the trend points — on screen at once, always in the same form. BUYER BONUS — SMC Nexus Scanner Pro. A multi-symbol scanner built on this indicator's data: one panel shows the trend side, active order blocks and BOS / CHoCH for many symbols at once. It comes at no extra cost — after your purchase, message me on MQL5 and I will send it. Fifteen layers under one panel: market st
Azimuth Pro
Ottaviano De Cicco
5 (7)
Azimuth Pro V2: Synthetic Fractal Structure and Confirmed Entries for MT5 Overview Azimuth Pro is a multi-level swing structure indicator by Merkava Labs . Four nested swing layers, swing-anchored VWAP, ABC pattern detection, three-timeframe structural filtering, and closed-bar confirmed entries — one chart, one workflow from micro-swings to macro-cycles. This is not a blind signal product. It is a structure-first workflow for traders who care about location, context, and timing. Halloween P
Neuro Poseidon MT5
Daria Rezueva
4.68 (53)
Neuro Poseidon is a new indicator by Daria Rezueva. It combines precise trading signals with adaptive TP/SL levels - creating best possible trades as a result! Message me and get  Neuro Poseidon Assistant  as a gift to automize your trading process! What makes it stand out? 1. Proven profitability on all assets and timeframes 2. Only confirmed BUY and SELL signals present on the chart 3. Adaptive TP & SL levels generated by the software for each trade 4. Easy to understand - suitable for al
Adaptive Price Action Engine Buy Indicator- Get EA Based on it for FREE. Self-Optimizing Multi-Timeframe Trend & Candlestick Intelligence Markets do not behave the same way all the time—and not every price-action pattern has the same value in every market regime. Adaptive Price Action Engine is designed to adapt to changing market conditions by combining trend structure, multi-timeframe analysis, candlestick patterns, and statistical optimization into one analytical framework. Two Adaptive Mode
FX Trend MT5 NG
Daniel Stein
5 (6)
FX Trend NG: The Next Generation Multi-Market Trend Intelligence Overview FX Trend NG is a professional multi-timeframe trend and market monitoring tool designed to give you a complete structural overview of the market in seconds. Instead of switching between dozens of charts, you instantly see which symbols are trending, where momentum is fading, and where strong alignment exists across timeframes. This tool is part of the Stein Investments ecosystem: setup guides, videos, workshops and Max,
PZ Swing Trading MT5
PZ TRADING SLU
5 (5)
Protect against whipsaws: revolutionize your swing trading approach Swing Trading is the first indicator designed to detect swings in the direction of the trend and possible reversal swings. It uses the baseline swing trading approach, widely described in trading literature. The indicator studies several price and time vectors to track the aggregate trend direction and detects situations in which the market is oversold or overbought and ready to correct. [ Installation Guide | Update Guide | Tro
FX Volume MT5
Daniel Stein
4.79 (24)
FX Volume: Experience Genuine Market Sentiment from a Broker’s Perspective Quick Overview Looking to elevate your trading approach? FX Volume provides real-time insights into how retail traders and brokers are positioned—long before delayed reports like the COT. Whether you’re aiming for consistent gains or simply want a deeper edge in the markets, FX Volume helps you spot major imbalances, confirm breakouts, and refine your risk management. Get started now and see how genuine volume data can
Advance AI Scanner
Mohamed Samsudeen
5 (1)
Advance AI Scanner is a multi-symbol analysis indicator for MetaTrader 5. It scans Forex pairs, metals, energy, stock indices and cryptocurrencies at the same time and rates each instrument with its own self-training model. It explains in plain English what moved each market and why, and it estimates how far upcoming economic news usually moves each symbol, measured on your broker's own price history. $199 instead of $499. 10 copies left at this price. One time purchase  Installation and User
Apex Patterns PRO Buy Indicator - Get Expert Advisor Based on it for FREE. Self-Optimizing Chart Pattern & Breakout Intelligence Traditional pattern scanners rely on fixed inputs, often underperforming when market volatility and structures shift. Apex Patterns PRO is designed to adapt to changing market conditions by combining structural chart pattern recognition, momentum filtering, and statistical self-optimization into one analytical framework. Adaptive Scanning Engine Self-Optimizing Patter
DayTrader PRO
Davit Beridze
5 (4)
DayTrader PRO (Buy DayTrader PRO and get Another Paid Self Optimizing indicator for FREE as BONUS!) DayTrader PRO is an advanced trading indicator that combines John Ehlers' Laguerre Filter with a powerful Auto-Optimization Engine. Instead of using fixed parameters, the indicator automatically searches for the best settings based on recent market conditions, helping you adapt to changing volatility without constant manual adjustments. The indicator generates clear BUY and SELL signals together
Advanced Supply Demand MT5
Bernhard Schweigert
4.53 (15)
Best Solution for any Newbie or Expert Trader! This indicator is a unique, high quality and affordable trading tool because we have incorporated a number of proprietary features and a new formula. With this update, you will be able to show double timeframe zones. You will not only be able to show a higher TF but to show both, the chart TF, PLUS the higher TF: SHOWING NESTED ZONES. All Supply Demand traders will love it. :) Important Information Revealed Maximize the potential of Advanced Supply
Superhero
Ihor Otkydach
5 (3)
The SUPERHERO indicator is a multi-currency trading system designed on an "all-inclusive" basis. The indicator independently analyzes the market and provides signals on when to open and close trades. It uses Stop Loss and Take Profit orders. The R:R ratio is 1:1. This system can send push notifications to your smartphone, so you can place trades "on the go" without needing to be tied to a PC. It's perfect for proprietary trading firms. A BONUS FOR EVERY CUSTOMER: Every buyer of this indicator wi
More from author
Candle Timer Countdown shows how much time is left to close the current candle. It updates every second, even when no new tick arrives, using the broker server clock. Want the same countdown on your order ticket? OCO Panel PRO shows it in its footer, next to one-click orders and saved OCO exits. WHAT IT SHOWS Time left as mm:ss, h:mm:ss, or days on D1, W1 and MN. "Market closed" when the symbol is outside its trading session. Daily % change, symbol and timeframe (each one can be turned on or off
FREE
Order Book Heatmap B3 PRO: visual order book and live liquidity heatmap for B3 futures and stocks in MetaTrader 5, with alerts for big lots, pulled lots and strong imbalance. WHAT IT SHOWS Every live level your broker sends (up to 64 per side), drawn on the right side of the chart and aligned to the price scale. Extended book: levels seen earlier beyond the live depth stay on the book, faded, with the last size seen. They are forgotten after 120 minutes (adjustable). Liquidity heatmap behind the
MACD Intraday Trend
JETINVEST
4.81 (57)
Free Fibonacci-tuned MACD for intraday trends. Want alerts and the full toolkit? MACD Intraday Trend PRO MACD Intraday Trend is an Indicator developed through an adaptation made of the original MACD created by Gerald Appel in the 1960s. Through years of trading it was observed that by changing the parameters of the MACD with Fibonacci proportions we achieve a better presentation of the continuity of the trend movements, making that it is possible to more efficiently detect the beginning and end
FREE
Candle Timer Countdown shows how much time is left to close the current candle. It updates every second, even when no new tick arrives, using the broker server clock. WHAT IT SHOWS Time left as mm:ss, h:mm:ss, or days on D1, W1 and MN. "Market closed" when the symbol is outside its trading session. Daily % change, symbol and timeframe (each one can be turned on or off), and your own text before the timer. POSITION Any corner, top or bottom center, or next to the current price. Drag it with the m
FREE
Order Book B3: a free visual order book for B3 futures and stocks in MetaTrader 5, drawn on the right side of the chart and aligned to the price scale. WHAT IT SHOWS The 4 best buy levels and the 4 best sell levels of the book, with lot sizes. Big lots highlighted in gold. Buy/sell imbalance bar at the top of the book. Two layouts: Aligned (each level at its price on the chart) and Ladder (fixed rows centered on the spread). Auto picks the one that fits the chart zoom. Light and dark chart backg
FREE
Free Tabajara setup for B3. Trading WIN? See our Trend WIN B3 robot. Setup Tabajara was created by a Brazilian trader known as  "The OGRO of Wall Street" . The idea of this setup is to indicate to the trader the current trend of prices and  the type of operation should be looked for in the graph. Operation It does this through the positioning of the closing of the candles and the  vwap until 10:40am and after by the arithmetic mean of 20 periods painting the candles in 4 possible colors: Green
FREE
Up to 7 Fibonacci pivot levels per side. For graded supply/demand zones with retest count: Supply Demand RSJ PRO Pivot Point Fibo RSJ draws the daily pivot point and its support and resistance levels calculated with Fibonacci ratios. It plots up to 7 support levels and 7 resistance levels from the previous day's high, low and close. Traders use these levels as reference areas to plan entries, exits and stop placement during the day. Features Up to 7 levels of support and 7 levels of resistance F
FREE
Candle Counter RSJ prints the number of each candle counted from the first candle of the day. The first candle of the day is number 1 and each new candle adds 1 to the count. Input Parameters Show even, odd or all numbers Distance between the candle and the number Text font size Text font color How to use Counting candles helps when a setup depends on the number of bars since the market opened, for example a rule that only takes trades after the third candle of the day, or a review of what happe
FREE
Supply Demand RSJ Zones draws supply and demand zones on any symbol and timeframe, with two strength levels. WHAT IT DOES Finds the turning points of price and turns them into supply and demand zones. Strong zones are drawn in the full color: the most significant zones on the chart. Weak zones are drawn in a faded tone: zones of lower significance. Zones that are no longer valid are removed. Overlapping zones are merged. Supply zones are red and demand zones green by default. Zones are recalcula
FREE
Weis Waves RSJ
JETINVEST
4.64 (11)
Weis Waves RSJ adds up the volume of each price wave and plots it as a histogram of cumulative volume for the alternating up and down waves. This lets you compare the effort (volume) of each wave with its result (price progress) and see when a move is supported by volume or is losing strength. How to read it Each bar of the histogram is the total volume traded during one price wave. When a trend is healthy, the waves in the direction of the trend usually show more volume than the corrections. Wh
FREE
Daily Volume Profile RSJ: free volume profile of the current day for any symbol, with POC, VAH and VAL. WHAT IT SHOWS - Volume profile of today, updated during the day. - POC (price with the most volume), VAH and VAL (value area, 70% by default) with labels. - Value area rows highlighted. - Small panel with today's POC, VAH, VAL and total volume. - Lines and texts adapt to light and dark chart backgrounds. DATA Built from 1-minute bars: real volume when the feed has it (stocks, futures), tick
FREE
Delta Aggression Volume shows, candle by candle, whether aggressive buyers or aggressive sellers traded more, on symbols with real trades such as B3 and CME futures. WHAT IT DOES Computes the aggression delta of each candle: volume of aggressive buys minus volume of aggressive sells. Plots the balance of every candle in a separate window, colored by the side that won. REQUIREMENTS Exchange symbols with real trades: B3 futures and stocks (WIN, WDO, PETR4 …) and CME futures (ES, NQ, CL, GC and the
FREE
Tabajara Ogro
JETINVEST
4.77 (13)
Free Tabajara setup for B3. Trading WIN? See our Trend WIN B3 robot. The Tabajara setup was created by a Brazilian trader known as "The OGRO of Wall Street". It shows the current trend and the type of trade to look for on the chart. How it works The indicator compares the closing price with the 20-period simple moving average and paints the candles in 4 colors: Green: price rising in an uptrend (look for buy entries) Black: price correcting in an uptrend (look for buy entries) Red: price falling
FREE
VWAP Fibo Bands RSJ
JETINVEST
4.83 (12)
VWAP Fibo Bands RSJ draws the VWAP of the selected period and builds bands around it using Fibonacci proportions. The indicator plots 10 band levels around the VWAP. The bands show how far price has moved from the volume weighted average price and can be used as reference levels to plan entries, exits and stops. The bands are easiest to read on timeframes of 30 minutes and below. Inputs Calculation Volume Type Calculation Price Type VWAP Period Time Each band is drawn at a fixed Fibonacci distan
FREE
Free Fibonacci-tuned MACD for intraday trends. Want alerts and the full toolkit? MACD Intraday Trend PRO MT4 MACD Intraday Trend is an Indicator developed through an adaptation made of the original MACD created by Gerald Appel in the 1960s. Through years of trading it was observed that by changing the parameters of the MACD with Fibonacci proportions we achieve a better presentation of the continuity of the trend movements, making that it is possible to more efficiently detect the beginning and
FREE
Aggression Wave RSJ adds up the difference between buy and sell aggression candle after candle and plots it as waves, so you can see which side is controlling the order flow during the day. WHAT IT DOES Computes the aggression delta of each candle (aggressive buys minus aggressive sells) and accumulates it into waves. Colors each wave by direction, so a change of control between buyers and sellers is visible at a glance. Draws a signal line over the waves to show the direction of the flow. REQUI
FREE
Up to 7 Fibonacci pivot levels per side. For graded supply/demand zones with retest count: Supply Demand RSJ PRO Pivot Point Fibo RSJ draws the daily pivot point and its support and resistance levels calculated with Fibonacci ratios. It plots up to 7 support levels and 7 resistance levels from the previous day's high, low and close. Traders use these levels as reference areas to plan entries, exits and stop placement during the day. Features Up to 7 levels of support and 7 levels of resistance F
FREE
Vwap RSJ
JETINVEST
4.82 (11)
VWAP RSJ plots the hourly, daily, weekly and monthly VWAP lines on the same chart. Large institutional buyers and funds use the VWAP to enter and exit positions with the smallest possible market impact. They usually try to buy below the VWAP and sell above it, which tends to pull price back toward the average. This indicator combines the four VWAP periods so you can see where price stands against each of them. How to read it Each VWAP line starts again at the beginning of its period: the hourly
FREE
Volume By Color RSJ paints the volume bar in a darker color when the traded volume is above its own moving average, so candles with unusual activity stand out. An optional four-color mode shows the strength of each candle's volume in steps. By default the indicator compares each bar with the 20-period simple average of the volume. The average type and period can be changed in the inputs. How to use The colored bars make it easy to spot breakouts, rejections and climax candles that happen with vo
FREE
Volume By Color RSJ paints the volume bar in a darker color when the traded volume is above its own moving average, so candles with unusual activity stand out. An optional four-color mode shows the strength of each candle's volume in steps. By default the indicator compares each bar with the 20-period simple average of the volume. The average type and period can be changed in the inputs. How to use The colored bars make it easy to spot breakouts, rejections and climax candles that happen with vo
FREE
MACD Intraday Trend PRO is an Indicator developed through an adaptation made of the original MACD created by Gerald Appel in the 1960s. Through years of trading it was observed that by changing the parameters of the MACD with Fibonacci proportions we achieve a better presentation of the continuity of the trend movements, making that it is possible to more efficiently detect the beginning and end of a price trend. Due to its efficiency in detecting price trends, it is also possible to identify ve
JET Trade Assistant PRO is a complete trade panel and trade manager for MetaTrader 4. Choose your risk, draw the trade on the chart and send it in one click — the panel calculates the volume and manages the trade until the last exit. Same panel, inputs and texts as the MetaTrader 5 version 3.00. HIGHLIGHTS Reverse: close the open side of the symbol and open the opposite one in one click (or Shift + V), confirmed by a second click; mirrored stop loss and take profit; same volume or recalculated f
B3 AND CME FUTURES (WIN, WDO, B3 STOCKS, ES, NQ, CL, GC) Aggression Wave PRO adds up, candle after candle, the difference between buy and sell aggression since the start of the day and plots it as a wave, so you can see which side has been controlling the order flow during the session. It needs a broker that delivers the real trades of the symbol with their aggressor side (buy or sell). Forex, CFD and most crypto feeds have no trades, so on a live chart of these symbols the window stays empty. U
B3 AND CME FUTURES (WIN, WDO, B3 STOCKS, ES, NQ, CL, GC) Delta Aggression Volume PRO shows, candle by candle, whether aggressive buyers or aggressive sellers traded more, and marks the candles where aggression and price disagree. It needs a broker that delivers the real trades of the symbol with their aggressor side (buy or sell). Forex, CFD and most crypto feeds have no trades, so on a live chart of these symbols the window stays empty. Use the free Delta Aggression Volume to see the basic per-
Supply Demand RSJ PRO draws supply and demand zones automatically, grades each one (Weak, Strong, Verified, Proven) and counts how many times price has retested it. Any symbol, any timeframe. What it does Supply zones: where selling overwhelmed buying and pushed price down Demand zones: where buying overwhelmed selling and pushed price up Zone grading in 4 levels: Weak, Strong, Verified, Proven Labels with zone type and retest count, so you see which levels the market keeps respecting Zone filte
Session & Killzones PRO draws the Asia, London and New York sessions and the ICT killzones on your chart, with the range of each session, previous day high/low and ADR projections. Daylight saving is handled per market, so the boxes stay in the right place all year without changing any setting. WHAT IT DOES Session boxes: Asia (Tokyo 09:00-18:00), London (08:00-17:00) and New York (08:00-17:00), each in its own local time US and UK daylight saving applied separately: the 2 to 3 weeks a year when
FVG and Structure PRO marks market structure (BOS / CHoCH), fair value gaps, order blocks and equal highs/lows on your chart: the price action concepts used by ICT and Smart Money traders. Every element is confirmed on a closed candle, so nothing on the chart is redrawn after it appears. WHAT IT DOES Swing highs and lows with adjustable strength; BOS (continuation) and CHoCH (change of character) drawn on candle close Optional HH / HL / LH / LL labels on every swing Fair value gaps (three-candle
Want more? Upgrade to JET Trade Assistant PRO — partial exits with drag-and-drop lines, 4 break-even levels, 8 trailing stops, hidden stops, virtual orders, prop firm rules, day breakeven line and statistics. Trade Panel and Risk Manager PRO places and manages orders from the chart, with the lot size calculated from the risk you choose. Type the risk in percent and click BUY or SELL: stop loss, take profit and lot size are set in one step. Or drag the entry, stop and target lines and the panel c
Prop Firm Risk Guard PRO watches your whole account and enforces the limits of a prop firm challenge or of your own risk plan. When a limit is hit, it closes every position, deletes pending orders and keeps the account flat until the next trading day. WHAT IT DOES Daily loss limit, measured from the balance at the start of the trading day (or the higher of balance and equity), with open profit and loss included. Maximum drawdown: static from the initial balance, or trailing from the highest bala
Trend Confluence PRO reads the trend on a higher timeframe and shows it on your chart: colored candles, BUY and SELL marks, an entry zone with stop loss and three targets, and the levels where price often reacts. Every bar uses only closed higher-timeframe bars, so nothing repaints. Launch price 59 USD. The price goes up 10 USD every 10 sales, up to 99 USD. WHAT IT SHOWS Trend candles: bull, bear, weak trend (grey) and trend change (gold), from the trend timeframe you choose (H1 by default). BUY
Filter:
nadim757611
107
nadim757611 2026.06.03 08:29 

its helpful

JETINVEST
403008
Reply from developer Roberto Sant Ana Junqueira 2026.06.08 23:36
Tks for the review
Simon Peter Ward
972
Simon Peter Ward 2025.10.30 10:01 

Superb Indicator!!! only one i use......

JETINVEST
403008
Reply from developer Roberto Sant Ana Junqueira 2025.10.30 10:09
Tks for the review
ROLF WILLY ORTMANN
929
ROLF WILLY ORTMANN 2025.09.25 10:16 

DELUXE Indicator.

JETINVEST
403008
Reply from developer Roberto Sant Ana Junqueira 2025.09.25 10:27
Tks for the review
Dachs87
169
Dachs87 2024.11.05 20:00 

sehr sehr gut, erstaunlich treffsicher, viel genauer als die meisten anderen Indikatoren, wirklich solide und robuste Trenderkennung

JETINVEST
403008
Reply from developer Roberto Sant Ana Junqueira 2024.11.05 20:01
Tks for the review
Julpa
212
Julpa 2022.03.10 22:16 

Great indicator

JETINVEST
403008
Reply from developer Roberto Sant Ana Junqueira 2022.03.10 22:29
Tks for the review
Quantum Trader
3069
Quantum Trader 2021.07.13 12:47 

User didn't leave any comment to the rating

JETINVEST
403008
Reply from developer Roberto Sant Ana Junqueira 2021.07.26 21:51
Tks
Fabio_Novaes
175
Fabio_Novaes 2021.06.30 21:38 

User didn't leave any comment to the rating

JETINVEST
403008
Reply from developer Roberto Sant Ana Junqueira 2021.06.30 23:09
tks
Marilise Ravaglio Da Cunha Junqueira
386
Marilise Ravaglio Da Cunha Junqueira 2021.06.30 15:59 

User didn't leave any comment to the rating

JETINVEST
403008
Reply from developer Roberto Sant Ana Junqueira 2021.07.26 21:51
Obrigado
Robson Souza
122
Robson Souza 2021.06.30 14:54 

User didn't leave any comment to the rating

JETINVEST
403008
Reply from developer Roberto Sant Ana Junqueira 2021.06.30 15:08
Hi Robson, tks for your review.
Reply to review