Supply Demand RSJ PRO
- Indicators
-
JETINVEST
 Roberto Junqueira, is Trader for over 20 years and has been developing indicators and trading experts for more than 10 years for the Forex, Cryptocurrencies and Stock Exchanges markets.
 - Version: 1.0
- Activations: 20
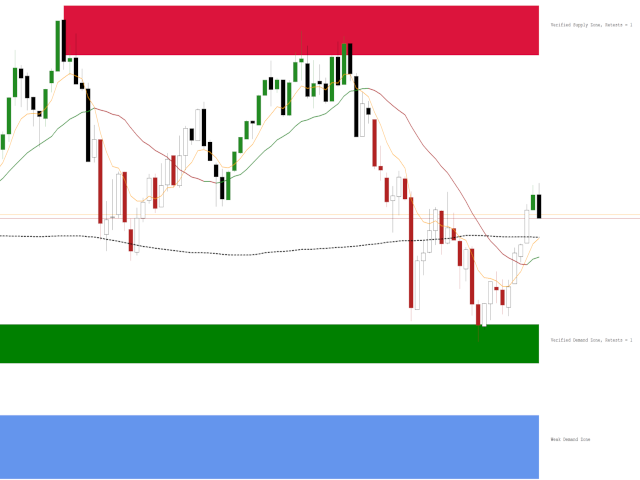
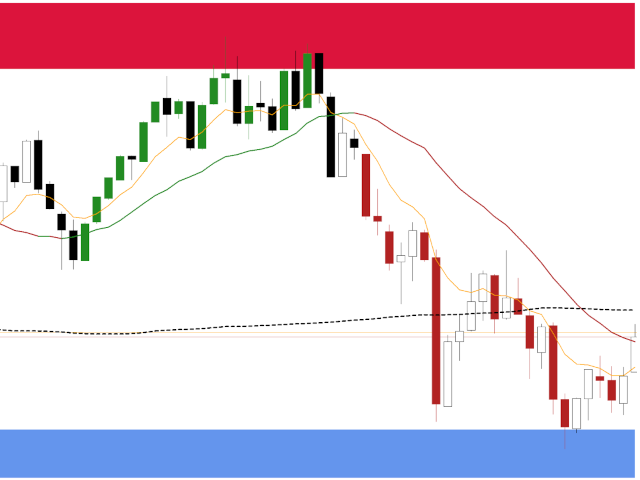
The indicator Supply Demand RSJ PRO calculates and plots the "Supply" and "Demand" zones on the graph, identifying the type of Zone (Weak, Strong, Verified, Proven) and in case of retests of the Zone it shows how many times it was retested.
"Supply" Zones are the price zones where more supply than demand has occurred, driving prices down.
"Demand" Zones are the price zones where more demand than supply has occurred, pushing prices up.
Classification of zones
- Weak: Price region which, if re-tested, is likely to be violated.
- Strong: Price region that has changed the direction of the trend and is unlikely to be retested so soon.
- Verified: Strong price region, where there were 1 to 3 retests at most, but the price failed to break the region.
- Proven: Strong price region, where there were 3 or more retests, but the price failed to break through the region.
- Broken/Turncoat: Price region that is broken, becoming a resistance in the case of support and in the case of a resistance a support.
Settings
- Visual Settings:
- Show Weak Zones: zones classified as weak will be displayed.
- Show Untested Zones: untested zones will be displayed.
- Show Broken Zones: the zones that have been breached will be displayed
- Merge Zones: the indicator will transform very close zones into a wider zone
- Extend Zones: the indicator will check if there are previous limits corresponding with the drawn zones and will extend the same
- Calculation Settings:
- Num Candles For Analysis: Number of candles the indicator will use to classify zones. It can be between 500 and 5000 candles.
- ATR Period: Period used to calculate the ATR
- ATR Factor: Multiplier applied to the calculation of ATR
- Fast Fractal Factor: Fast Multiplier applied over current chart timeframe
- Slow Fractal Factor: Slow Multiplier applied over current chart timeframe
- Label Settings:
- Show Labels: When active, it displays text next to the zones informing the type of zone and number of retests, if applicable.
- Font Color: Set the color of the texts
- Font Size: Set font size
Alert Settings
- Popup
- Sound(There are 13 types of sound available.)
- Smartphone notification
- Popup and Sound
- Popup and Smartphone notification
- Sound and Smartphone notification
- Popup, Sound and Smartphone notification
If you still have questions, please contact me by direct message: https://www.mql5.com/en/users/robsjunqueira/

User didn't leave any comment to the rating