Weis Waves RSJ

4.64

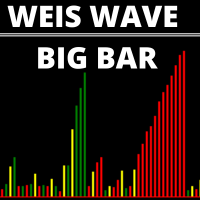
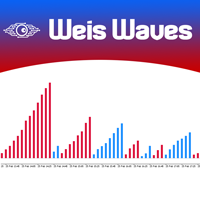
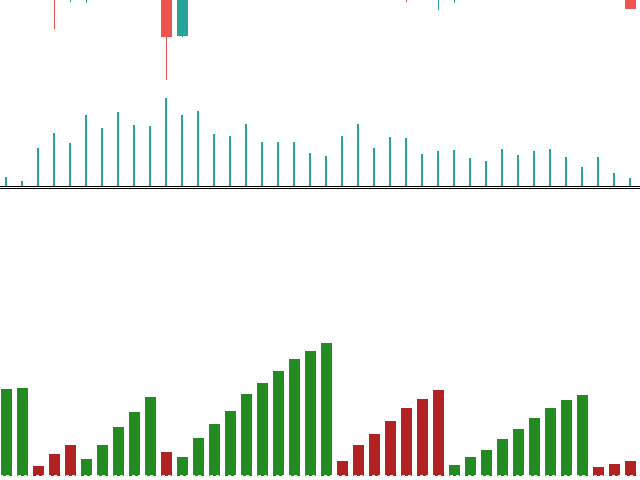
Weis Waves RSJ adds up the volume of each price wave and plots it as a histogram of cumulative volume for the alternating up and down waves.

This lets you compare the effort (volume) of each wave with its result (price progress) and see when a move is supported by volume or is losing strength.

How to read it

Each bar of the histogram is the total volume traded during one price wave.

When a trend is healthy, the waves in the direction of the trend usually show more volume than the corrections.

When price makes a new high or low but the wave volume is smaller than in the previous wave, the effort is not producing the same result, which can warn that the move is losing strength.

The indicator is drawn in a separate window and works on any symbol and timeframe that provides tick or real volume.

If you have questions, please send me a direct message: https://www.mql5.com/en/users/robsjunqueira/
Reviews 16
Marco Antonio
48
Marco Antonio 2026.07.14 18:35 

Parabéns!

Alessandro Lopes Da Silva
283
Alessandro Lopes Da Silva 2024.02.26 19:16 

Pessoal deixo aqui meu comentário e espero contribuir com voces! Esse indicador juntamente com medias moveis 9,21,50 no ativo US30 é uma maquina de fazer dinheiro, principalmente para quem trabalha com mesa proprietária. O melhor horário para operar é o de New York, excelentes gatilhos de entradas e saídas. Observação importante, procure sempre ir a favor da tendencia. No demais, muito obrigado Roberto Junqueira!!!

fj6hCuoc
119
fj6hCuoc 2023.09.12 09:46 

An excellent Volume Indicator

Recommended products
White Weis Volume Ticks
Ricardo Almeida Branco
5 (4)
White Weis Volume This indicator shows the sum of the volume in each wave, bulish or bearish, as idealized by David Weis , but it brings an important addition , which is the marking of the bar with the highest volume of the wave (White Bar)! In coding the indicator, it was sought to optimize the code to require minimal processing during use and not to overload mt5. The indicator can be used for pre-trading analysis and study, where the trader analyzes possible points of support and resistance
Simple Weis Wave
Jean Jacques Huve Ribeiro
3.67 (3)
One of the best tools for analyzing volume, Weis Wave was idelized by David Weis, to facilitate the reading of directional flow. For the VSA method disciples it is an evolution of the practices created by Richard Wycoff, facilitating a predictive reading of the market, always seeking an accumulation and distribution of the negotiated contracts. Cumulative wave volume  Range of wave ( removed) Average Wave volume Ref "Tim Ord lectures" ( removed)
FREE
Weis Wave Double Side
Eduardo Da Costa Custodio Santos
The Weis Wave Bouble Side Indicator for MT5 is part of the toolkit (Wyckoff Academy Wave Market) The Weis Wave Bouble side Indicator for MT5 was created based on the already established Weis Wave created by David Weis. The Weis Wave Double Side indicator reads the market in waves as it was done by R. Wyckoff in 1900. It helps in the identification of effort x result, cause and effect, and Supply and demand Its differential is that it can be used below the zero axis, further improving plus operat
Weis Waves
Flavio Javier Jarabeck
2.83 (18)
The original author is David Weis, an expert in the Wyckoff Method. The Weis Wave is a modern adaptation of the 1930's Wyckoff Method, another expert in Tape Reading techniques and Chart Analysis. Weis Waves takes market volume and stacks it into waves according to price conditions giving the trader valuable insights about the market conditions. If you want to learn more about this subject you can find tons of videos in YouTube. Just look for "The Wickoff Method", "Weis Wave" and "Volume Spread
FREE
Weis Wave Double Side Alert
Eduardo Da Costa Custodio Santos
The Weis Wave Bouble Side Indicator for MT5 is part of the toolkit (Wyckoff Academy Wave Market) The Weis Wave Bouble side Indicator for MT5 was created based on the already established Weis Wave created by David Weis. The Weis Wave Double Side indicator reads the market in waves as R. Wyckoff did in 1900. It helps in the identification of effort x result, cause and effect, and Supply and demand Its differential is that it can be used below the zero axis and has a breakout alert showing Who is s
THV Daily VWAP MT5 – Daily Volume Weighted Average Price THV Daily VWAP MT5 is a technical indicator designed to display the Daily Volume Weighted Average Price (VWAP) directly on your MetaTrader 5 chart. Unlike traditional VWAP indicators that may only display limited session data or reset at specific trading sessions, this indicator plots a continuous VWAP line throughout the trading day, making it easy to observe how price behaves relative to the daily volume-weighted average price. The VWAP
FREE
SMC with BB
Haradhan Sharma
================================================================================ SHORT TAGLINE ================================================================================ Institutional Smart Money Concepts: Real-time Market Structure (BOS/CHoCH), Order Blocks, Flipped Breaker Blocks, Fair Value Gaps (FVG), Premium/Discount Zones, and Live Volume Spike HUD. ================================================================================ FULL MQL5 MARKET PRODUCT DESCRIPTION ================
FREE
Weis Waves is a technical indicator developed by David Weis, inspired by Richard Wyckoff’s principles. Unlike traditional volume, which is shown bar by bar, Weis Waves accumulates volume into bullish or bearish “waves,” restarting the count whenever price changes direction. This method allows traders to clearly see the true strength of market moves , as each wave reflects the intensity of the volume behind a sequence of candles. Key features: Groups volume into buying and selling waves. Highl
FREE
Vwap Candles Matrix
Thales Bitencourt De Souza
Vwap Candles Matrix See what price alone cannot show. Vwap Candles Matrix is a professional market-flow analysis system for MetaTrader 5, created to transform complex volume and directional information into a clear visual structure. This is not a conventional buy/sell indicator. It is an analytical framework designed to reveal market participation, directional pressure, liquidity behavior and flow structure through a proprietary synthetic candle environment. Instead of adding more noise to the c
FREE
Value Chart Candlesticks
Flavio Javier Jarabeck
4.57 (14)
The idea of a Value Chart indicator was presented in the very good book I read back in 2020 , " Dynamic Trading Indicators: Winning with Value Charts and Price Action Profile ", from the authors Mark Helweg and David Stendahl. The idea is simple and the result is pure genius: Present candlestick Price analysis in a detrended way! HOW TO READ THIS INDICATOR Look for Overbought and Oversold levels. Of course, you will need to test the settings a lot to find the "correct" one for your approach. It
FREE
VWAP Historical Levels is a practical VWAP indicator for MetaTrader 5 that combines the current VWAP structure with important levels calculated from completed sessions or anchor periods. Its main advantage is the ability to preserve the previous period’s VWAP, Upper Band 1 and Lower Band 1 as horizontal historical levels. This makes it easier to see where price was previously considered balanced and how the current market reacts to those levels. HOW HISTORICAL LEVELS CAN BE USED At the end of ea
FREE
Master HMA
Leonel Alberto Jose Quintana
Master HMA for MetaTrader 5 Master HMA is a technical indicator for MetaTrader 5 that combines different Hull Moving Average calculations into a visual structure designed to analyze price direction, slope, and movement behavior. The indicator uses three HMA periods: Fast, Main, and Slow. The relationship between these lines helps identify changes in the movement structure and follow different market phases. The Main HMA uses different colors to represent the states identified by the system. The
FREE
Easy VWAP
Luca Spinello
VWAP Indicator, the short form of Volume Weighted Average Price, is similar to a moving average but takes into consideration the tick volume of the candles. The indicator calculates the moving average multiplying the price of each candle for the tick volume in the candle. Said calculation weighs with more significance price where more transactions were made. Features: Visual styling customizable Period customizable Ease of use
FREE
VWAP Indicator
LUC JACOBUS A VERHEECKE
4.11 (27)
Volume Weighted Average Price (VWAP) The volume weighted average price (VWAP) is a  trading   benchmark  used by traders that gives the average price a security has traded at throughout the day, based on both volume and price. It is important because it provides traders with insight into both the trend and value of a security. This indicator VWAP V2 is free and is the manual version of the extended Easy VWAP indicator (30 Euro), where the date and time properties are automatically entered. With
FREE
MIDAS Super VWAP
Flavio Javier Jarabeck
4.27 (11)
Imagine VWAP, MVWAP and MIDAS in one place... Well, you found it! Now you can track the movement of Big Players in various ways, as they in general pursue the benchmarks related to this measuring, gauging if they had good execution or poor execution on their orders. Traders and analysts use the VWAP to eliminate the noise that occurs throughout the day, so they can measure what prices buyers and sellers are really trading. VWAP gives traders insight into how a stock trades for that day and deter
FREE
Advanced Market Cypher B
Felipe Monteiro Rodrigues
Don't forget to comment and rate the product if you liked it! Advanced Market Cipher B Advanced Market Cipher B is an advanced indicator for MetaTrader 5 , developed to provide a complete view of momentum, market flow, trend, and divergences in a single tool. The indicator was based on the concept and visual structure of “VuManChu Cipher B + Divergences”, published on TradingView by vumanchu , adapting its main concepts to the MetaTrader 5 environment and incorporating additional features, visua
FREE
About Range Explosion Range Explosion is a powerful and free trading tool designed to detect market ranges, draw precise support and resistance zones, and identify breakout opportunities with accuracy and style. It is a part of the Break Out Explosion Project, offering traders a reliable and visually advanced solution for both beginners and professionals. If you are interested in breakout trading concepts, check out the advanced tool designed to detect trendline breakouts in the direction of the
FREE
Midas VWAP
Paulo Henrique Faquineli Garcia
4 (2)
Volume Weighted Average Price (VWAP) is a trading benchmark commonly used by Big Players that gives the average price a Symbol has traded throughout the day. It is based on both Volume and price. This indicator contains Daily VWAP and MIDAS' VWAP, which means you are able to anchor the beggining of MIDAS' calculations and, therefore you will be able to use this methodology to study price versus volume moves after anchor point. You will be able to anchor up to 3 HIGH MIDAS VWAP's and 3 LOW. Wish
FREE
VWAP + Volume Profile Combined Indicator FREE Launch Offer OVERVIEW Professional combination of VWAP (Volume Weighted Average Price)  and Volume Profile in a single MT5 indicator. This powerful tool  combines two of the most respected institutional trading tools  into one seamless display. KEY FEATURES 1. VWAP with 6 calculation modes 2. Volume Profile with Value Area analysis 3. Point of Control identification 4. Standard deviation bands 5. Dynamic color changing 6. Separate buy/sell vol
FREE
VWAP Diaria
Samuel De Souza Ferreira
Daily VWAP — Institutional Reference for Intraday Value The Daily VWAP is a professional indicator based on the Volume-Weighted Average Price (VWAP) , designed to reveal the true balance between price and volume throughout the trading session. Unlike traditional moving averages, the Daily VWAP incorporates the weight of traded volume in every price movement, providing a much more accurate reference to the behavior of institutional traders and large market participants. What the indicator deliver
FREE
Stackable VWAP
Flavio Javier Jarabeck
3.5 (4)
Volume Weighted Average Price (VWAP) is a trading benchmark commonly used by Big Players that gives the average price a Symbol has traded throughout the day. It is based on both Volume and price. Additionally we put in this indicator the MVWAP (Moving Volume Weighted Average Price). For those who do not know the usage and the importance od this indicator I recommend a great article about this subject at Investopedia ( https://www.investopedia.com/articles/trading/11/trading-with-vwap-mvwap.asp
FREE
Macro-R Pro Signal — Advanced Trading Signal Indicator Macro-R Pro Signal is a professional trading indicator designed to deliver high-quality BUY and SELL signals with enhanced precision and reduced market noise. By combining Bollinger Bands, RSI, and adaptive volatility filtering , this indicator helps traders identify high-probability reversal points while avoiding unfavorable market conditions. How the Strategy Works This indicator is built on a mean reversion + momentum confirmation concep
FREE
VWAP and MVWAP
Flavio Javier Jarabeck
4 (9)
Volume Weighted Average Price (VWAP) is a trading benchmark commonly used by Big Players that gives the average price a Symbol has traded throughout the day. It is based on both Volume and price. Additionally we put in this indicator the MVWAP (Moving Volume Weighted Average Price). For those who do not know the usage and the importance od this indicator I recommend a great article about this subject at Investopedia ( https://www.investopedia.com/articles/trading/11/trading-with-vwap-mvwap.asp )
FREE
The indicator highlights the points that a professional trader sees in ordinary indicators. VisualVol visually displays different volatility indicators on a single scale and a common align. Highlights the excess of volume indicators in color. At the same time, Tick and Real Volume, Actual range, ATR, candle size and return (open-close difference) can be displayed. Thanks to VisualVol, you will see the market periods and the right time for different trading operations. This version is intended f
FREE
Fractal Market Structure CHoCH BOS MT5 Fractal Market Structure CHoCH BOS MT5 is a price-action indicator designed to identify market structure through confirmed fractal formations. Instead of relying only on traditional swing-point calculations, the indicator analyzes structured candle patterns to locate important highs and lows, detect changes in directional behavior, and display relevant market structure events directly on the chart. The indicator can identify bullish and bearish Break of Str
Adaptive Volume Profile draws the Volume Profile of the latest bars directly on the chart: the Point of Control (POC), the Value Area (VAH / VAL), high-volume nodes (HVN), low-volume nodes (LVN) and an optional volume histogram. The size of the price rows adapts to the current volatility (ATR), so the profile stays readable on any symbol and timeframe. Features POC - the price level with the largest traded volume in the window Value Area (VAH / VAL) - the price range that contains the chosen sha
FREE
Frato Vwap Bands
Francisco Felipe Alves Da Silva Rocha
Frato VWAP Bands — Volume Weighted Average Price with Standard Deviation Frato VWAP Bands is an indicator that combines the traditional VWAP with dynamic volatility bands. It offers a multi-period view of the volume-weighted average price. Main Functionality: The indicator calculates the VWAP (Volume Weighted Average Price) and plots up to 3 upper and lower bands based on the standard deviation. The calculation is reset at the beginning of each new selected period (Hourly, H4, Daily, Weekly,
FREE
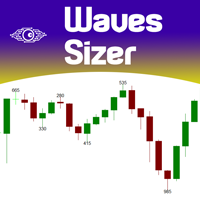
Waves Sizer
Flavio Javier Jarabeck
3.86 (7)
Wyckoff fans, enjoy! Ideally to be used with the Weis Waves indicator, but it can be easily used alone, the Waves Sizer puts the range (in resulting Price movement) done by the Price on its market swings. You can control how accurate or loose will be the swings. This tool is very helpful for visually know how much the Price has traveled in your Timeframe. This way you can confront this level of effort with the resulting Volume, etc... Weis Waves indicator: https://www.mql5.com/en/market/produc
FREE
Fair Value Gap Zone
Mattia Impicciatore
General Description The Fair Gap Value Indicator identifies and highlights “fair value gaps” on the MetaTrader 5 chart. A fair gap occurs when a price void forms between the low of one bar and the high of another, separated by an intermediate bar. The indicator draws colored rectangles (bullish and bearish) to emphasize these areas, providing clear visual support for price-action strategies. Key Features Bullish Gap Detection : highlights gaps between a bar’s low and the high of two bars prior w
FREE
RBM Nasdaq Liquidity Hunter Institutional Liquidity Indicator for Nasdaq RBM Nasdaq Liquidity Hunter is an advanced liquidity analysis tool developed for Nasdaq traders who want to identify institutional liquidity events with greater precision. Instead of highlighting every breakout, the indicator filters market noise and identifies only liquidity sweeps confirmed by volume, trend, and multiple institutional confluence factors. Every detected event is evaluated through a proprietary scoring
FREE
Buyers of this product also purchase
Trend Sniper X
Sarvarbek Abduvoxobov
4.86 (44)
Trend Sniper X is a multi-timeframe trend-following indicator for MetaTrader 5 that helps traders identify trend direction and potential reversal points with clarity and precision. for MT4: https://www.mql5.com/en/market/product/193245 Price Information: The current price is promotional and is subject to change as upcoming updates and new features are released. Bonus Offer: To get the FREE Auto-Trade Assistant EA for this indicator, please message the author after purchasing. Code2Profit Channe
A new King in town - Indicator + Order management indications(tp1+tp2+tp3) + Optional Telegram Signal sender   INCLUDED (FREE) + Bonus EA Robot ( FULL TRADING  and SIGNAL SYSTEM ) Our best EA for Gold: Gold Slayer TRY > Reversion Queen  Expert advisor >JOIN Community Channel < NEW Free Automation EA link < click here ( disclaimer: this is new and still on testing and phase , use at your risk on demo) Free Telegram Bridge < click here  This indicator includes an advanced Strategy, a trading sys
Smart Trend Trading System — MetaTrader 5 Message me on MQL5 after purchase to receive Smart Universal Expert Advisor for FREE, plus the online course, PDF manual, and private group access. STTS brings trend direction, entry and exit signals, reversal zones, and important price levels together on your chart. Follow the system manually, or connect a separate compatible EA for automated execution using your chosen settings. ONE SYSTEM. FOUR TRADING APPROACHES. STTS organizes its trading approaches
Zoryk Gold
Reda El Koutbane
4.78 (18)
discount ends SOON next price 69 $ ZORYK — Advanced XAUUSD Signal System for MetaTrader 5 You know the feeling. You spend time analyzing gold. You wait for the entry. You finally open the trade, and price immediately moves against you. You close too early, move the Stop Loss or hesitate for a few seconds. Then the market reaches the exact destination you originally expected without you. The direction was not always the problem. The real problem was uncertainty. You did not know exactly where th
Entry Points Pro shows you where to enter, where to put the stop and what lot to trade — before you place the order. PRICE Now 149 USD, and this is the last copy at this price. After it the price goes up to 199 USD, and the final price is 349 USD. I make my money trading the markets, and I show it, so I don't need to sell this indicator to everyone. It is a tool for traders who think for themselves, not a magic button. The arrow appears when the candle closes and does not repaint. Two setting
M5 Sniper
MeanFX
5 (4)
Get your trading edge in the line of sight M5 Sniper   is a new indicator by MeanFX. It combines   precise trading signals   with   adaptive TP/SL levels   - creating best possible statistical trades as a result! The price increases every 5 purchases, the next price is 79$ Message me after purchase to receive tips/guide and bonus EA plus trading methodology Auto Optimisation only works on LIVE chart , needs data feed >JOIN Community Channel < What makes it stand out?   Proven statistical per
SuperScalp Pro
Van Minh Nguyen
4.54 (37)
SuperScalp Pro - Professional Multi-Layer Confluence Scalping System SuperScalp Pro is an advanced scalping indicator that upgrades the classic Supertrend with multiple intelligent confirmation filters. It helps you identify higher-probability Buy/Sell opportunities while significantly reducing false signals. Clear Buy and Sell arrows appear directly on the chart, along with automatic ATR-based Stop Loss and Take Profit levels calculated in real time. After purchase, please message me on MQL5 to
Gold Trend Coach MT5
Cristhian Alexander Gaibor Cuasquer
4.2 (10)
Gold Trend Coach is a gold (XAUUSD) trend indicator for MetaTrader 5 with buy and sell signals, stop loss and three take profit targets confirmed on candle close (no repaint), a coach that guides you from the entry to TP3, a multi-timeframe dashboard and alerts to your phone and Telegram. Built for M1 and M5 scalping and M15 intraday during the London and New York sessions. BONUS: FREE Auto-Trade EA for Gold Trend Coach. Message me after purchase and I send you the EA that trades the indicator s
GoldenX Entry MT5
VividMind Digital Solutions
5 (17)
Price will increase by $20 every 10 buyers to maintain premium value. After purchase, contact via   MQL5 inbox   to receive your buyer kit and bonus. You have probably tested dozens of indicators before. But we are not here to be “just another signals indicator.” Behind GoldenX Entry is intensive research & development focused on building sophisticated algorithms designed to adapt to the real behavior of every instrument — not generic signals recycled everywhere else. From advanced Auto Optim
SMC Intraday Formula
VividMind Digital Solutions
5 (26)
Secure the Lowest Price Today. After purchase, contact via   MQL5 inbox   to receive your buyer kit and bonus. Let's be honest first. No indicator will make you profitable on its own. If someone tells you otherwise, they're selling you a dream. Every indicator that shows perfect buy/sell arrows can be made to look flawless — just zoom into the right window of history and screenshot the winners. We won't do that. SMC Intraday Formula is a tool. It reads the market structure for you, maps the hig
Gann Made Easy   is a professional and easy to use Forex trading system which is based on the best principles of trading using the theory of W.D. Gann. The indicator provides accurate BUY and SELL signals including Stop Loss and Take Profit levels. You can trade even on the go using PUSH notifications. PLEASE CONTACT ME AFTER PURCHASE TO GET TRADING  INSTRUCTIONS   AND GREAT EXTRA INDICATORS  FOR FREE! Probably you already heard about the Gann trading methods before. Usually the Gann theory is a
Ultra Indicator
Ihor Otkydach
5 (1)
ULTRA is a technical indicator that operates on an “all-in-one” basis—it independently analyzes the market, generates trading signals, displays levels for setting stop-loss orders, and suggests when to close trades to lock in profits or minimize losses. In other words, it doesn't matter if you don't know how to analyze the market, determine levels—where to set your stop-loss—or struggle with money management. ULTRA will do all of that for you! BUYER BONUS: After purchasing the ULTRA indicator, s
Boba Analysis Suite
Trade Ready Solutions LLC
5 (2)
Boba Analysis Suite Boba Analysis Suite is an analytical indicator for MetaTrader 5. It brings market structure, relevant price zones and broader market context together in a single chart view. Developed through practical experience as a trader and trading coach, it supports a structured analysis process: assessing market direction, identifying important levels and considering multiple timeframes together. Analysis in Context Individual signals gain meaning through context. Boba Analysis Suite h
Welcome to Entry In The Zone & SMC Multi Timeframe —  COMPLETE SMC ANALYSIS SYSTEM — ALL IN ONE INDICATOR Entry In The Zone & SMC Multi Timeframe  An indicator designed for market analysis based on Smart Money Concepts (SMC), displaying Market Structure, Key Zones (Order Blocks, Supply & Demand Zones, and Fair Value Gaps), Liquidity, and real-time BUY / SELL signals. It supports both Single-Timeframe and Multi-Timeframe analysis, along with the Confluence at Zone feature, which helps you evaluat
M1 Sniper MT5
Oleg Rodin
5 (7)
M1 SNIPER  is an easy to use trading indicator system. It is an arrow indicator which is designed for M1 time frame. The indicator can be used as a standalone system for scalping on M1 time frame and it can be used as a part of your existing trading system. Though this trading system was designed specifically for short-term trading, it still can be helpful for all traders. This trading system can be used with any forex pair and time frame, though lower time frames are recommended from M1 up to M
Gold Entry Sniper
Tahir Mehmood
5 (23)
Gold Entry Sniper – Professional Multi-Timeframe ATR Dashboard for Gold Scalping & Swing Trading Gold Entry Sniper is a cutting-edge MetaTrader 5 indicator designed to give traders precise buy/sell signals for XAUUSD and other symbols, powered by ATR Trailing Stop logic and a multi-timeframe analysis dashboard . Built for both scalpers and swing traders, it combines real-time market direction , dynamic stop levels , and professional visual dashboards to help you identify high-probability gold en
FiboSniper Pro
Van Minh Nguyen
5 (4)
FiboSniper Pro - Multi-Filter Fibonacci System with Auto SL/TP and Control Panel FiboSniper Pro is a technical indicator that combines dynamic Fibonacci Envelopes with multiple confirmation filters to generate selective Buy and Sell signals. Fibonacci levels are calculated from Moving Average and ATR, then filtered by ADX, EMA, RSI, ATR, Volume, Time and Candle structure. The indicator displays automatic ATR-based Stop Loss and Take Profit levels directly on the chart, along with an interactive
ARICoins
Temirlan Kdyrkhan
ARICoin is a powerful trading companion designed to generate high-probability entry signals with dynamic TP/SL/DP levels based on volatility. Built-in performance tracking shows win/loss stats, PP1/PP2 hits, and success rates all updated live. Key Features: Buy/Sell signals with adaptive volatility bands Real-time TP/SL/DP levels based on ATR Built-in MA Filter with optional ATR/StdDev volatility Performance stats panel (Success, Profit/Loss, PP1/PP2) Alerts via popup, sound, push, or email Cust
ScalpPoint
Temirlan Kdyrkhan
ScalpPoint is a powerful trading companion designed to generate high-probability entry signals with dynamic TP/SL/DP levels based on volatility. Built-in performance tracking shows win/loss stats, PP1/PP2 hits, and success rates — all updated live. Key Features: Buy/Sell signals with adaptive volatility bands Real-time TP/SL/DP levels based on ATR Built-in MA Filter with optional ATR/StdDev volatility Performance stats panel (Success, Profit/Loss, PP1/PP2) Alerts via popup, sound, push, or emai
Auto Optimized SpeedAngle is an institutional-grade momentum vectoring system that eliminates curve-fitting through continuous Walk-Forward Optimization (WFO). Rather than relying on static inputs that degrade when market regimes shift, the indicator dynamically recalibrates its parameters using Out-of-Sample (OOS) validation, ensuring the displayed signals represent genuine statistical edges rather than historical anomalies. By shifting the focus from subjective visual angles to normalized, qua
Adaptive Price Action Engine Buy Indicator- Get EA Based on it for FREE. Self-Optimizing Multi-Timeframe Trend & Candlestick Intelligence Markets do not behave the same way all the time—and not every price-action pattern has the same value in every market regime. Adaptive Price Action Engine is designed to adapt to changing market conditions by combining trend structure, multi-timeframe analysis, candlestick patterns, and statistical optimization into one analytical framework. Two Adaptive Mode
Crystal Heikin Ashi Signals
Muhammad Jawad Shabir
5 (5)
Crystal Heikin Ashi Signals—Professional Trend & Signal Detection Indicator Advanced Heikin Ashi Visualization with Intelligent Signal System for Manual & Automated Trading Final Price: $149 ---------> Price goes up $10 after every 10 sales . Limited slots available — act fast . Overview User Guide PDF Crystal Heikin Ashi Signals is a professional-grade MetaTrader 5 indicator that combines pure Heikin Ashi candle visualization with an advanced momentum-shift detection system. Designed for both m
Scalper Vault is a powerful, fully-equipped trading system designed for traders who want to achieve consistency in intraday trading . This high-precision indicator serves as a complete, standalone trading system that delivers institutional-grade analysis for both Forex and Binary Options traders. PLEASE CONTACT ME AFTER PURCHASE TO GET MY TRADING TIPS PLUS A GREAT BONUS! By eliminating the guesswork and complex manual analysis, Scalper Vault allows you to focus purely on execution using easy to
Trend Catcher ind mt5
Ramil Minniakhmetov
5 (18)
TREND CATCHER INDICATOR Trend Catcher Indicator analyzes market price movements, using a combination of the author’s proprietary and customized adaptive trend-analysis indicators.  It identifies the true market direction by filtering out short-term noise and focusing on underlying momentum strength, volatility expansion, and price structure behavior.  It also uses a combination of smoothing and trend-filtering customized indicators such as moving averages, RSI, and volatility filters.   Real ope
Tokyo mt5 Indicator
Vasiliy Strukov
5 (15)
Tokyo Indicator provides a clear visual overview of trend direction, potential trading signals, and market conditions. Its colour-coded, stepped trend line distinguishes bullish phases in blue from bearish phases in magenta. Matching directional arrows highlight potential buying and selling opportunities when the displayed trend changes. An integrated dashboard brings together the current signal, market bias, momentum, volatility, and signal quality in one convenient view. This allows traders t
Atomic Analyst MT5
Issam Kassas
4.5 (64)
Atomic Analyst — MetaTrader 5 Message me on MQL5 after purchase to receive Smart Universal Expert Advisor for FREE, plus the online course, PDF manual, and private group access. Atomic Analyst brings price action, trend direction, entry and exit signals, Stop Loss and multiple Take Profit levels together on your chart. SEE THE SIGNAL. UNDERSTAND THE SETUP. Atomic Analyst organizes its analysis into clear visual information: • Buy and sell arrows to identify potential entries. • Stop Loss and mul
Unix Scalper
Issam Kassas
4 (4)
Unix Scalper — MetaTrader 5 Message me on MQL5 after purchase to receive Smart Universal Expert Advisor for FREE, plus the online course, PDF manual, and private group access. Find the setup. See the plan. Choose how to trade it. UNIX Scalper brings market analysis, BUY/SELL/WAIT decisions and Entry, Stop Loss, TP1 and TP2 levels into one organized panel. SEE THE SIGNAL AND THE PLAN • Clear decisions: BUY, SELL or WAIT. • Defined levels: Entry, Stop Loss, TP1 and TP2. • Multi-timeframe overvie
SIO Oscillator: Self-Optimizing Semivariance Imbalance Oscillator Buy the indicator and get the Expert Advisor based on it for FREE. Most oscillators treat all price movement the same. SIO separates upside and downside market pressure and measures the imbalance between them, showing which side is really in control: buyers or sellers. When the imbalance reaches an extreme, SIO prints a clear signal with entry, Stop Loss and Take Profit levels. What makes SIO different is that it doesn’t rely on f
Volatility Master for MetaTrader is a real-time dashboard tool that scans up to  50 symbols  to identify high-volatility , trending markets instantly. With bullish/bearish signals, customizable alerts, and a user-friendly interface, it helps you avoid range-bound conditions and focus on high-probability trades. Clarity leads to confidence. Trade confidently and protect your capital effectively with this powerful dashboard. We don't offer free or bonus indicators in exchange of reviews from you.
Smc Pro ToolKit
Talal N Z Aljarusha
5 (14)
SMC PRO TOOLKIT — SMART MONEY ANALYSIS & STRUCTURED TRADE PLANNING SMC Pro ToolKit is a professional Smart Money Concepts analysis workspace for MetaTrader 5. It combines market structure, multi-timeframe analysis, institutional price zones, setup evaluation, confirmation tools, volume context, alerts, and risk planning inside one organized chart environment. One workspace. Multiple layers of confirmation. One structured trading plan. OPEN COMPLETE USER GUIDE MULTI-CONDITION SETUP ENGINE At
More from author
Candle Timer Countdown shows how much time is left to close the current candle. It updates every second, even when no new tick arrives, using the broker server clock. Want the same countdown on your order ticket? OCO Panel PRO shows it in its footer, next to one-click orders and saved OCO exits. WHAT IT SHOWS Time left as mm:ss, h:mm:ss, or days on D1, W1 and MN. "Market closed" when the symbol is outside its trading session. Daily % change, symbol and timeframe (each one can be turned on or off
FREE
MACD Intraday Trend
JETINVEST
4.81 (57)
Free Fibonacci-tuned MACD for intraday trends. Want alerts and the full toolkit? MACD Intraday Trend PRO MACD Intraday Trend is an Indicator developed through an adaptation made of the original MACD created by Gerald Appel in the 1960s. Through years of trading it was observed that by changing the parameters of the MACD with Fibonacci proportions we achieve a better presentation of the continuity of the trend movements, making that it is possible to more efficiently detect the beginning and end
FREE
SniperBot EURUSD
JETINVEST
5 (1)
The EA uses volatility, spread, frequency, and timing to decide when to trade. The EA uses the Limit Orders method to open Positions. In this case, the Slippage will at most be positive on executing the entries. Open trades are managed with a trailing take profit and a fixed stop loss. Most trades are closed within a short time. Main features Does not use martingale Does not use grid Optimized currency pair: EURUSD Timeframe: M5 Note: the EA trades only in a short window each day, from a few mi
Candle Timer Countdown shows how much time is left to close the current candle. It updates every second, even when no new tick arrives, using the broker server clock. WHAT IT SHOWS Time left as mm:ss, h:mm:ss, or days on D1, W1 and MN. "Market closed" when the symbol is outside its trading session. Daily % change, symbol and timeframe (each one can be turned on or off), and your own text before the timer. POSITION Any corner, top or bottom center, or next to the current price. Drag it with the m
FREE
Free Tabajara setup for B3. Trading WIN? See our Trend WIN B3 robot. Setup Tabajara was created by a Brazilian trader known as  "The OGRO of Wall Street" . The idea of this setup is to indicate to the trader the current trend of prices and  the type of operation should be looked for in the graph. Operation It does this through the positioning of the closing of the candles and the  vwap until 10:40am and after by the arithmetic mean of 20 periods painting the candles in 4 possible colors: Green
FREE
Up to 7 Fibonacci pivot levels per side. For graded supply/demand zones with retest count: Supply Demand RSJ PRO Pivot Point Fibo RSJ draws the daily pivot point and its support and resistance levels calculated with Fibonacci ratios. It plots up to 7 support levels and 7 resistance levels from the previous day's high, low and close. Traders use these levels as reference areas to plan entries, exits and stop placement during the day. Features Up to 7 levels of support and 7 levels of resistance F
FREE
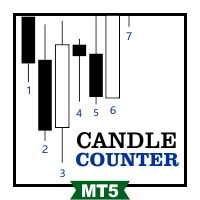
Candle Counter RSJ prints the number of each candle counted from the first candle of the day. The first candle of the day is number 1 and each new candle adds 1 to the count. Input Parameters Show even, odd or all numbers Distance between the candle and the number Text font size Text font color How to use Counting candles helps when a setup depends on the number of bars since the market opened, for example a rule that only takes trades after the third candle of the day, or a review of what happe
FREE
Supply Demand RSJ Zones draws supply and demand zones on any symbol and timeframe, with two strength levels. WHAT IT DOES Finds the turning points of price and turns them into supply and demand zones. Strong zones are drawn in the full color: the most significant zones on the chart. Weak zones are drawn in a faded tone: zones of lower significance. Zones that are no longer valid are removed. Overlapping zones are merged. Supply zones are red and demand zones green by default. Zones are recalcula
FREE
Daily Volume Profile RSJ: free volume profile of the current day for any symbol, with POC, VAH and VAL. WHAT IT SHOWS - Volume profile of today, updated during the day. - POC (price with the most volume), VAH and VAL (value area, 70% by default) with labels. - Value area rows highlighted. - Small panel with today's POC, VAH, VAL and total volume. - Lines and texts adapt to light and dark chart backgrounds. DATA Built from 1-minute bars: real volume when the feed has it (stocks, futures), tick
FREE
Delta Aggression Volume shows, candle by candle, whether aggressive buyers or aggressive sellers traded more, on symbols with real trades such as B3 and CME futures. WHAT IT DOES Computes the aggression delta of each candle: volume of aggressive buys minus volume of aggressive sells. Plots the balance of every candle in a separate window, colored by the side that won. REQUIREMENTS Exchange symbols with real trades: B3 futures and stocks (WIN, WDO, PETR4 …) and CME futures (ES, NQ, CL, GC and the
FREE
Free Fibonacci-tuned MACD for intraday trends. Want alerts and the full toolkit? MACD Intraday Trend PRO MT4 MACD Intraday Trend is an Indicator developed through an adaptation made of the original MACD created by Gerald Appel in the 1960s. Through years of trading it was observed that by changing the parameters of the MACD with Fibonacci proportions we achieve a better presentation of the continuity of the trend movements, making that it is possible to more efficiently detect the beginning and
FREE
Tabajara Ogro
JETINVEST
4.77 (13)
Free Tabajara setup for B3. Trading WIN? See our Trend WIN B3 robot. The Tabajara setup was created by a Brazilian trader known as "The OGRO of Wall Street". It shows the current trend and the type of trade to look for on the chart. How it works The indicator compares the closing price with the 20-period simple moving average and paints the candles in 4 colors: Green: price rising in an uptrend (look for buy entries) Black: price correcting in an uptrend (look for buy entries) Red: price falling
FREE
MACD Intraday Trend PRO shows when an intraday trend starts and when it runs out of strength, using a MACD re-tuned with Fibonacci proportions. Works on any symbol, any timeframe and on Renko charts. The free version is rated 4.8 by 56 traders. PRO is the full toolkit built on the same engine. What it does Fibonacci-proportioned MACD settings that keep trend moves readable instead of choppy Highlights trend start and trend exhaustion on the indicator window Same logic as the free MACD Intraday T
Aggression Wave RSJ adds up the difference between buy and sell aggression candle after candle and plots it as waves, so you can see which side is controlling the order flow during the day. WHAT IT DOES Computes the aggression delta of each candle (aggressive buys minus aggressive sells) and accumulates it into waves. Colors each wave by direction, so a change of control between buyers and sellers is visible at a glance. Draws a signal line over the waves to show the direction of the flow. REQUI
FREE
VWAP Fibo Bands RSJ
JETINVEST
4.83 (12)
VWAP Fibo Bands RSJ draws the VWAP of the selected period and builds bands around it using Fibonacci proportions. The indicator plots 10 band levels around the VWAP. The bands show how far price has moved from the volume weighted average price and can be used as reference levels to plan entries, exits and stops. The bands are easiest to read on timeframes of 30 minutes and below. Inputs Calculation Volume Type Calculation Price Type VWAP Period Time Each band is drawn at a fixed Fibonacci distan
FREE
Up to 7 Fibonacci pivot levels per side. For graded supply/demand zones with retest count: Supply Demand RSJ PRO Pivot Point Fibo RSJ draws the daily pivot point and its support and resistance levels calculated with Fibonacci ratios. It plots up to 7 support levels and 7 resistance levels from the previous day's high, low and close. Traders use these levels as reference areas to plan entries, exits and stop placement during the day. Features Up to 7 levels of support and 7 levels of resistance F
FREE
Volume By Color RSJ paints the volume bar in a darker color when the traded volume is above its own moving average, so candles with unusual activity stand out. An optional four-color mode shows the strength of each candle's volume in steps. By default the indicator compares each bar with the 20-period simple average of the volume. The average type and period can be changed in the inputs. How to use The colored bars make it easy to spot breakouts, rejections and climax candles that happen with vo
FREE
Vwap RSJ
JETINVEST
4.82 (11)
VWAP RSJ plots the hourly, daily, weekly and monthly VWAP lines on the same chart. Large institutional buyers and funds use the VWAP to enter and exit positions with the smallest possible market impact. They usually try to buy below the VWAP and sell above it, which tends to pull price back toward the average. This indicator combines the four VWAP periods so you can see where price stands against each of them. How to read it Each VWAP line starts again at the beginning of its period: the hourly
FREE
Volume By Color RSJ paints the volume bar in a darker color when the traded volume is above its own moving average, so candles with unusual activity stand out. An optional four-color mode shows the strength of each candle's volume in steps. By default the indicator compares each bar with the 20-period simple average of the volume. The average type and period can be changed in the inputs. How to use The colored bars make it easy to spot breakouts, rejections and climax candles that happen with vo
FREE
MACD Intraday Trend PRO is an Indicator developed through an adaptation made of the original MACD created by Gerald Appel in the 1960s. Through years of trading it was observed that by changing the parameters of the MACD with Fibonacci proportions we achieve a better presentation of the continuity of the trend movements, making that it is possible to more efficiently detect the beginning and end of a price trend. Due to its efficiency in detecting price trends, it is also possible to identify ve
JET Trade Assistant PRO is a complete trade panel and trade manager for MetaTrader 4. Choose your risk, draw the trade on the chart and send it in one click — the panel calculates the volume and manages the trade until the last exit. Same panel, inputs and texts as the MetaTrader 5 version 3.00. HIGHLIGHTS Reverse: close the open side of the symbol and open the opposite one in one click (or Shift + V), confirmed by a second click; mirrored stop loss and take profit; same volume or recalculated f
Renko Price Action ATR builds a Renko chart in which the size of each brick is calculated from the ATR of the period you select. Renko charts filter out small price movements, so trends, supports and resistances, and top and bottom divergences are easier to see. Operation Works with any symbol. The Renko chart is updated in real time. Settings ATR Calculation Timeframe: timeframe used to calculate the ATR and the brick size. ATR Calculation Averaging Period: number of periods of the ATR average.
B3 AND CME FUTURES (WIN, WDO, B3 STOCKS, ES, NQ, CL, GC) Aggression Wave PRO adds up, candle after candle, the difference between buy and sell aggression since the start of the day and plots it as a wave, so you can see which side has been controlling the order flow during the session. It needs a broker that delivers the real trades of the symbol with their aggressor side (buy or sell). Forex, CFD and most crypto feeds have no trades, so on a live chart of these symbols the window stays empty. U
B3 AND CME FUTURES (WIN, WDO, B3 STOCKS, ES, NQ, CL, GC) Delta Aggression Volume PRO shows, candle by candle, whether aggressive buyers or aggressive sellers traded more, and marks the candles where aggression and price disagree. It needs a broker that delivers the real trades of the symbol with their aggressor side (buy or sell). Forex, CFD and most crypto feeds have no trades, so on a live chart of these symbols the window stays empty. Use the free Delta Aggression Volume to see the basic per-
Supply Demand RSJ PRO draws supply and demand zones automatically, grades each one (Weak, Strong, Verified, Proven) and counts how many times price has retested it. Any symbol, any timeframe. What it does Supply zones: where selling overwhelmed buying and pushed price down Demand zones: where buying overwhelmed selling and pushed price up Zone grading in 4 levels: Weak, Strong, Verified, Proven Labels with zone type and retest count, so you see which levels the market keeps respecting Zone filte
Trend WDO B3
JETINVEST
5 (1)
Trend WDO B3 is a professional trading system created for the MT5 platform and optimized to work with MINI DOLAR INDEX (WDO) on B3 in BRAZIL. The system uses Fuzzy Logic in several timeframes (1M, 5M, 15M, 30M, H1, H4, D1) to identify the price trend, applying weights in each timeframe according to the calculations made. After identifying the trend, the system places a STOP order (BUY or SELL) based on the average volatility, and once the position is opened, the EA manages the trade with a trail
Trend WIN B3
JETINVEST
5 (4)
Trend WIN B3 is a professional trading system created for the MT5 platform and optimized to work with MINI FUTURE INDEX (WIN) on B3 in BRAZIL. The system uses Fuzzy Logic in several timeframes (1M, 5M, 15M, 30M, H1, H4, D1) to identify the price trend, applying weights in each timeframe according to the calculations made. After identifying the trend, the system places a STOP order (BUY or SELL) based on the average volatility, and once the position is opened, the EA manages the trade with a trai
Sniper Major
JETINVEST
5 (1)
The EA uses volatility, spread, frequency, and timing to decide when to trade. The EA uses the Limit Orders method to open Positions. In this case, the Slippage will at most be positive on executing the entries. Open trades are managed with a trailing take profit and a fixed stop loss. Most trades are closed within a short time. Main features Does not use martingale Does not use grid Optimized currency pairs: EURUSD | GBPUSD | USDJPY | USDCHF Timeframe: M5 Note: the EA trades only in a short wi
Session & Killzones PRO draws the Asia, London and New York sessions and the ICT killzones on your chart, with the range of each session, previous day high/low and ADR projections. Daylight saving is handled per market, so the boxes stay in the right place all year without changing any setting. WHAT IT DOES Session boxes: Asia (Tokyo 09:00-18:00), London (08:00-17:00) and New York (08:00-17:00), each in its own local time US and UK daylight saving applied separately: the 2 to 3 weeks a year when
FVG and Structure PRO marks market structure (BOS / CHoCH), fair value gaps, order blocks and equal highs/lows on your chart: the price action concepts used by ICT and Smart Money traders. Every element is confirmed on a closed candle, so nothing on the chart is redrawn after it appears. WHAT IT DOES Swing highs and lows with adjustable strength; BOS (continuation) and CHoCH (change of character) drawn on candle close Optional HH / HL / LH / LL labels on every swing Fair value gaps (three-candle
Filter:
Marco Antonio
48
Marco Antonio 2026.07.14 18:35 

Parabéns!

JETINVEST
402320
Reply from developer Roberto Sant Ana Junqueira 2026.07.24 11:46
Obrigado pelo review
ROBSON SOUZA
18
ROBSON SOUZA 2026.07.01 15:13 

Alessandro Lopes Da Silva ..me chamo Robson essa ferramenta ajuda mesmo obrigado

Damian Blaha
988
Damian Blaha 2025.03.27 04:11 

отличный индикатор

JETINVEST
402320
Reply from developer Roberto Sant Ana Junqueira 2025.03.27 10:41
tks for the review
Flaviona
134
Flaviona 2025.03.23 21:52 

User didn't leave any comment to the rating

JETINVEST
402320
Reply from developer Roberto Sant Ana Junqueira 2025.03.25 10:47
tks for the review
Rafal Krzysztof Manuszewski
2407
Rafal Krzysztof Manuszewski 2024.10.06 17:09 

👍

JETINVEST
402320
Reply from developer Roberto Sant Ana Junqueira 2024.10.08 17:59
Obrigado por seu Review
Alessandro Lopes Da Silva
283
Alessandro Lopes Da Silva 2024.02.26 19:16 

Pessoal deixo aqui meu comentário e espero contribuir com voces! Esse indicador juntamente com medias moveis 9,21,50 no ativo US30 é uma maquina de fazer dinheiro, principalmente para quem trabalha com mesa proprietária. O melhor horário para operar é o de New York, excelentes gatilhos de entradas e saídas. Observação importante, procure sempre ir a favor da tendencia. No demais, muito obrigado Roberto Junqueira!!!

JETINVEST
402320
Reply from developer Roberto Sant Ana Junqueira 2024.02.26 19:18
Obrigado por seu Review Alessandro
fj6hCuoc
119
fj6hCuoc 2023.09.12 09:46 

An excellent Volume Indicator

JETINVEST
402320
Reply from developer Roberto Sant Ana Junqueira 2024.02.26 19:18
tks for the review
CARLOS CESTARI
33
CARLOS CESTARI 2022.03.31 05:12 

Muito bom, fica melhor se for usado junto com o Heiken_Ashi. Obrigado.

JETINVEST
402320
Reply from developer Roberto Sant Ana Junqueira 2024.02.26 19:19
obrigado pelo review
robkey
24
robkey 2022.02.13 11:19 

muito bom obrigado

JETINVEST
402320
Reply from developer Roberto Sant Ana Junqueira 2024.02.26 19:19
obrigado pelo review
mchelpmf
186
mchelpmf 2022.02.05 14:31 

The indicator has potential, it is promising

JETINVEST
402320
Reply from developer Roberto Sant Ana Junqueira 2024.02.26 19:19
tks for the review
T0uro22
34
T0uro22 2021.10.31 20:30 

Gostei... obrigado

JETINVEST
402320
Reply from developer Roberto Sant Ana Junqueira 2023.09.15 16:34
obrigado pelo review
Guilherme Guimaraes Dias
758
Guilherme Guimaraes Dias 2021.08.31 03:37 

User didn't leave any comment to the rating

JETINVEST
402320
Reply from developer Roberto Sant Ana Junqueira 2021.09.03 21:49
Obrigado Guilherme
Fabio_Novaes
175
Fabio_Novaes 2021.06.30 21:44 

User didn't leave any comment to the rating

JETINVEST
402320
Reply from developer Roberto Sant Ana Junqueira 2021.06.30 23:10
tks
33359
82
33359 2021.06.23 06:10 

Хороший индикатор.

JETINVEST
402320
Reply from developer Roberto Sant Ana Junqueira 2021.06.30 16:05
Tks for your review.
Marilise Ravaglio Da Cunha Junqueira
386
Marilise Ravaglio Da Cunha Junqueira 2021.06.06 15:23 

User didn't leave any comment to the rating

JETINVEST
402320
Reply from developer Roberto Sant Ana Junqueira 2021.06.30 16:05
Tks for your review.
30886094
14
30886094 2021.05.03 21:00 

Olá roberto, tudo bem? Indicador perfeito e muito bom. Ele esta me ajudando bastante. Parabéns!

Abraços,

Abel

JETINVEST
402320
Reply from developer Roberto Sant Ana Junqueira 2021.06.30 16:05
Tks for your review.
Reply to review