MACD Intraday Trend MT4

4.73

Free Fibonacci-tuned MACD for intraday trends. Want alerts and the full toolkit? MACD Intraday Trend PRO MT4

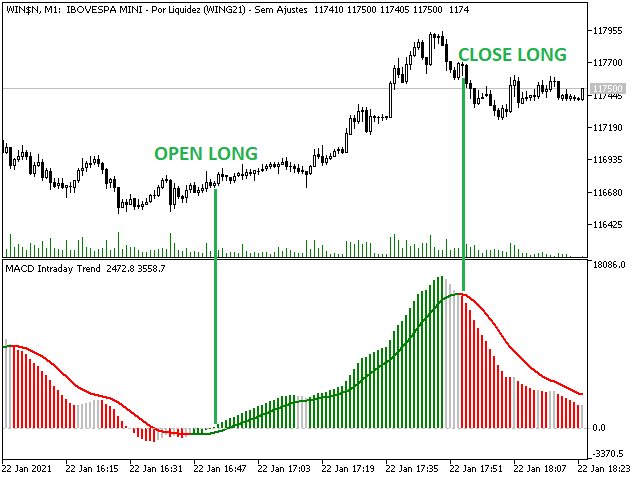
MACD Intraday Trend is an Indicator developed through an adaptation made of the original MACD created by Gerald Appel in the 1960s.

Through years of trading it was observed that by changing the parameters of the MACD with Fibonacci proportions we achieve a better presentation of the continuity of the trend movements, making that it is possible to more efficiently detect the beginning and end of a price trend.

Due to its efficiency in detecting price trends, it is also possible to identify very clearly the divergences of tops and bottoms, thus taking better advantage of trading opportunities.


Features

  • Works with any currency pair
  • Works at any timeframes
  • Works with Renko charts


If you still have questions, please contact me by direct message: https://www.mql5.com/en/users/robsjunqueira/
Reviews 22
sunnychow
9773
sunnychow 2026.09.21 12:13 

Good tool

zofesu
350
zofesu 2023.02.03 16:15 

Great job. It is clean and relatively accurate when combined with MA on a higher time frame.

731073
69
731073 2022.10.21 21:15 

Very helpful

Recommended products
MACD divergence Simple edition 原始MACD计算方式,升级为双线MACD,使判断更加直观更加贴合大宗交易平台的研究习惯,同时还会自动用实线标出背离,不用再从0开始苦学钻研。 同时,我还提供了提醒服务,在你忙于家务无暇顾及的时候只需要打开音响,一旦达成背离,第一时间就会让你知晓。 这是一款简单版的看背离指标,MACD的九天均线被称为“信号线”,然后绘制在MACD线的顶部,它可以作为买入和卖出信号的触发器。当MACD越过信号线时,交易员可以买入操作,当MACD穿过信号线以下时,交易者可以卖出或做空操作。移动平均收敛-发散(MACD)指标可以用几种方法解释,但更常见的方法是交叉、散度和快速上升/下降。
FREE
RSI divergence indicator is a multi-timeframe and multi-symbol indicator that help us find divergences between price chart and RSI indicator. Always use the divergence indicators with other technical assets like support resistance zones, candlestick patterns and price action to have a higher possibility to find trend reversals. This indicator will identify the peaks and troughs of both price and the RSI indicator. You can adjust the parameters to adjust the strength and weakness of these peaks a
FREE
GTAS STrend
Riviera Systems
4.5 (2)
GTAS S-Trend is a momentum indicator that helps to determine trends using combination of MACD, RSI and moving averages. This indicator was created by Bernard Prats Desclaux, proprietary trader and ex-hedge fund manager, founder of E-Winvest. Description The indicator oscillates between -65 and +65 with a neutral zone between -25 and +25 around a 0 equilibrium line. S-Trend between -25 and +25 indicates congestion zones with a bullish bias between 0 and +25, and a bearish bias between 0 and -25.
FREE
TCL Trend Radar
Stratos Digital (PVT) Ltd
TCL Trend Radar is a multi-timeframe trend dashboard for MetaTrader 4. It applies a three-condition algorithm (Moving Average cross plus Directional Movement Index plus Average Directional Index gate) to grade the trend on every standard timeframe and displays the result on a single panel. How It Works For each timeframe the indicator computes three things: the relationship between a Fast and a Slow Moving Average, the Directional Movement Index (DMI) for trend direction, and the Average Directi
FREE
The indicator is designed for intraday trading. Equipped with all notification functions for convenience in manual trading. It is recommended to use timeframes m5, m15, m30. You can also view and select settings for any financial instrument. Settings: Indicator period - Indicator period Alert - The function of enabling alerts. Push notifications - Enabling Push notifications to the mobile terminal e-mail - Sending a signal to e-mail In addition to this product, I recommend looking at my othe
FREE
Price Action Demand & Supply Reversal Dashboard Price Action Demand & Supply Reversal Dashboard is a powerful multi-symbol scanning indicator designed to identify high-probability reversal setups across your entire watchlist and present them in a clean, real-time dashboard. It combines core Smart Money Concepts (SMC) and price action logic into a single tool, helping traders quickly locate the strongest reversal opportunities without manually analyzing dozens of charts. Core Functionality Multi-
FREE
The   OHLC indicator   shows the current and historical values of High, Low, Open, Close and Mid for a specific time period. It can plot the current values or the values from the previous session. The indicator's range can be calculated from a daily, weekly, monthly, or user-specified session. Levels High  of the current or previous session. Low  of the current or previous session. Open  of current or previous session. Close  of the current or previous session. Midpoint  of the current or prev
FREE
Auto Fibo Retracement MT4
Nguyen Tuan Son
3.75 (4)
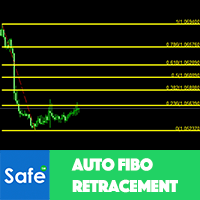
Auto Fibonacci Retracement Indicator — Flexible and Reliable This is not just another Auto Fibonacci Retracement indicator — it’s one of the most flexible and dependable tools available . If you find it useful, please leave a review or comment to support the project. Check out my other helpful tools below: Telegram to MT4 using AI   - AI-Powered Signal Copier Bot Timeframes Trend Scanner    - Scan the trend of assets in difference timeframes with multiple indicators Market Trend Scanner   - Scan
FREE
Email Drawdown Alert
Roman Starostin
5 (12)
Free informative Indicator-helper. It'll be usefull for traders who trade many symbols or using grid systems (Averaging or Martingale). Indicator counts drawdown as percent and currency separate. It has a number of settings: Count deposite drawdown according equity value and send e-mail or notifications to user if DD more than set; Sending e-mail when max open orders reached; Shows price and remaining pips amount before MarginCall on current chart and Account generally; Display summary trade lot
FREE
MACD Scanner With Alerts
Niravkumar Maganbhai Patel
4 (2)
MACD Dashboard Panel   This indicator helps you to scan symbols which are in the Market Watch window and filter out a trend according to MACD. Moving Average Convergence Divergence (MACD) is a trend-following momentum indicator that shows the relationship between two moving averages of a security’s price. The MACD is calculated by subtracting the 26-period Exponential Moving Average (EMA) from the 12-period EMA. The result of that calculation is the MACD line. A nine-day EMA of the MACD called
FREE
The MACD (Moving Average Convergence Divergence) indicator is one of the most widely used technical analysis tools by traders worldwide. Created by Gerald Appel in the 1970s, the MACD is an indicator that helps investors identify the trend direction, trend strength, and possible trend reversal points. The MACD indicator is composed of a histogram that shows the difference between the 12-period exponential moving average and the 26-period exponential moving average. The top part of the histogram
FREE
MACD Trend FREE
Vojtech Svobodnik
4.5 (2)
MACD Trend FREE is Expert Advisor for EURJPY  based on MACD Indicator . You can completely edit settings of MACD Indicator, TakeProfit, StopLoss and TrailingStop. Default paramters are optimized for best results. But you can test other settings for antoher currency pairs or timeframe. MACD Trend FREE  has been tested from year 2003 to 2021 . My test used the real tick data with 99,90% accuracy. Doesn't use Martingale or other dangerous strategies.  Recommendations Symbol:   EURJPY Timeframe:  
FREE
This indicator calculates average speed of moving average indicator. Here is parameters: BarsToProcess - indicator calculating period; MaPeriod - period of Moving Average indicator; AveragingPeriod - period (MA values) of the basis of which the average value is calculated; MA_Method, MA_Apply_to - using to set MA indicator parameters; Thats all! Good luck.
FREE
Awesome MACD Indicator
Komang Putra Riswanjaya
5 (1)
AWESOME MACD INDICATOR Awesome MACD Indicator is a powerful trading tool that combines the strengths of Moving Average (MA) and Moving Average Convergence Divergence (MACD) to provide accurate and reliable trading signals. Designed for forex and stock traders, this indicator simplifies the identification of trading opportunities by detecting significant crosses in price movements. Key Features: MA and MACD Combination: Awesome MACD leverages the power of Moving Averages (MA) to identify short-te
FREE
MTF Ultimate Oscillator Matrix (Free Advanced Multi-Timeframe Dashboard) The Multi-Timeframe Ultimate Oscillator Matrix is an institutional-grade technical scanner designed to evaluate momentum convergence across three distinct lookback horizons on four execution timeframes simultaneously. By monitoring the M15, H1, H4, and D1 intervals concurrently, this utility completely eliminates multi-chart cluttering and gives traders an instant executive matrix of weighted momentum expansion and overbou
FREE
BeST Oscillators Collection
Eleni Koulocheri
4.6 (5)
BeST Oscillators Collection is a Composite MT4 Indicator including the  Chaikin,Chande  and TRIX Oscillators which by default are contained in  MT5  but not in  MT4 platform. It  also provides  the option of displaying or not a Mov. Avg. as a Signal   Line and the resulting Signals as Arrows in a Normal (all arrows) or in a Reverse Mode (without showing up any resulting successive and of same type arrows). Analytically for each one of the specific Oscillators: The Chaikin Oscillator ( CHO )   is
FREE
RS 24 Titanium
Ilgiz Kamaev
4 (1)
Indicator RS 24 Titanium is a multi-currency and multi-timeframe signal indicator created by the author's algorithm. Designed to quickly assess the trend (the mood of market participants) on all timeframes simultaneously, for a specific financial instrument. RS 24 Titanium scans readings from all timeframes for one financial asset and displays data in the form of a visual table. The indicator can be used with any broker (with 4/5-digit quotes). The received trading signals can and should be used
FREE
RelicusRoad MACD v2
Relicus LLC
4.67 (6)
The Moving Average Convergence Divergence (MACD) trading strategy is a popular technical analysis tool that is used to identify changes in momentum and trend direction. The MACD is calculated by subtracting the 26-period exponential moving average (EMA) from the 12-period EMA. A 9-period EMA, called the "signal line," is then plotted on top of the MACD to act as a trigger for buy and sell signals. Want support and every tool in one streamlined indicator? This MACD is part of the RelicusRoad Pr
FREE
SMA Indicator
Nitu Brijesh Yadav
Arrow Indicator (Buy/Sell Alerts) – Simple Yet Powerful Tool!             Product Version: 1.01           Indicator Type: Trend Reversal Signals           Timeframes Supported: All (Recommended: H1, H4, D1)           Key Features: Buy Signal: Green upward arrow () appears below the candle  Sell Signal : Red downward arrow () appears above the candle Accurate Trend Reversal Detection – Based on tried and tested SMA strategy. ️ Clean Chart View – Minimalist, non-i
FREE
UPD1 Rsi Dots Dashboard
Vitaliy Kuznetsov
5 (2)
The indicator shows signals based on the terminal RSI oscillator on the chart. It is possible to filter out repeated signals. Here the oscillator is used to search for a reverse signal. It is recommended as an entry point in swing strategies and trading from levels. A multi-currency dashboard is available. With it, you can easily switch between charts. In product discussions, you can suggest an algorithm in which you can embed a dashboard. Input parameters. Main Settings. Bars Count – the n
FREE
Free automatic Fibonacci is an indicator that automatically plots a Fibonacci retracement based on the number of bars you select on the BarsToScan setting in the indicator. The Fibonacci is automatically updated in real time as new highest and lowest values appears amongst the selected bars. You can select which level values to be displayed in the indicator settings. You can also select the color of the levels thus enabling the trader to be able to attach the indicator several times with differe
FREE
Эксперт  MACD_LevelTrader создан для торговле валютной пары XAUUSD. Данная версия это наработки того, что можно извлечь  из  индикатора MACD и Moving Average.   Важно перед тестированием изменить настройку с 1000 на 5000                       Offset in points UP from SMA200 for sell            5000                       Offset in points DOWN from SMA200 for buy        5000   Тайм фрейм  М5. Два варианта логики, П араметр  true=вход по уровню  MACD + SMA200, false=вход по MACD  Тестируйте на демо
FREE
TCL Boom and Crash
Stratos Digital (PVT) Ltd
TCL Boom Crash is a signal indicator for MetaTrader 4 that combines a Relative Strength Index (RSI) layer, Stochastic oscillator confirmation, optional RSI divergence detection, and a multi-factor trend filter. Signal arrows are plotted on the chart when the configured filters agree. How It Works Each potential signal is built from three layers: RSI crossing its overbought or oversold level, Stochastic oscillator confirmation, and optional RSI divergence detection. A separate trend filter using
FREE
Wise Men Indicator demo
Bohdan Kasyanenko
3 (2)
The indicator displays signals according to the strategy of Bill Williams on the chart. Demo version of the indicator has the same features as the paid, except that it can work only on a demo account . Signal "First Wise Man" is formed when there is a divergent bar with angulation.  Bullish divergent bar - with lower minimum and closing price in the upper half. Bearish divergent bar - higher maximum and the closing price at the bottom half. Angulation is formed when all three lines of Alligator
FREE
Auto Supply and Demand Oscillator is an indicator for MetaTrader 4 and MetaTrader 5 that detects supply and demand zones automatically and displays them as a single oscillator value at the bottom of the chart, instead of drawing rectangles directly on price. Concept Supply zones are price areas where strong selling created a sharp downward move away from a balance area. Demand zones are price areas where strong buying created a sharp upward move. Traditional implementations draw boxes on the
FREE
Rainbow MT4
Jamal El Alama
Rainbow MT4 is a technical indicator based on Moving average with period 34 and very easy to use. When price crosses above MA and MA changes color to green, it’s a signal to buy. When price crosses below MA and MA changes color to red, it’s a signal to sell. The Expert advisor ( Rainbow EA MT4) based on Rainbow MT4 indicator, as you can see in the short video below is now available here .
FREE
Pivot Mean Oscillator
Marco Calabrese
4 (1)
Pivot Mean Oscillator (PMO) is a unbounded zero-centered oscillator that provides a quick and normalized measure of divergence between two spreads. Detailed description of the mathematical formulation along with some comments and experiments can be found in this article .  Trading aspects This version of PMO is tuned on spreads relative to Close and Open price signals against their cumulative moving average (CMA). Positive PMO(m,n) values means that last (normalized) m Close prices are higher t
FREE
EA Scalping Expert
Gerard Valldosera Gomez
3 (1)
This is a fully automated scalping Expert Advisor that can be run successfully using EURUSD currency pair at H1 timeframe. This EA can't run in the same account. If you want an Expert Advisor that trades daily this is not because it requires patience to wait for a few days or weeks on the right opportunity for it to trade. It takes advantage of the volatility of the price movement.
FREE
Line
Andrea Fontanini
free only until the end of the week The following indicator must be used and contextualized according to your trading methodologies. It provides excellent trading insights and identifies rejection zones on the drawn lines. Several parameters can be customized. The indicator will plot three levels above and below the opening price on D1, W1, and MN1. It will provide the daily ADR and display two additional daily sessions (EUROPE session and USA session). The colors of the various lines can be cu
FREE
MACD Candle Signal
Jonathan Destailleur
4.75 (4)
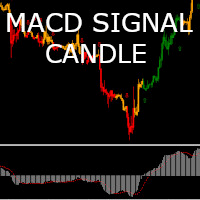
The MACD Signal Candle indicator  changes color according to the MACD trends. Colored Candles, based on MACD. HOW IT WORKS For a Buy:  -If the indicator is above zero, the market is bullish. -If the market is bullish, you can take a stand with green candle signals. For a Sell: -If the indicator is below zero, the market is bearish. -If the market is bearish, you can take a stand with the red candles.
FREE
Buyers of this product also purchase
Trend SniperX MT4
Sarvarbek Abduvoxobov
5 (5)
Trend Sniper X is a multi-timeframe trend-following indicator for MetaTrader 5 that helps traders identify trend direction and potential reversal points with clarity and precision. For MT5: https://www.mql5.com/en/market/product/181101 Price Information: The current price is promotional and is subject to change as upcoming updates and new features are released. Code2Profit Channel Master the Market with Multi-Timeframe Analysis! How to Maximize Your Win Rate with Trend Sniper X: Key Rules & Sess
Zoryk Gold mt4
Reda El Koutbane
5 (3)
discount ends soon original price 69 $ ZORYK — Advanced XAUUSD Signal System for MetaTrader 4 You know the feeling. You spend time analyzing gold. You wait for the entry. You finally open the trade, and price immediately moves against you. You close too early, move the Stop Loss, or hesitate for a few seconds. Then the market reaches the exact destination you originally expected without you. The direction was not always the problem. The real problem was uncertainty. You did not know exactl
PRO Renko System
Oleg Rodin
5 (31)
PRO Renko System is a highly accurate trading system specially designed for trading RENKO charts. The ARROWS and Trend Indicators DO NOT REPAINT! The system effectively neutralizes so called market noise giving you access to accurate reversal signals. The indicator is very easy to use and has only one parameter responsible for signal generation. You can easily adapt the tool to any trading instrument of your choice and the size of the renko bar. I am always ready to provide extra support to help
Currency Strength Wizard is a very powerful indicator that provides you with all-in-one solution for successful trading. The indicator calculates the power of this or that forex pair using the data of all currencies on multiple time frames. This data is represented in a form of easy to use currency index and currency power lines which you can use to see the power of this or that currency. All you need is attach the indicator to the chart you want to trade and the indicator will show you real str
Atomic Analyst
Issam Kassas
5 (14)
Atomic Analyst — MetaTrader 4 For product questions, setup guidance, or technical support, message me directly here on MQL5. The indicator turns complex market calculations into simple visual signals, color-coded candles, trend readings, stop-loss levels, and multiple take-profit zones that traders can understand quickly and use in real market conditions. Main Trading Uses: Scalping and intraday trading: Designed for fast decision-making, clear arrows, alerts, candle colors, and structured entry
Gann Made Easy
Oleg Rodin
4.84 (173)
Gann Made Easy is a professional and easy to use Forex trading system which is based on the best principles of trading using the theory of W.D. Gann. The indicator provides accurate BUY and SELL signals including Stop Loss and Take Profit levels. You can trade even on the go using PUSH notifications. PLEASE CONTACT ME AFTER PURCHASE TO GET TRADING  INSTRUCTIONS   AND GREAT EXTRA INDICATORS  FOR FREE! Probably you already heard about the Gann trading methods before. Usually the Gann theory is a
Smart Trend Trading System is a chart indicator for MetaTrader 4 that brings trend information, entry and exit signals, and price levels into one workspace. It combines 10+ trading tools into one system, including trend detection, reversal zones, smart cloud, trailing stop logic, support and resistance, candle coloring, alerts, and multi-timeframe analysis. The system is designed to help you trade different market conditions: Trending markets: Identify the main trend, detect pullbacks, follow mo
Top Bottom Tracker is an indicator based on sophisticated algorithms that analyse the market trend and can detect the highs and lows of the trend / MT5 version . The price will progressively increase until it reaches 500$. Next price --> $99 Features No repainting This indicator does not change its values when new data arrives Trading pairs All forex pairs Timeframe     All timeframes Parameters ==== Indicator configuration ==== Configuration parameter // 40 (The higher the value, the
Scalper Vault
Oleg Rodin
5 (40)
Scalper Vault is a powerful, fully-equipped trading system designed for traders who want to achieve consistency in intraday trading . This high-precision indicator serves as a complete, standalone trading system that delivers institutional-grade analysis for both Forex and Binary Options traders. PLEASE CONTACT ME AFTER PURCHASE TO GET MY TRADING TIPS PLUS A GREAT BONUS! By eliminating the guesswork and complex manual analysis, Scalper Vault allows you to focus purely on execution using easy t
Neuro Poseidon MT4
Daria Rezueva
4.74 (46)
Neuro Poseidon is a new indicator by Daria Rezueva. It combines precise trading signals with adaptive TP/SL levels - creating best possible trades as a result! Message me and get  Neuro Poseidon Assistant  as a gift to automize your trading process! What makes it stand out? 1. Proven profitability on all assets and timeframes 2. Only confirmed BUY and SELL signals present on the chart 3. Adaptive TP & SL levels generated by the software for each trade 4. Easy to understand - suitable for all
Tokyo mt4 Indicator
Vasiliy Strukov
5 (9)
Tokyo Indicator provides a clear visual overview of trend direction, potential trading signals, and market conditions. Its colour-coded, stepped trend line distinguishes bullish phases in blue from bearish phases in magenta. Matching directional arrows highlight potential buying and selling opportunities when the displayed trend changes. An integrated dashboard brings together the current signal, market bias, momentum, volatility, and signal quality in one convenient view. This allows traders t
Liquidity Scalper System: a liquidity-based trading system in indicator form. Most indicators only show an arrow, and the trader then has to decide where the stop goes, where the target is and whether the signal can be trusted at all. Liquidity Scalper System covers the full trade cycle: it finds liquidity pools, gives a signal when they are broken, immediately calculates Entry, Stop Loss and three targets, and shows statistics and out-of-sample test results on the panel. The system picks its o
Trading Special – 30% OFF Best Solution for any Newbie or Expert Trader! This dashboard software is working on 28 currency pairs plus one. It is based on 2 of our main indicators (Advanced Currency Strength 28 and Advanced Currency Impulse). It gives a great overview of the entire Forex market plus Gold or 1 indices. It shows Advanced Currency Strength values, currency speed of movement and signals for 28 Forex pairs in all (9) timeframes. Imagine how your trading will improve when you can watch
SR Liquidity
Oleg Rodin
5 (2)
SR Liquidity is a trading indicator designed to reveal the hidden zones where market liquidity concentrates and price reacts most strongly. These special liquidity areas act as powerful support and resistance levels, giving you a clear map of where the market is most likely to reverse. Instead of drawing ordinary Support/Resistance lines, SR Liquidity analyzes real price behavior to detect the zones where buying and selling pressure accumulate. These are actually the pools of liquidity that driv
AW Prime Oscillator
AW Trading Software Limited
5 (1)
A combination of two oscillators. The first one displays the entry points, the second shows the current trend . The indicator can display oscillator signals by arrows in two modes, all fast oscillator signals or signals only in the direction of the current trend. It has a multi-timeframe panel and three types of signal notifications. Benefits: Suitable for day and scalping trading Trend filtering Simple and sensitive setup Multi-timeframe panel Suitable for integration into an advisor. Works on
M1 Sniper
Oleg Rodin
4.97 (30)
M1 SNIPER  is an easy to use trading indicator system. It is an arrow indicator which is designed for M1 time frame. The indicator can be used as a standalone system for scalping on M1 time frame and it can be used as a part of your existing trading system. Though this trading system was designed specifically for short-term trading, it still can be helpful for all traders. This trading system can be used with any forex pair and time frame, though lower time frames are recommended from M1 up to M
CRT Candle Range Theory HTF MT4 - Ultimate CRT Indicator: Advanced ICT Concepts and Malaysian SnR Trading System Master the Market Maker's Footprints with the Most Advanced Candle Range Theory Indicator. Unlock the true power of Smart Money Concepts (SMC) and trade precisely like the institutions with the Ultimate CRT Indicator. Built exclusively for serious traders, this indicator automates the highly effective Candle Range Theory (CRT), a core pillar of ICT Concepts (Inner Circle Trader), and
Cycles Predictor Indicator This indicator uses past market cycles to predict future price movements. The indicator scans through past data and considers  combinations  of cycles. When cycles  coincide  at the same future date/time then it is considered a valid future prediction. The predictions are drawn as vertical lines on the right side of the chart in the future. A prediction will often result in type of candle (ex. bull or bear) and/or a reversal point (ex. bottom or top) forming at this ex
GoldRush Trend Arrow Signal V1.6 The GoldRush Trend Arrow Signal indicator V1.6 continues to provide precise, real-time trend analysis tailored for high-speed, short-term scalpers in XAU/USD , but it now has additional features and improved efficiency and reliability. Built specifically for the 1-minute time frame, this tool displays directional arrows for clear entry points, allowing scalpers to navigate volatile market conditions with confidence. The indicator consists of PRIMARY and SECONDARY
Break and Retest Hunter MT4 is a powerful MetaTrader 5 indicator designed to automatically identify support and resistance levels, breakout structures, and potential retest opportunities in real time. Bonus Indicator: After purchasing Break and Retest Hunter , contact me to receive Trade Indicator Assistant EA completely free as a bonus utility. $65 for the next 10 copies . Next price is $120.  Combining adaptive market analysis, clear BUY/SELL signals, Fibonacci-based profit targets, and a pre
ForexTrendMT4
Andriy Sydoruk
5 (1)
ForexTrendMT4 Indicator: A Reliable Tool for Market Tracking The ForexTrendMT4 indicator offers reliable market trend tracking, filtering out sudden fluctuations and market noise. This tool helps identify trends and signals favorable entry points into the market using arrows. It is suitable for both scalping on shorter timeframes and long-term trading strategies. Based on the principles of technical analysis, ForexTrendMT4 takes into account the cyclical nature of the market. Key Features and A
CRT Multi-Timeframe Market Structure & Liquidity Sweep Indicator Non-Repainting | Multi-Asset | MT5 Version Available MT5 Version:   https://www.mql5.com/en/market/product/162075 Full User Guide — explains what each feature does and why:   https://www.mql5.com/en/blogs/post/767525 Quick Start User Guide  — explains how to configure and in what order:  https://www.mql5.com/en/blogs/post/767540 Indicator Overview CRT Ghost Candle HTF Fractal is a complete institutional-grade market structure too
Super Signal – Skyblade Edition Professional No-Repaint / No-Lag Trend Signal System with Exceptional Win Rate | For MT4 / MT5 It works best on lower timeframes, such as 1-minute, 5-minute, and 15-minute charts. Core Features: Super Signal – Skyblade Edition is a smart signal system designed specifically for trend trading. It applies a multi-layered confirmation mechanism to detect only strong, directional moves supported by real momentum. This system does not attempt to predict tops or bottoms
Trading Special –40% OFF Best Solution for any Newbie or Expert Trader! This Indicator is a unique, high quality and affordable trading tool because we have incorporated a number of proprietary features and a new formula. With only ONE chart you can read Currency Strength for 28 Forex pairs! Imagine how your trading will improve because you are able to pinpoint the exact trigger point of a new trend or scalping opportunity? User manual: click here Looking for the MT5 version? Click here: https:/
Volume Orderflow Profile
Suvashish Halder
5 (2)
Introducing Volume Orderflow Profile , a versatile tool designed to help traders visualize and understand the dynamics of buying and selling pressure within a specified lookback period. Perfect for those looking to gain deeper insights into volume-based market behavior! MT5 Version -  https://www.mql5.com/en/market/product/122657 The indicator gathers data on high and low prices, along with buy and sell volumes, over a user-defined period. It calculates the maximum and minimum prices during this
Smart Price Action Concepts — MetaTrader 4 For product questions, setup guidance, or technical support, message me directly here on MQL5. Smart Money Concepts SMC  Inner Circle Trading ICT  Price Action PA and Institutional Trading IT Real time market structure and swing structure highs and lows ( HH HL LL LH ) Real time internal and swing supply and demand order blocks Premium Equilibrium and Discount Zones Automatic Fibonacci Detection with 2 Options (current swing or previous swing ) Equal hi
VWAP Ultimate Pro MT4 – Persistent Anchored VWAP | Session VWAP | Dynamic Bands & Smart Alerts Bring an Advanced Professional VWAP Workflow to the Classic MetaTrader 4 Platform WHY TRADERS CHOOSE VWAP ULTIMATE PRO MT4? VWAP (Volume-Weighted Average Price) is a widely used benchmark for evaluating fair value, session bias and price positioning. VWAP Ultimate Pro MT4 delivers a complete VWAP workflow optimised for the MT4 architecture, including persistent Anchored VWAP, multiple VWAP periods,
This indicator works on MT4 and is very easy to use. When you receive a signal from it, you wait for that candle with the signal to close and you enter your trade at the beginning of the next new candle . A red arrow means sell and a green arrow means buy. All arrows comes with Alert  like for easy identification of trade signal. Are you okay with that? 1 minute candle 1 minute expire
Trend Lines PRO
Roman Podpora
5 (2)
TREND LINES PRO    helps understand where the market is truly changing direction. The indicator shows real trend reversals and points where major players re-enter. You see   BOS lines   Trend changes and key levels on higher timeframes — without complex settings or unnecessary noise. Signals don't repaint and remain on the chart after the bar closes. VERSION MT 5     -     Reveals its maximum potential when paired with the   RFI LEVELS PRO  indicator What the indicator shows: Real shifts   tren
Advanced Supply Demand
Bernhard Schweigert
4.91 (302)
Trading Special – 30% OFF Best Solution for any Newbie or Expert Trader! This indicator is a unique, high quality and affordable trading tool because we have incorporated a number of proprietary features and a new formula. With this update, you will be able to show double timeframe zones. You will not only be able to show a higher TF but to show both, the chart TF, PLUS the higher TF: SHOWING NESTED ZONES. All Supply Demand traders will love it. :) Important Information Revealed Maximize the pot
More from author
Candle Timer Countdown shows how much time is left to close the current candle. It updates every second, even when no new tick arrives, using the broker server clock. Want the same countdown on your order ticket? OCO Panel PRO shows it in its footer, next to one-click orders and saved OCO exits. WHAT IT SHOWS Time left as mm:ss, h:mm:ss, or days on D1, W1 and MN. "Market closed" when the symbol is outside its trading session. Daily % change, symbol and timeframe (each one can be turned on or off
FREE
MACD Intraday Trend
JETINVEST
4.81 (57)
Free Fibonacci-tuned MACD for intraday trends. Want alerts and the full toolkit? MACD Intraday Trend PRO MACD Intraday Trend is an Indicator developed through an adaptation made of the original MACD created by Gerald Appel in the 1960s. Through years of trading it was observed that by changing the parameters of the MACD with Fibonacci proportions we achieve a better presentation of the continuity of the trend movements, making that it is possible to more efficiently detect the beginning and end
FREE
SniperBot EURUSD
JETINVEST
5 (1)
The EA uses volatility, spread, frequency, and timing to decide when to trade. The EA uses the Limit Orders method to open Positions. In this case, the Slippage will at most be positive on executing the entries. Open trades are managed with a trailing take profit and a fixed stop loss. Most trades are closed within a short time. Main features Does not use martingale Does not use grid Optimized currency pair: EURUSD Timeframe: M5 Note: the EA trades only in a short window each day, from a few mi
MACD Intraday Trend PRO shows when an intraday trend starts and when it runs out of strength, using a MACD re-tuned with Fibonacci proportions. Works on any symbol, any timeframe and on Renko charts. The free version is rated 4.8 by 56 traders. PRO is the full toolkit built on the same engine. What it does Fibonacci-proportioned MACD settings that keep trend moves readable instead of choppy Highlights trend start and trend exhaustion on the indicator window Same logic as the free MACD Intraday T
Candle Timer Countdown shows how much time is left to close the current candle. It updates every second, even when no new tick arrives, using the broker server clock. WHAT IT SHOWS Time left as mm:ss, h:mm:ss, or days on D1, W1 and MN. "Market closed" when the symbol is outside its trading session. Daily % change, symbol and timeframe (each one can be turned on or off), and your own text before the timer. POSITION Any corner, top or bottom center, or next to the current price. Drag it with the m
FREE
Up to 7 Fibonacci pivot levels per side. For graded supply/demand zones with retest count: Supply Demand RSJ PRO Pivot Point Fibo RSJ draws the daily pivot point and its support and resistance levels calculated with Fibonacci ratios. It plots up to 7 support levels and 7 resistance levels from the previous day's high, low and close. Traders use these levels as reference areas to plan entries, exits and stop placement during the day. Features Up to 7 levels of support and 7 levels of resistance F
FREE
Free Tabajara setup for B3. Trading WIN? See our Trend WIN B3 robot. Setup Tabajara was created by a Brazilian trader known as  "The OGRO of Wall Street" . The idea of this setup is to indicate to the trader the current trend of prices and  the type of operation should be looked for in the graph. Operation It does this through the positioning of the closing of the candles and the  vwap until 10:40am and after by the arithmetic mean of 20 periods painting the candles in 4 possible colors: Green
FREE
Supply Demand RSJ Zones draws supply and demand zones on any symbol and timeframe, with two strength levels. WHAT IT DOES Finds swing highs and lows with two fractal windows (fast and slow) and turns them into price zones sized by ATR. Strong zones are drawn in the full color: they start on a major swing or were already retested. Weak zones are drawn in a faded tone: minor swings or zones that were broken once and flipped sides. Zones broken twice are removed. Overlapping zones are merged. Suppl
FREE
Daily Volume Profile RSJ: free volume profile of the current day for any symbol, with POC, VAH and VAL. WHAT IT SHOWS - Volume profile of today, updated during the day. - POC (price with the most volume), VAH and VAL (value area, 70% by default) with labels. - Value area rows highlighted. - Small panel with today's POC, VAH, VAL and total volume. - Lines and texts adapt to light and dark chart backgrounds. DATA Built from 1-minute bars: real volume when the feed has it (stocks, futures), tick
FREE
Candle Counter RSJ prints the number of each candle counted from the first candle of the day. The first candle of the day is number 1 and each new candle adds 1 to the count. Input Parameters Show even, odd or all numbers Distance between the candle and the number Text font size Text font color How to use Counting candles helps when a setup depends on the number of bars since the market opened, for example a rule that only takes trades after the third candle of the day, or a review of what happe
FREE
Weis Waves RSJ
JETINVEST
4.64 (11)
Weis Waves RSJ adds up the volume of each price wave and plots it as a histogram of cumulative volume for the alternating up and down waves. This lets you compare the effort (volume) of each wave with its result (price progress) and see when a move is supported by volume or is losing strength. How to read it Each bar of the histogram is the total volume traded during one price wave. When a trend is healthy, the waves in the direction of the trend usually show more volume than the corrections. Wh
FREE
VWAP Fibo Bands RSJ
JETINVEST
4.83 (12)
VWAP Fibo Bands RSJ draws the VWAP of the selected period and builds bands around it using Fibonacci proportions. The indicator plots 10 band levels around the VWAP. The bands show how far price has moved from the volume weighted average price and can be used as reference levels to plan entries, exits and stops. The bands are easiest to read on timeframes of 30 minutes and below. Inputs Calculation Volume Type Calculation Price Type VWAP Period Time Each band is drawn at a fixed Fibonacci distan
FREE
Tabajara Ogro
JETINVEST
4.77 (13)
Free Tabajara setup for B3. Trading WIN? See our Trend WIN B3 robot. The Tabajara setup was created by a Brazilian trader known as "The OGRO of Wall Street". It shows the current trend and the type of trade to look for on the chart. How it works The indicator compares the closing price with the 20-period simple moving average and paints the candles in 4 colors: Green: price rising in an uptrend (look for buy entries) Black: price correcting in an uptrend (look for buy entries) Red: price falling
FREE
Delta Aggression Volume shows, candle by candle, whether aggressive buyers or aggressive sellers traded more on B3. WHAT IT DOES Computes the aggression delta of each candle: volume of aggressive buys minus volume of aggressive sells. Plots the balance of every candle in a separate window, colored by the side that won. REQUIREMENTS B3 only: mini index (WIN), mini dollar (WDO) and B3 stocks. The broker feed must report the aggressor side (buy or sell) of each trade. Forex, crypto and CFD feeds do
FREE
Aggression Wave RSJ adds up the difference between buy and sell aggression candle after candle and plots it as waves, so you can see which side is controlling the order flow on B3. WHAT IT DOES Computes the aggression delta of each candle (aggressive buys minus aggressive sells) and accumulates it into waves. Colors each wave by direction, so a change of control between buyers and sellers is visible at a glance. Draws a signal line over the waves to show the direction of the flow. REQUIREMENTS B
FREE
Up to 7 Fibonacci pivot levels per side. For graded supply/demand zones with retest count: Supply Demand RSJ PRO Pivot Point Fibo RSJ draws the daily pivot point and its support and resistance levels calculated with Fibonacci ratios. It plots up to 7 support levels and 7 resistance levels from the previous day's high, low and close. Traders use these levels as reference areas to plan entries, exits and stop placement during the day. Features Up to 7 levels of support and 7 levels of resistance F
FREE
Vwap RSJ
JETINVEST
4.82 (11)
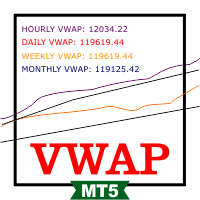
VWAP RSJ plots the hourly, daily, weekly and monthly VWAP lines on the same chart. Large institutional buyers and funds use the VWAP to enter and exit positions with the smallest possible market impact. They usually try to buy below the VWAP and sell above it, which tends to pull price back toward the average. This indicator combines the four VWAP periods so you can see where price stands against each of them. How to read it Each VWAP line starts again at the beginning of its period: the hourly
FREE
Volume By Color RSJ paints the volume bar in a darker color when the traded volume is above its own moving average, so candles with unusual activity stand out. An optional four-color mode shows the strength of each candle's volume in steps. By default the indicator compares each bar with the 20-period simple average of the volume. The average type and period can be changed in the inputs. How to use The colored bars make it easy to spot breakouts, rejections and climax candles that happen with vo
FREE
Volume By Color RSJ paints the volume bar in a darker color when the traded volume is above its own moving average, so candles with unusual activity stand out. An optional four-color mode shows the strength of each candle's volume in steps. By default the indicator compares each bar with the 20-period simple average of the volume. The average type and period can be changed in the inputs. How to use The colored bars make it easy to spot breakouts, rejections and climax candles that happen with vo
FREE
MACD Intraday Trend PRO is an Indicator developed through an adaptation made of the original MACD created by Gerald Appel in the 1960s. Through years of trading it was observed that by changing the parameters of the MACD with Fibonacci proportions we achieve a better presentation of the continuity of the trend movements, making that it is possible to more efficiently detect the beginning and end of a price trend. Due to its efficiency in detecting price trends, it is also possible to identify ve
Renko Price Action ATR builds a Renko chart in which the size of each brick is calculated from the ATR of the period you select. Renko charts filter out small price movements, so trends, supports and resistances, and top and bottom divergences are easier to see. Operation Works with any symbol. The Renko chart is updated in real time. Settings ATR Calculation Timeframe: timeframe used to calculate the ATR and the brick size. ATR Calculation Averaging Period: number of periods of the ATR average.
B3 ONLY (WIN, WDO, B3 stocks). Aggression Wave PRO accumulates buy vs. sell aggression into waves, so you can see who is in control of the order flow, when momentum continues and when it diverges from price. Requires a broker/market that reports the aggressor side of each trade. Forex and crypto do NOT provide this data, so it will not work there. The free Aggression Wave RSJ is rated 4.57 by 7 traders. PRO adds divergence reading, 7 configurable alerts, 8 viewing modes and 12 buffers for EA int
B3 ONLY (WIN, WDO, B3 stocks). Delta Aggression Volume PRO shows, candle by candle, whether aggressive buyers or aggressive sellers won, and tracks the strength and continuity of that pressure. Requires a broker/market that reports the aggressor side of each trade. Forex and crypto do NOT provide this data, so it will not work there. Use the free Delta Aggression Volume to see the basic per-candle delta. PRO adds 5 configurable alerts, a delta channel (linear regression or standard deviation), a
Supply Demand RSJ PRO draws supply and demand zones automatically, grades each one (Weak, Strong, Verified, Proven) and counts how many times price has retested it. Any symbol, any timeframe. What it does Supply zones: where selling overwhelmed buying and pushed price down Demand zones: where buying overwhelmed selling and pushed price up Zone grading in 4 levels: Weak, Strong, Verified, Proven Labels with zone type and retest count, so you see which levels the market keeps respecting Zone filte
Trend WDO B3
JETINVEST
5 (1)
Trend WDO B3 is a professional trading system created for the MT5 platform and optimized to work with MINI DOLAR INDEX (WDO) on B3 in BRAZIL. The system uses Fuzzy Logic in several timeframes (1M, 5M, 15M, 30M, H1, H4, D1) to identify the price trend, applying weights in each timeframe according to the calculations made. After identifying the trend, the system places a STOP order (BUY or SELL) based on the average volatility, and once the position is opened, the EA manages the trade with a trail
Trend WIN B3
JETINVEST
5 (4)
Trend WIN B3 is a professional trading system created for the MT5 platform and optimized to work with MINI FUTURE INDEX (WIN) on B3 in BRAZIL. The system uses Fuzzy Logic in several timeframes (1M, 5M, 15M, 30M, H1, H4, D1) to identify the price trend, applying weights in each timeframe according to the calculations made. After identifying the trend, the system places a STOP order (BUY or SELL) based on the average volatility, and once the position is opened, the EA manages the trade with a trai
Sniper Major
JETINVEST
5 (1)
The EA uses volatility, spread, frequency, and timing to decide when to trade. The EA uses the Limit Orders method to open Positions. In this case, the Slippage will at most be positive on executing the entries. Open trades are managed with a trailing take profit and a fixed stop loss. Most trades are closed within a short time. Main features Does not use martingale Does not use grid Optimized currency pairs: EURUSD | GBPUSD | USDJPY | USDCHF Timeframe: M5 Note: the EA trades only in a short wi
Session & Killzones PRO draws the Asia, London and New York sessions and the ICT killzones on your chart, with the range of each session, previous day high/low and ADR projections. Daylight saving is handled per market, so the boxes stay in the right place all year without changing any setting. WHAT IT DOES Session boxes: Asia (Tokyo 09:00-18:00), London (08:00-17:00) and New York (08:00-17:00), each in its own local time US and UK daylight saving applied separately: the 2 to 3 weeks a year when
FVG and Structure PRO marks market structure (BOS / CHoCH), fair value gaps, order blocks and equal highs/lows on your chart: the price action concepts used by ICT and Smart Money traders. Every element is confirmed on a closed candle, so nothing on the chart is redrawn after it appears. WHAT IT DOES Swing highs and lows with adjustable strength; BOS (continuation) and CHoCH (change of character) drawn on candle close Optional HH / HL / LH / LL labels on every swing Fair value gaps (three-candle
Want more? Upgrade to JET Trade Assistant PRO — partial exits with drag-and-drop lines, 4 break-even levels, 8 trailing stops, hidden stops, virtual orders, prop firm rules, day breakeven line and statistics. Trade Panel and Risk Manager PRO places and manages orders from the chart, with the lot size calculated from the risk you choose. Type the risk in percent and click BUY or SELL: stop loss, take profit and lot size are set in one step. Or drag the entry, stop and target lines and the panel c
Filter:
sunnychow
9773
sunnychow 2026.09.21 12:13 

Good tool

JETINVEST
400781
Reply from developer Roberto Sant Ana Junqueira 2026.09.21 12:17
Tks. Take a look into the professional version.
raulovalle
90
raulovalle 2023.12.13 19:53 

User didn't leave any comment to the rating

adonias
68
adonias 2023.08.23 23:09 

User didn't leave any comment to the rating

JETINVEST
400781
Reply from developer Roberto Sant Ana Junqueira 2023.08.23 23:21
Olá. A versão gratuita não tem configuração. De qualquer forma se puder enviar uma foto para eu entender do que você esta falando.
zika79rus
143
zika79rus 2023.06.13 13:01 

сомнительный продукт, дал сигнал на закрытие ордера в виде другого цвета, а потом изменил его, так как цена пошла не по его сигналу

JETINVEST
400781
Reply from developer Roberto Sant Ana Junqueira 2023.06.13 13:12
I believe that you are a beginner in the financial market, as we should never assume a signal from a single indicator without mitigating what the market is doing. I suggest studying the MACD concepts to be able to take better advantage of this indicator.
Belyanin58
35
Belyanin58 2023.04.11 20:51 

ничего не понимаю в этом , но кажется хороший индикатор.

zofesu
350
zofesu 2023.02.03 16:15 

Great job. It is clean and relatively accurate when combined with MA on a higher time frame.

JETINVEST
400781
Reply from developer Roberto Sant Ana Junqueira 2023.02.03 16:30
Tks. Take a look into the professional version.
731073
69
731073 2022.10.21 21:15 

Very helpful

JETINVEST
400781
Reply from developer Roberto Sant Ana Junqueira 2022.10.21 21:25
Tks. Take a look into the professional version.
missqueeniewu
70
missqueeniewu 2022.10.02 17:12 

very useful indicator. thanks a lot. :)

JETINVEST
400781
Reply from developer Roberto Sant Ana Junqueira 2022.10.02 17:15
Tks. Take a look into the professional version.
Mauro Giuseppe Tondo
2009
Mauro Giuseppe Tondo 2022.09.28 02:13 

good

JETINVEST
400781
Reply from developer Roberto Sant Ana Junqueira 2022.09.28 12:33
Tks. Take a look into the professional version.
그럴수있어
48
그럴수있어 2022.09.07 22:48 

User didn't leave any comment to the rating

JETINVEST
400781
Reply from developer Roberto Sant Ana Junqueira 2022.09.07 23:06
Tks. Take a look into the professional version.
Daniel Santoso
98
Daniel Santoso 2022.08.17 08:24 

Good

JETINVEST
400781
Reply from developer Roberto Sant Ana Junqueira 2022.08.17 11:39
Tks. Take a look into the professional version.
John Winsome Munar
3471
John Winsome Munar 2022.06.14 05:23 

Nice MACD indicator in conjuction with other indi for confirmation.

JETINVEST
400781
Reply from developer Roberto Sant Ana Junqueira 2022.06.14 11:25
Tks. Take a look into the professional version: https://www.mql5.com/en/market/product/67986?source=Site+Profile+Seller
Howell Monique
35
Howell Monique 2022.06.13 13:23 

User didn't leave any comment to the rating

JETINVEST
400781
Reply from developer Roberto Sant Ana Junqueira 2022.06.13 13:29
Tks. Take a look into the professional version: https://www.mql5.com/en/market/product/67986?source=Site+Profile+Seller
David Linker
93
David Linker 2022.01.17 15:32 

User didn't leave any comment to the rating

JETINVEST
400781
Reply from developer Roberto Sant Ana Junqueira 2022.01.17 15:33
Tks. Take a look into the professional version: https://www.mql5.com/en/market/product/67986?source=Site+Profile+Seller
lanyangyangmomo
61
lanyangyangmomo 2021.12.12 09:32 

User didn't leave any comment to the rating

JETINVEST
400781
Reply from developer Roberto Sant Ana Junqueira 2022.01.17 15:33
Tks. Take a look into the professional version: https://www.mql5.com/en/market/product/67986?source=Site+Profile+Seller
Satyam Shivam
31911
Satyam Shivam 2021.11.18 05:12 

Loved it!!

JETINVEST
400781
Reply from developer Roberto Sant Ana Junqueira 2022.01.17 15:33
Tks. Take a look into the professional version: https://www.mql5.com/en/market/product/67986?source=Site+Profile+Seller
Elusive Pimpernel
182
Elusive Pimpernel 2021.11.08 13:37 

Very nice, like it.

JETINVEST
400781
Reply from developer Roberto Sant Ana Junqueira 2022.01.17 15:33
Tks. Take a look into the professional version: https://www.mql5.com/en/market/product/67986?source=Site+Profile+Seller
Evgeny Belyaev
92814
Evgeny Belyaev 2021.08.11 22:13 

good

JETINVEST
400781
Reply from developer Roberto Sant Ana Junqueira 2021.08.11 22:14
Tks
andrei150
461
andrei150 2021.08.06 12:28 

Обыкновенная #рисовалка, не лучше, но и не хуже других индикаторов, как дополнение для подтверждения, входа-выхода, использовать можно.

JETINVEST
400781
Reply from developer Roberto Sant Ana Junqueira 2021.08.06 12:30
That's why it's called an indicator and not a signal generator.
HomayounT
348
HomayounT 2021.07.16 17:11 

User didn't leave any comment to the rating

JETINVEST
400781
Reply from developer Roberto Sant Ana Junqueira 2021.07.16 17:12
Tks. Take a look into the professional version: https://www.mql5.com/en/market/product/67986?source=Site+Profile+Seller
12
Reply to review