Tabajara VWAP Ogro RSJ
- Indicators
-
JETINVEST
 Roberto Junqueira, is Trader for over 20 years and has been developing indicators and trading experts for more than 10 years for the Forex, Cryptocurrencies and Stock Exchanges markets.
 - Version: 1.20
- Updated: 19 March 2021
Setup Tabajara was created by a Brazilian trader known as "The OGRO of Wall Street" .
The idea of this setup is to indicate to the trader the current trend of prices and the type of operation should be looked for in the graph.
Operation
- It does this through the positioning of the closing of the candles and the vwap until 10:40am and after by the arithmetic mean of 20 periods painting the candles in 4 possible colors:
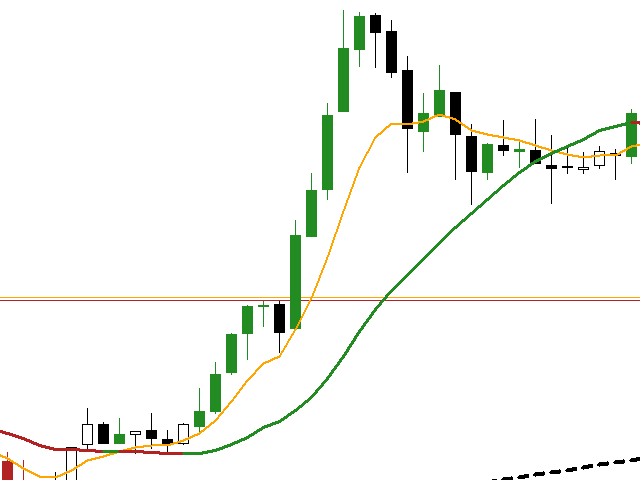
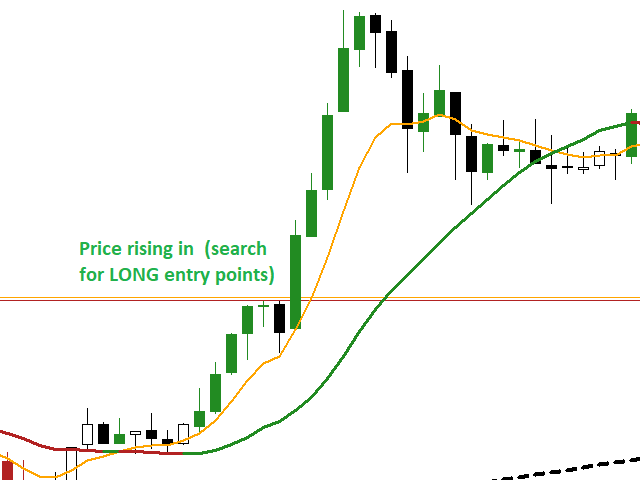
- Green -> Price rising in upward trend (Search entry points for PURCHASE)
- Black -> Price correcting in Bullish Trend (Search entry points for purchase)
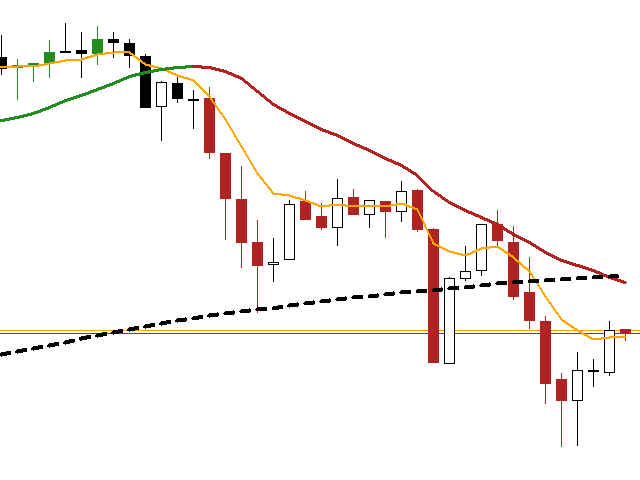
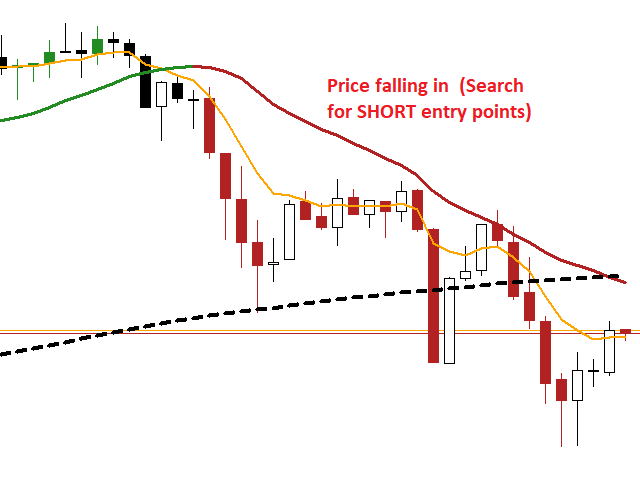
- Red -> Price falling in Downtrend (Search entry points for Sale)
- White -> Price correcting in Downtrend (Search entry points of Sale)
- In addition, I also put the following indicators in the script:
- Exponential Average of 8 periods: To identify short-term price movements
- Arithmetic Average of 50 periods: To identify medium-term price movements
- Exponential Average of 80 periods: To identify medium-term price movements
- Arithmetic Average of 200 periods: To identify long-term price movements
If you still have questions, please contact me by direct message: https://www.mql5.com/en/users/robsjunqueira/


Work for me, thank you