Pivot Point Fibo RSJ
- Indicateurs
-
JETINVEST
 Roberto Junqueira, is Trader for over 20 years and has been developing indicators and trading experts for more than 10 years for the Forex, Cryptocurrencies and Stock Exchanges markets.
 - Version: 1.0
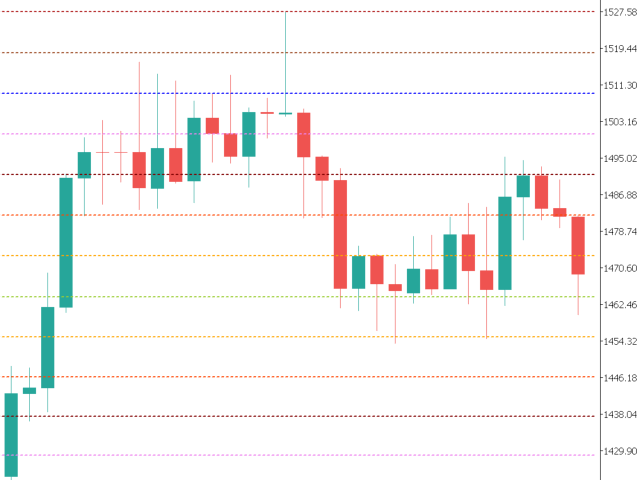
Pivot Point Fibo RSJ est un indicateur qui trace les lignes de support et de résistance de la journée en utilisant les taux de Fibonacci.
Cet indicateur spectaculaire crée jusqu'à 7 niveaux de support et de résistance via Pivot Point en utilisant les taux de Fibonacci.
C'est fantastique de voir comment les prix respectent chaque niveau de ce support et de cette résistance, où il est possible de percevoir les points d'entrée/sortie possibles d'une opération.
Caractéristiques
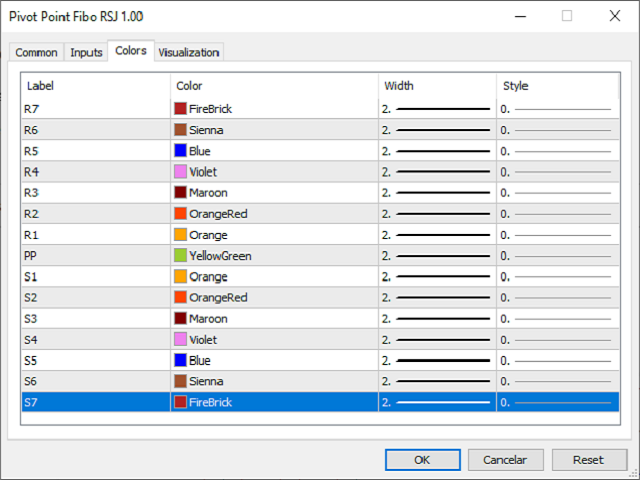
- Jusqu'à 7 niveaux de support et 7 niveaux de résistance
- Définir les couleurs des niveaux individuellement
Contributions
- Type de pivot
- Pivot Fibo RSJ1 = Calcul du rapport Fibo 1
- Pivot Fibo RSJ2 = Calcul du rapport Fibo 2
- Pivot Fibo RSJ3 = Calcul du rapport Fibo 3
- Pivot Fibo Classic = Calcul de pivot classique
- Niveaux de pivot minimum
- Pivoter 3 niveaux
- Pivoter 4 niveaux
- Pivoter 5 niveaux
- Pivoter 6 niveaux
- Pivoter 7 niveaux
Si vous avez encore des questions, veuillez me contacter par message direct: https://www.mql5.com/fr/users/robsjunqueira/


a good guide for me...i use it also as a measure of volatility