Vwap RSJ
- Indicators
-
JETINVEST
 Jet Invest develops indicators and trading tools for MetaTrader 4 and 5: order flow, volume, market structure and market overview panels for B3 (WIN, WDO and Brazilian stocks), US indices and forex.
- Version: 1.20
- Updated: 19 February 2021
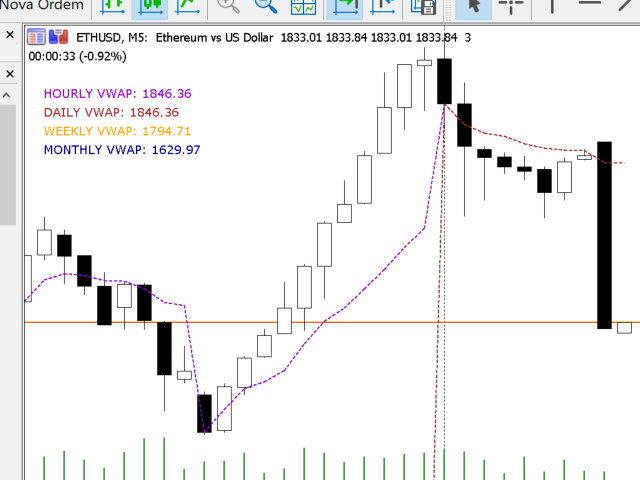
VWAP RSJ plots the hourly, daily, weekly and monthly VWAP lines on the same chart.
Large institutional buyers and funds use the VWAP to enter and exit positions with the smallest possible market impact. They usually try to buy below the VWAP and sell above it, which tends to pull price back toward the average.
This indicator combines the four VWAP periods so you can see where price stands against each of them.
How to read it
Each VWAP line starts again at the beginning of its period: the hourly line every hour, the daily line every day, the weekly line every week and the monthly line every month.
When price is above a VWAP, buyers have paid more than the average price of that period; when it is below, sellers are in control of that period.
Areas where two or more VWAP lines are close together often act as support or resistance, because traders from different periods watch the same price.
Works on any symbol that provides tick or real volume.
If you find this indicator useful, please leave a review. It helps other traders find it.









































bom indicador, obrigado.