Tabajara VWAP Ogro RSJ

4.82
Setup Tabajara, "The OGRO of Wall Street" olarak bilinen Brezilyalı bir tüccar tarafından oluşturuldu.

Bu kurulumun fikri, tüccara fiyatların mevcut eğilimini ve grafikte aranması gereken işlem türünü belirtmektir.

Operasyon

  • Bunu, mumları ve VWAP'yi saat 10:40'a kadar ve sonrasında 20 periyodun aritmetik ortalaması ile mumları 4 olası renkte boyayarak konumlandırarak yapar:
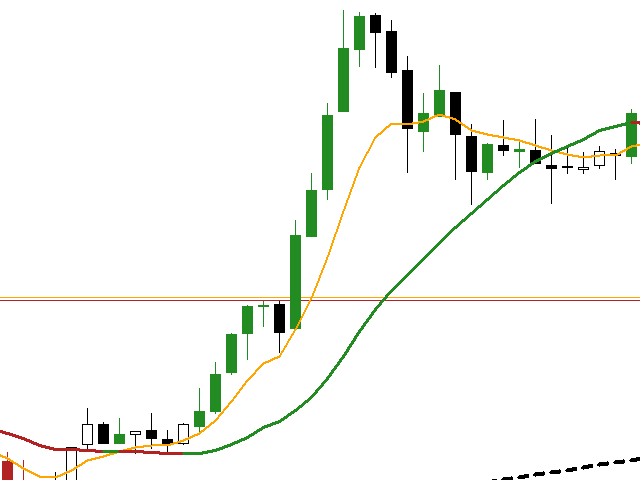
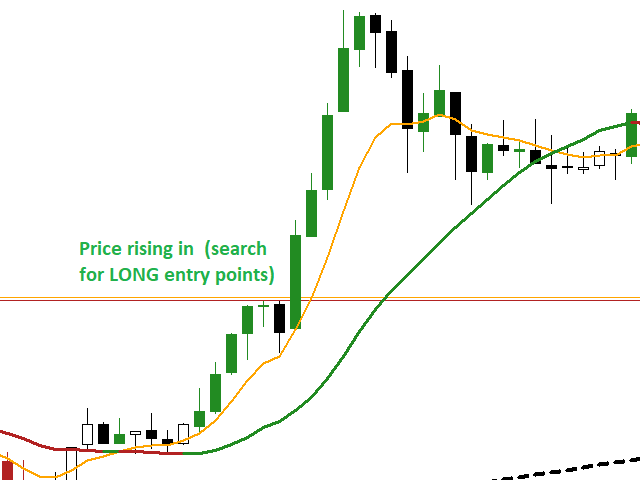
    • Yeşil -> Yükselen trendde yükselen fiyat (SATIN ALMA için giriş noktalarını arayın)
    • Siyah -> Boğa Trendinde fiyat düzeltme (Satın almak için giriş noktalarını arayın)
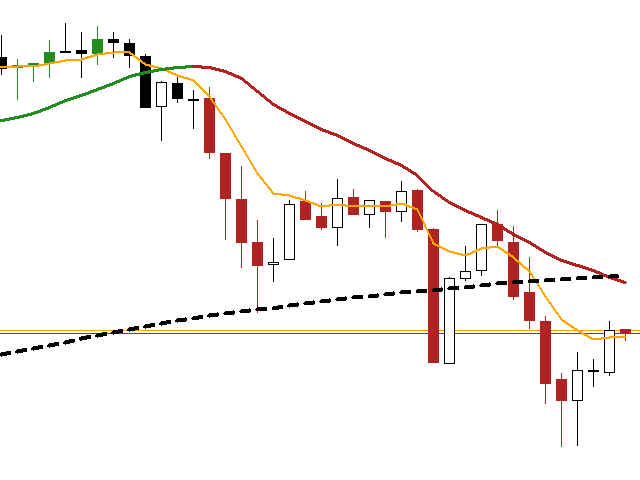
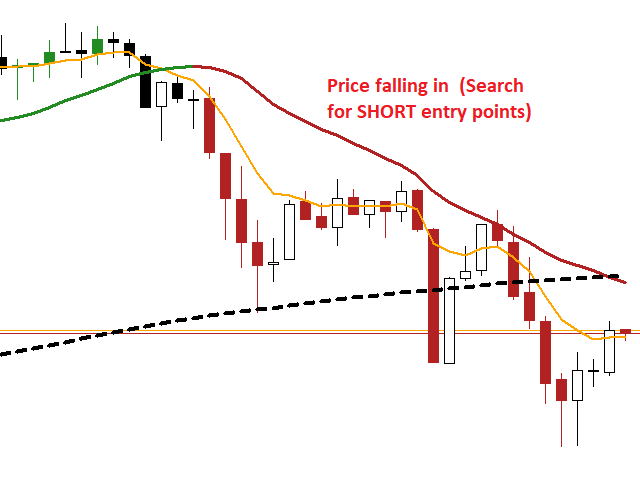
    • Kırmızı -> Düşüş trendinde düşen fiyat (Satılık giriş noktalarını arayın)
    • Beyaz -> Düşüş trendinde fiyat düzeltme (Satış giriş noktalarını arayın)
  • Ayrıca, komut dosyasına aşağıdaki göstergeleri de koydum:
    • 8 dönemin Üstel Ortalaması: Kısa vadeli fiyat hareketlerini belirlemek için
    • 50 dönemin Aritmetik Ortalaması: Orta vadeli fiyat hareketlerini belirlemek için
    • 80 dönemin Üstel Ortalaması: Orta vadeli fiyat hareketlerini belirlemek
    • 200 dönemin Aritmetik Ortalaması: Uzun vadeli fiyat hareketlerini belirlemek için

Hâlâ sorularınız varsa lütfen doğrudan mesajla bana ulaşın: https://www.mql5.com/tr/users/robsjunqueira/


İncelemeler 53
Kittisak Polsuk
92
Kittisak Polsuk 2025.11.21 04:32 
 

Work for me, thank you

baik6211
86
baik6211 2025.08.24 08:07 
 

very good fo me thank you

Benjamin Afedzie
3602
Benjamin Afedzie 2025.06.11 15:44 
 

works for me

Önerilen ürünler
Pivot Point Fibo RSJ, Fibonacci oranlarını kullanarak günün destek ve direnç çizgilerini izleyen bir göstergedir. Bu muhteşem gösterge, Fibonacci oranlarını kullanarak Pivot Point üzerinden 7 seviyeye kadar destek ve direnç oluşturur. Fiyatların, bir operasyonun olası giriş/çıkış noktalarını algılamanın mümkün olduğu bu destek ve direncin her bir düzeyine uyması harika. Özellikleri 7 seviyeye kadar destek ve 7 seviye direnç Seviyelerin renklerini ayrı ayrı ayarlayın Girişler Pivot Tipi Pivo
FREE
Bollinger colorido
Sergio Domingues
5 (1)
Funciona como bandas de bollinger normais. Criado por Joe Ross, é um setup de maior risco por ser contra-tendência. Pode ser usado para Day Trade, Swing Trade e Position. Para identificar, é necessário inserir no gráfico as Bandas de Bollinger, com uma Média Móvel Simples de 20 períodos e largura (desvio) 2. Verifica-se um fechamento de determinado candle abaixo da banda inferior de Bollinger. Se o próximo candle fechar dentro das Bandas, marca-se a máxima dele. O rompimento dessa máxima será o
FREE
VolumeBasedColorsBars
Henrique Magalhaes Lopes
VolumeBasedColorsBars — Free Powerful Volume Analysis for All Traders Unlock the hidden story behind every price bar! VolumeBasedColorsBars is a professional-grade, 100% FREE indicator that colorizes your chart candles based on real, adaptive volume analysis. Instantly spot surges in market activity, identify exhaustion, and catch the moves that matter. This indicator gives you:    • Dynamic color-coded bars for instant volume context    • Adaptive thresholds based on historical, session-awar
FREE
Rejection Zones
Paulo Henrique Faquineli Garcia
Este poderoso indicador analisa o gráfico e mostra zonas de Rejeição de Preços! Isto é, locais onde o preço foi, mas não foi aceito pelo mercado! A visualização desta zona de Rejeição, facilita o entendimento do trader na tomada de decisões de onde operar e como operar! O indicador é composto por 4 linhas, sendo classificadas em 2 grupos: Linhas Vermelha e Amarela: Denotam os extremos onde o preço conseguiu chegar, mas não foi aceito! Linhas Laranja e Azul: A partir delas, denotam o Início da z
FREE
Price Momentum
Flavio Javier Jarabeck
4.92 (12)
Value Chart indicator presents the Price evolution in a new form. This indicator, Price Momentum , was developed taking all the calculations presented in the book " Dynamic Trading Indicators " by Mark W. Helweg and David Stendahl (2002). The technique involves de-trended Prices from a user-defined Period of analysis and the addition of a Volatility index correction. The result is an Oscillator with 3 zones: Fair Price Value, Overbought/Oversold and Extremely Overbought/Oversold zones. Adding th
FREE
LT Donchian Channel
Thiago Duarte
4.83 (6)
Donchian Channel is an indicator created by Richard Donchian. It is formed by taking the highest high and the lowest low of the last specified period in candles. The area between high and low is the channel for the chosen period. Its configuration is simple. It is possible to have the average between the upper and lower lines, plus you have alerts when price hits one side. If you have any questions or find any bugs, please contact me. Enjoy!
FREE
High Low Open Close
Alexandre Borela
4.98 (42)
Bu projeyi seviyorsanız, 5 yıldız incelemesi bırakın. Bu gösterge açık, yüksek, düşük ve belirtilen fiyatlar için çizer Dönem ve belirli bir zaman bölgesi için ayarlanabilir. Bunlar birçok kurumsal ve profesyonel tarafından görünen önemli seviyelerdir. tüccarlar ve daha fazla olabileceği yerleri bilmeniz için yararlı olabilir Aktif. Mevcut dönemler şunlardır: Önceki gün. Önceki Hafta. Önceki Ay. Previous Quarter. Önceki yıl. Veya: Mevcut gün. Hafta. Şimdi Ay. Şimdiki Mahallesi. Bugün yıl.
FREE
TendencyLine
Samuel De Souza Ferreira
TendencyLine Indicator - Market Trend Analysis (An exclusive indicator by PPF - Past Project Future) General Description TendencyLine is a technical indicator developed by PPF - Past Project Future to help traders identify the prevailing market trend. It overlays a trend line based on a user-selected moving average on the price chart and displays a colored histogram that signals the trend direction. Main Features Trend Identification: The indicator differentiates between bullish and bear
FREE
AOT Ultra Neural: Because "Hope" Isn't a Trading Strategy. Still waiting for a lagging RSI to tell you what happened ten minutes ago? Cute. While you were busy drawing trendlines with a ruler, the AOT Ultra Neural was already calculating the market's pulse and identifying institutional liquidity gaps. This isn't just an indicator; it’s a high-velocity alpha engine engineered to dominate everything from the extreme volatility of XAUUSD and BTCUSD to the precision required for NASDAQ and major for
FREE
Tabajara V5
Flavio Javier Jarabeck
4.83 (35)
Metatrader 5 version of the famous Andre Machado's Tabajara indicator. If you don't know Andre Machado's Technical Analysis work you don't need this indicator... For those who need it and for those several friend traders who asked this porting from other platforms, here it is... FEATURES 8-period Moving Average 20-period Moving Average 50-period Moving Average 200-period Moving Average Colored candles according to the inflexion of the 20-period MA SETTINGS You can change the Period of all MA's
FREE
MTF Lines PRO
Renato Fiche Junior
5 (1)
This indicator was developed to support multiple timeframe analysis. In the indicator settings, the user can set the color, width, and style of the horizontal lines for each timeframe. This way, when the horizontal lines are inserted into the chart, they will be plotted with the timeframe settings. MTF Lines also allows visibility control of another objets like rectangles, trend lines and texts. This is a product developed by Renato Fiche Junior and available to all MetaTrader 4 and 5 users!
FREE
Pivot Points Indicator – a fast, reliable, and fully customizable pivot detection for MetaTrader 5. This indicator uses MetaTrader’s native iHighest and iLowest functions to identify pivot highs and lows by scanning for the highest and lowest prices within a user-defined window of bars. A pivot is confirmed only when the current bar is the absolute maximum or minimum within the selected range, ensuring accurate and timely signals based on robust built-in logic. Key Features No Repainting : Onc
FREE
Wave Box Market Frenquency
Jean Jacques Huve Ribeiro
4.75 (4)
Totally linked to the result of a movement and the duration he had. Its height records how many ticks the asset walked during a given movement, its width shows us the duration that movement had. Its configuration must be in line with the Weis Wave Indicator configuration to observe the movement force and can indicate a possible accumulation or distribution of the movement;
FREE
MACD Mago Trader
Flavio Javier Jarabeck
4.5 (4)
For those traders and students who follow the famous brazilian trader Igor Rodrigues (Mago Trader) here it is another tool he uses: a 2-line MACD specially set with Phi ratios. This MACD is packed with a twist: a Filling Area , to easily and visually spot the corresponding trend on the chart. Obviously, you can turn On and Off this filling feature. If you don't know Igor Rodrigues and you are a brazilian trader and student, just google for him... Very simple and useful indicator. If you are loo
FREE
Friend of the Trend: Your Trend Tracker Master the market with Friend of the Trend , the indicator that simplifies trend analysis and helps you identify the best moments to buy, sell, or wait. With an intuitive and visually striking design, Friend of the Trend analyzes price movements and delivers signals through a colorful histogram: Green Bars : Signal an uptrend, indicating buying opportunities. Red Bars : Alert to a downtrend, suggesting potential selling points. Orange Bars : Represent cons
FREE
MACD Gün İçi Trend, 1960'larda Gerald Appel tarafından oluşturulan orijinal MACD'nin uyarlanmasıyla geliştirilen bir Göstergedir. Yıllarca süren ticaret boyunca, MACD'nin parametrelerini Fibonacci oranlarıyla değiştirerek, trend hareketlerinin sürekliliğini daha iyi bir şekilde sunduğumuz ve bir fiyat trendinin başlangıcını ve sonunu daha verimli bir şekilde tespit etmeyi mümkün kıldığımız gözlemlendi. Fiyat trendlerini tespit etmedeki verimliliği sayesinde, aynı zamanda tepe ve dip farklarını
FREE
MIDAS Super VWAP
Flavio Javier Jarabeck
4.4 (10)
Imagine VWAP, MVWAP and MIDAS in one place... Well, you found it! Now you can track the movement of Big Players in various ways, as they in general pursue the benchmarks related to this measuring, gauging if they had good execution or poor execution on their orders. Traders and analysts use the VWAP to eliminate the noise that occurs throughout the day, so they can measure what prices buyers and sellers are really trading. VWAP gives traders insight into how a stock trades for that day and deter
FREE
VFI Quantum
Nikita Berdnikov
5 (1)
Introducing VFI (Volume Flow Indicator) – a trading indicator that analyzes the relationship between volume and price movement to identify key trading opportunities. The indicator displays the strength and direction of volume flow, providing clear signals about potential entry and exit points. Signals are formed based on zero line crossovers, crossovers between the VFI line and its exponential moving average (EMA), and when the indicator exits overbought and oversold zones. Attention! This stra
FREE
Genel Açıklama Bu gösterge, klasik Donchian Kanalı ’nın geliştirilmiş bir versiyonudur ve gerçek işlem için pratik işlevlerle zenginleştirilmiştir. Standart üç çizgiye (üst, alt ve orta çizgi) ek olarak sistem breakout (fiyat kırılımı) noktalarını tespit eder ve bunları grafikte oklarla görsel olarak gösterir. Ayrıca grafiği sadeleştirmek için mevcut trend yönünün tersindeki çizgi yalnızca görüntülenir. Gösterge şunları içerir: Görsel sinyaller : Kırılım sırasında renkli oklar Otomatik bildiriml
FREE
Coral Indi
Dinh Duong Luong
Coral trend is   a trend-following indicator that is widely popular among FOREX traders . It is usually used as a confluence with other indicators. It uses combinations of moving averages with complex smoothing formulas! It has two configurable parameters: Coefficient   - smoothing ratio (*) Applied price Calculation: Coral = (-0.064) * B6 + 0.672 * B5 - 2.352 * B4 + 2.744 * B3
FREE
Indicador Regressão Linear – Par de Ativos Indicador é um oscilador que faz o plot do Resíduo resultado da regressão linear entre os dois ativos inseridos como input do indicador, representado pela fórmula: Y = aX + b + R Onde Y é o valor do ativo dependente, X é o valor do ativo independente, a é a inclinação da reta entre os dois ativos, b é a intersecção da reta e R é o resíduo. O resíduo representa a quantidade da variabilidade que Y que o modelo ajustado não consegue explicar. E os resíduos
FREE
NOTE: Turn Pattern Scan ON This indicator identifies Swing Points, Break of Structure (BoS), Change of Character (CHoCH), Contraction and Expansion patterns which are plotted on the charts It also comes with Alerts & Mobile notifications so that you do not miss any trades. It can be used on all trading instruments and on all timeframes. The non-repaint feature makes it particularly useful in backtesting and developing profitable trading models. The depth can be adjusted to filter swing points.
FREE
MACD Colored ZeroLag
Farzin Sadeghi Bonjar
4.73 (11)
It is the MQL5 version of zero lag MACD that was available for MT4 here: https://www.mql5.com/en/code/9993 Also there was a colored version of it here but it had some problems: https://www.mql5.com/en/code/8703 I fixed the MT4 version which has 95 lines of code. It took me 5 days to write the MT5 version.(reading the logs and testing multiple times and finding out the difference of MT5 and MT4!) My first MQL5 version of this indicator had 400 lines of code but I optimized my own code again and n
FREE
SqueezeMAX Pro
Danton Dos Santos Sardinha Junior
SqueezeMAX Pro – Mikko Breakout Indicator MetaTrader 5 için geliştirilmiş, repaint yapmayan, yüksek performanslı ve güvenilir profesyonel breakout göstergesi. SqueezeMAX Pro – Mikko Breakout Indicator SqueezeMAX Pro , MetaTrader 5 için geliştirilmiş ileri seviye bir breakout (kırılım) tespit göstergesidir. Gerçek piyasa koşullarında işlem yapan trader’lar için doğruluk, netlik ve operasyonel stabilite sunmak üzere tasarlanmıştır. Fiyatın belirli bir periyottaki en yüksek ve en düşük seviyelerin
MACD Enhanced
Nikita Berdnikov
5 (3)
Introducing the MACD  Enhanced – an advanced MACD (Moving Average Convergence Divergence) indicator that provides traders with extended capabilities for trend and momentum analysis in financial markets. The indicator uses the difference between the fast and slow exponential moving averages to determine momentum, direction, and strength of the trend, creating clear visual signals for potential entry and exit points. Attention! To achieve the best results, it is recommended to adapt the indicator
FREE
Stackable VWAP
Flavio Javier Jarabeck
3.5 (4)
Volume Weighted Average Price (VWAP) is a trading benchmark commonly used by Big Players that gives the average price a Symbol has traded throughout the day. It is based on both Volume and price. Additionally we put in this indicator the MVWAP (Moving Volume Weighted Average Price). For those who do not know the usage and the importance od this indicator I recommend a great article about this subject at Investopedia ( https://www.investopedia.com/articles/trading/11/trading-with-vwap-mvwap.asp
FREE
Donchian Pro
Paulo Henrique Faquineli Garcia
5 (3)
The Donchian Channel Channels are among the most popular tools of technical analysis, as they visually convey to the analyst the limits within which most price movement tends to occur. Channel users know that valuable information can be obtained at any time, whether prices are in the central region of a band or close to one of the border lines. One of the best known techniques to explore these concepts is Bollinger Bands. However, John Bollinger was not the only one to research the application
FREE
Follow The Line MT5
Oliver Gideon Amofa Appiah
4.6 (35)
This indicator obeys the popular maxim that: "THE TREND IS YOUR FRIEND" It paints a GREEN line for BUY and also paints a RED line for SELL. (you can change the colors). It gives alarms and alerts of all kinds. IT DOES NOT REPAINT and can be used for all currency pairs and timeframes. Yes, as easy and simple as that. Even a newbie can use it to make great and reliable trades. NB: For best results, get my other premium indicators for more powerful and reliable signals. Get them here: https://www.m
FREE
The   OHLC indicator   shows the current and historical values of High, Low, Open, Close and Mid for a specific time period. It can plot the current values or the values from the previous session. The indicator's range can be calculated from a daily, weekly, monthly, or user-specified session. Levels High  of the current or previous session. Low  of the current or previous session. Open  of current or previous session. Close  of the current or previous session. Midpoint  of the current or prev
FREE
MA Color Candles Indicator MA Color Candles is an indicator for visually displaying market trends by coloring chart candles. It does not add objects or distort price data, instead coloring real candles based on the state of two moving averages. This enables quick trend assessment and use as a filter in trading strategies. How It Works Bullish trend: Fast MA above slow MA, slow MA rising (green candles). Bearish trend: Fast MA below slow MA, slow MA falling (red candles). Neutral state: Candles
FREE
Bu ürünün alıcıları ayrıca şunları da satın alıyor
Bu indikatörü satın alırsanız, Profesyonel Trade Manager’ımı  + EA ÜCRETSİZ olarak alacaksınız. Öncelikle, bu Ticaret Sistemi'nin Non-Repainting, Non-Redrawing ve Non-Lagging Göstergesi olduğunu vurgulamak önemlidir, bu da hem manuel hem de robot ticareti için ideal hale getirir. Online kurs, kılavuz ve ön ayarları indir. "Smart Trend Trading System MT5", yeni ve deneyimli tüccarlar için özelleştirilmiş kapsamlı bir ticaret çözümüdür. 10'dan fazla premium göstergeyi birleştiriyor ve 7'den fazla
ARIPoint
Temirlan Kdyrkhan
1 (1)
ARIPoint is a powerful trading companion designed to generate high-probability entry signals with dynamic TP/SL/DP levels based on volatility. Built-in performance tracking shows win/loss stats, PP1/PP2 hits, and success rates all updated live. Key Features: Buy/Sell signals with adaptive volatility bands Real-time TP/SL/DP levels based on ATR Built-in MA Filter with optional ATR/StdDev volatility Performance stats panel (Success, Profit/Loss, PP1/PP2) Alerts via popup, sound, push, or email Cu
Divergence Bomber
Ihor Otkydach
4.89 (82)
Bu göstergeyi satın alan herkese aşağıdaki ekstra içerikler ücretsiz olarak sunulmaktadır: Her işlemi otomatik olarak yöneten, Stop Loss ve Take Profit seviyelerini ayarlayan ve işlemleri strateji kurallarına göre kapatan özel yardımcı araç: "Bomber Utility" Göstergenin farklı varlıklar üzerinde kullanılmasına yönelik ayar dosyaları (set dosyaları) Bomber Utility için 3 farklı modda kullanım sunan ayar dosyaları: "Minimum Risk", "Dengeli Risk" ve "Bekle-Gör Stratejisi" Bu ticaret stratejisini hı
Power Candles – Tüm Piyasalar İçin Güce Dayalı Giriş Sinyalleri Power Candles , Stein Investments’ın kanıtlanmış güç analizini doğrudan fiyat grafiğinize taşır. Sadece fiyata tepki vermek yerine, her mum gerçek piyasa gücüne göre renklendirilir. Bu sayede momentum birikimleri, güç hızlanmaları ve net trend geçişleri anında görülebilir. Tüm Piyasalar İçin Tek Mantık Power Candles tüm işlem sembollerinde otomatik olarak çalışır. Gösterge, mevcut sembolün Forex mi yoksa Forex dışı bir piyasa mı old
SuperScalp Pro
Van Minh Nguyen
5 (2)
SuperScalp Pro – Gelişmiş Çoklu Filtreli Scalping Gösterge Sistemi SuperScalp Pro, klasik Supertrend ile çok sayıda akıllı onay filtresini birleştiren gelişmiş bir scalping gösterge sistemidir. Gösterge M1’den H4’e kadar tüm zaman dilimlerinde verimli çalışır ve özellikle XAUUSD, BTCUSD ve ana Forex pariteleri için uygundur. Bağımsız bir sistem olarak kullanılabilir veya mevcut ticaret stratejilerine esnek şekilde entegre edilebilir. Gösterge, hız ve yavaş EMA’lar, trend belirleyen üç EMA, EMA e
Azimuth Pro
Ottaviano De Cicco
5 (1)
LAUNCH PROMO Azimuth Pro price is initially set at 299$ for the first 100 buyers. Final price will be 499$ . THE DIFFERENCE BETWEEN RETAIL AND INSTITUTIONAL ENTRIES ISN'T THE INDICATOR — IT'S THE LOCATION. Most traders enter at arbitrary price levels, chasing momentum or reacting to lagging signals. Institutions wait for price to reach structured levels where supply and demand actually shift. Azimuth Pro maps these levels automatically: swing-anchored VWAP, multi-timeframe structure lines, an
Game Changer, metatrader'ınızı güçlü bir trend analiz aracına dönüştürmek için herhangi bir finansal enstrümanda kullanılmak üzere tasarlanmış devrim niteliğinde bir trend göstergesidir. Gösterge, yeniden çizim yapmaz ve gecikmez. Herhangi bir zaman diliminde çalışır ve trend tanımlamasına yardımcı olur, olası geri dönüşleri işaret eder, takip eden bir durdurma mekanizması görevi görür ve anında piyasa tepkileri için gerçek zamanlı uyarılar sağlar. İster deneyimli, ister profesyonel, ister avant
Entry In The Zone and SMC Multi Timeframe is a real-time market analysis tool developed based on Smart Money Concepts (SMC). It is designed to help traders analyze market structure systematically and gain a clearer view of overall market direction. The system analyzes Reversal Points, Key Zones, and Market Structure across multiple timeframes, while displaying Point Of Interest (POI), No Repaint Signals, and Auto Fibonacci Levels to help detect pullbacks and reversal points with precision. Real-
ÜCRETSİZ AUX Göstergesi ve EA Desteğini Alın  Doğrudan indirme — Buraya tıklayın [ D.I.C.E ] The DICE Indicator  Divergence in Chaos Environment, Elliott Dalga Teorisi’ni Trading Chaos teknikleriyle birleştiren trader’lar için geliştirilmiş özel bir MT5 aracıdır. Bill Williams’ın tanımladığı kaotik piyasa ortamıyla senkronize olarak fiyat hareketlerindeki gizli ve normal uyumsuzlukları tespit eder. Ana Özellikler Elliott Dalgası Uyumlu Uyumsuzluk: Dalga yapılarıyla uyumlu boğa ve ayı uyumsuzluk
Super Signal – Skyblade Edition Profesyonel No-Repaint / Gecikmesiz Trend Sinyal Sistemi, Olağanüstü Kazanma Oranı ile | MT4 / MT5 için 1 dakika, 5 dakika ve 15 dakika gibi daha düşük zaman dilimlerinde en iyi şekilde çalışır. Temel Özellikler: Super Signal – Skyblade Edition, özellikle trend bazlı işlemler için geliştirilmiş akıllı bir sinyal sistemidir. Yalnızca güçlü, yönlü ve gerçek momentum destekli piyasa hareketlerini tespit etmek amacıyla çok katmanlı bir filtreleme yapısı kullanır.
Atomic Analyst MT5
Issam Kassas
4.07 (28)
Öncelikle belirtmek gerekir ki bu Ticaret Göstergesi Yeniden Çizim Yapmaz, Gecikmez ve Gecikme Göstermez, bu da hem manuel hem de robot ticareti için ideal hale getirir. Kullanıcı kılavuzu: ayarlar, girişler ve strateji. Atom Analisti, Piyasada Daha İyi Bir Avantaj Bulmak İçin Fiyatın Gücünü ve Momentumunu Kullanan PA Fiyat Hareketi Göstergesidir. Gürültüleri ve Yanlış Sinyalleri Kaldırmaya ve Ticaret Potansiyelini Artırmaya Yardımcı Olan Gelişmiş Filtrelerle Donatılmıştır. Birden fazla katmanl
Trend Screener Pro MT5
STE S.S.COMPANY
4.84 (100)
Trend Göstergesi, Trend Alım Satım ve Filtreleme için Çığır Açan Benzersiz Çözüm, Tüm Önemli Trend Özellikleriyle Tek Bir Araç İçinde Yerleştirildi! Forex, emtialar, kripto para birimleri, endeksler ve hisse senetleri gibi tüm sembollerde/araçlarda kullanılabilen %100 yeniden boyamayan çoklu zaman çerçevesi ve Çoklu para birimi göstergesidir. Trend Screener, grafikte noktalarla ok trend sinyalleri sağlayan etkili bir trend trend göstergesidir. Trend analizörü göstergesinde bulunan özellikler: 1.
FX Power MT5 NG
Daniel Stein
5 (30)
FX Power: Daha Akıllı Ticaret Kararları için Para Birimlerinin Gücünü Analiz Edin Genel Bakış FX Power , her piyasa koşulunda başlıca para birimlerinin ve altının gerçek gücünü anlamak için vazgeçilmez bir araçtır. Güçlü para birimlerini alıp zayıf olanları satarak, FX Power ticaret kararlarınızı basitleştirir ve yüksek olasılıklı fırsatları ortaya çıkarır. İster trendlere sadık kalın ister Delta'nın aşırı değerlerini kullanarak tersine dönüşleri öngörün, bu araç ticaret tarzınıza mükemmel bir
Smart Stop Indicator – Stop-loss düzeylerini doğrudan grafikte akıllı ve hassas şekilde belirleyin Genel Bakış Smart Stop Indicator, stop-loss seviyesini tahmin ederek veya sezgilere güvenerek değil, net ve sistematik bir şekilde belirlemek isteyen traderlar için özel olarak geliştirilmiştir. Bu araç, klasik price-action mantığını (yükselen tepeler, düşen dipler) modern breakout algılama ile birleştirerek bir sonraki mantıklı stop seviyesini belirler. Trendlerde, yatay piyasalarda veya hızlı k
Top indicator for MT5   providing accurate signals to enter a trade without repainting! It can be applied to any financial assets:   forex, cryptocurrencies, metals, stocks, indices .  Watch  the video  (6:22) with an example of processing only one signal that paid off the indicator! MT4 version is here It will provide pretty accurate trading signals and tell you when it's best to open a trade and close it. Most traders improve their trading results during the first trading week with the help of
Quantum TrendPulse
Bogdan Ion Puscasu
5 (20)
SuperTrend   ,   RSI   ve   Stochastic'in   gücünü tek bir kapsamlı göstergede birleştirerek işlem potansiyelinizi en üst düzeye çıkaran nihai işlem aracı olan   Quantum TrendPulse'u   tanıtıyoruz. Hassasiyet ve verimlilik arayan yatırımcılar için tasarlanan bu gösterge, piyasa trendlerini, momentum değişimlerini ve en uygun giriş ve çıkış noktalarını güvenle belirlemenize yardımcı olur. Temel Özellikler: SuperTrend Entegrasyonu:   Güncel piyasa trendlerini kolayca takip edin ve karlılık dalgası
Göstergemiz, piyasada ilgi gösterilen bölgeleri vurgular ve ardından emir birikim bölgelerini gösterir. Büyük ölçekli bir emir defteri (order book) gibi çalışır. Bu, büyük sermaye için geliştirilmiş bir göstergedir. Performansı olağanüstüdür. Piyasada ne tür bir ilgi olursa olsun, onu görürsünüz . (Bu, tamamen yeniden yazılmış ve otomatikleştirilmiş bir versiyondur – artık manuel analiz gerekmez.) İşlem Hızı (Transaction Speed) , piyasada büyük emirlerin nerede ve ne zaman biriktiğini gösteren v
FX Levels MT5
Daniel Stein
5 (12)
FX Levels: Tüm Piyasalar İçin Son Derece Hassas Destek ve Direnç Hızlı Bakış Döviz kurları, endeksler, hisseler veya emtialar gibi herhangi bir piyasada güvenilir destek ve direnç seviyeleri belirlemek mi istiyorsunuz? FX Levels geleneksel “Lighthouse” yöntemini ileri düzey bir dinamik yaklaşımla birleştirerek neredeyse evrensel bir doğruluk sağlar. Gerçek broker deneyimimize ve otomatik günlük güncellemeler ile gerçek zamanlı güncellemelerin birleşimine dayalı olarak, FX Levels size dönüş nok
Trend indicator AI mt5
Ramil Minniakhmetov
5 (13)
Trend Ai göstergesi, trend tanımlamasını işlem yapılabilir giriş noktaları ve geri dönüş uyarılarıyla birleştirerek bir yatırımcının piyasa analizini geliştirecek harika bir araçtır. Bu gösterge, kullanıcıların forex piyasasının karmaşıklıklarında güvenle ve hassasiyetle yol almalarını sağlar. Birincil sinyallerin ötesinde, Trend Ai göstergesi geri çekilmeler veya düzeltmeler sırasında ortaya çıkan ikincil giriş noktalarını belirleyerek, yatırımcıların belirlenen trend içindeki fiyat düzeltmele
IX Power MT5
Daniel Stein
4.92 (12)
IX Power: Endeksler, Emtialar, Kripto Paralar ve Forex Piyasaları için İçgörüler Genel Bakış IX Power , endeksler, emtialar, kripto paralar ve forex sembollerinin gücünü analiz etmek için tasarlanmış çok yönlü bir araçtır. FX Power , tüm kullanılabilir döviz çiftlerinin verilerini kullanarak döviz çiftleri için maksimum doğruluk sağlarken, IX Power yalnızca temel sembolün piyasa verilerine odaklanır. Bu, IX Power 'ı forex dışındaki piyasalar için ideal ve daha basit forex analizleri için güven
Gold Sniper Scalper Pro
Ich Khiem Nguyen
3.5 (8)
Gold Sniper Scalper Pro, trader'ların giriş noktalarını belirlemesine ve riski etkili bir şekilde yönetmesine destek olmak için tasarlanmış MetaTrader 5 için profesyonel bir göstergedir. Gösterge, sinyal tespit sistemi, otomatik Entry/SL/TP yönetimi, hacim analizi ve gerçek zamanlı performans istatistikleri içeren kapsamlı bir analiz araçları seti sunar. Sistemi anlamak için kullanım kılavuzu   |   Diğer diller için kullanım kılavuzu ANA ÖZELLİKLER Sinyal tespit sistemi Gösterge, price action a
Advanced Supply Demand MT5
Bernhard Schweigert
4.5 (14)
Herhangi bir Acemi veya Uzman Tüccar için En İyi Çözüm! Bu gösterge benzersiz, yüksek kaliteli ve uygun fiyatlı bir ticaret aracıdır çünkü bir dizi tescilli özelliği ve yeni bir formülü bir araya getirdik. Bu güncelleme ile çift zaman dilimi dilimlerini gösterebileceksiniz. Yalnızca daha yüksek bir TF gösteremeyeceksiniz, aynı zamanda TF grafiğini ve ARTIK daha yüksek TF'yi de gösterebileceksiniz: YUVARLAK BÖLGELERİ GÖSTERMEK. Tüm Arz Talebi tüccarları buna bayılacak. :) Önemli Bilgiler Açıkland
Introduction to X3 Chart Pattern Scanner X3 Cherart Pattern Scanner is the non-repainting and non-lagging indicator detecting X3 chart patterns including Harmonic pattern, Elliott Wave pattern, X3 patterns, and Japanese Candlestick patterns. Historical patterns match with signal patterns. Hence, you can readily develop the solid trading strategy in your chart. More importantly, this superb pattern scanner can detect the optimal pattern of its kind. In addition, you can switch on and off individu
Grabber System MT5
Ihor Otkydach
4.82 (22)
Size mükemmel bir teknik gösterge olan Grabber’ı tanıtıyorum. Bu araç, kullanıma hazır bir “her şey dahil” işlem stratejisi olarak çalışır. Tek bir yazılım kodu içinde güçlü piyasa teknik analiz araçları, işlem sinyalleri (oklar), uyarı işlevleri ve push bildirimleri entegre edilmiştir. Bu göstergeyi satın alan herkes aşağıdaki hediyeleri ücretsiz olarak alır: Açık emirleri otomatik yönetmek için Grabber Yardımcı Aracı Kurulum, yapılandırma ve nasıl işlem yapılacağını adım adım anlatan video kıl
PZ Day Trading MT5
PZ TRADING SLU
2.83 (6)
Effortless trading: non-repainting indicator for accurate price reversals This indicator detects price reversals in a zig-zag fashion, using only price action analysis and a donchian channel. It has been specifically designed for short-term trading, without repainting or backpainting at all. It is a fantastic tool for shrewd traders aiming to increase the timing of their operations. [ Installation Guide | Update Guide | Troubleshooting | FAQ | All Products ] Amazingly easy to trade It provides
Market Structure Patterns
Samuel Manoel De Souza
4.47 (19)
Uygun sürümler:   MT4   ve   MT5 . Market Structure Patterns kanalına katılın – çalışma materyallerini indirin ve ek bilgiler edinin. İlgili gönderiler: Market Structure Patterns - Introdução Beyond Fancy Order Blocks: Using True Volumetric Analysis with Market Structure Patterns & Timeless Charts Market Structure Patterns , smart money concepts (akıllı para kavramları) temelinde geliştirilen ve SMC/ICT öğelerini grafik üzerinde gösteren bir göstergedir. Bu öğeler, işlem kararlarınızı bir üst
Protect against whipsaws: revolutionize your swing trading approach Swing Trading is the first indicator designed to detect swings in the direction of the trend and possible reversal swings. It uses the baseline swing trading approach, widely described in trading literature. The indicator studies several price and time vectors to track the aggregate trend direction and detects situations in which the market is oversold or overbought and ready to correct. [ Installation Guide | Update Guide | Tro
Dark Support Resistance  is an Indicator for intraday trading. This Indicator is programmed to identify  Support and Resistance Lines , providing a high level of accuracy and reliability. Key benefits Easily visible lines Only the most important levels will be displayed Automated adjustment for each timeframe and instrument Easy to use even for beginners Never repaints, never backpaints, Not Lag 100% compatible with Expert Advisor development All types of alerts available: Pop-up, Email, Push
Support And Resistance Screener, MetaTrader için tek bir gösterge içinde birden fazla araç sağlayan tek bir Düzey göstergesindedir. Kullanılabilir araçlar şunlardır: 1. Piyasa Yapısı Eleme Aracı. 2. Geri Çekilme Bölgesi Boğa. 3. Geri Çekilme Bölgesi Ayı. 4. Günlük Pivot Noktaları 5. haftalık Pivot Noktaları 6. aylık Pivot Puanları 7. Harmonik Modele ve hacme dayalı Güçlü Destek ve Direnç. 8. Banka Seviyesi Bölgeleri. SINIRLI SÜRELİ TEKLİF : YG Destek ve Direnç Göstergesi sadece 50 $ ve ömür boyu
Algo Pumping
Ihor Otkydach
4.75 (20)
PUMPING STATION – Kişisel “her şey dahil” stratejiniz Karşınızda PUMPING STATION — forex dünyasında işlem yapma şeklinizi heyecan verici ve etkili bir sürece dönüştürecek devrim niteliğinde bir gösterge. Bu sadece bir yardımcı değil, güçlü algoritmalarla donatılmış tam teşekküllü bir ticaret sistemidir ve daha istikrarlı işlem yapmanıza yardımcı olur. Bu ürünü satın aldığınızda ŞUNLARI ÜCRETSİZ olarak alırsınız: Özel ayar dosyaları: Otomatik kurulum ve maksimum performans için. Adım adım video e
Yazarın diğer ürünleri
Candle Timer Countdown displays the remaining time before the current bar closes and a new bar forms. It can be used for time management. MT4 version here! Feature Highlights Tracks server time not local time Configurable Text Color and Font Size Optional Visualization of the Symbol Daily Variation Optimized to reduce CPU usage Input Parameters Show Daily Variation: true/false Text Font Size Text Color If you still have questions, please contact me by direct message:  https://www.mql5.com/en/u
FREE
MACD Gün İçi Trend, 1960'larda Gerald Appel tarafından oluşturulan orijinal MACD'nin uyarlanmasıyla geliştirilen bir Göstergedir. Yıllarca süren ticaret boyunca, MACD'nin parametrelerini Fibonacci oranlarıyla değiştirerek, trend hareketlerinin sürekliliğini daha iyi bir şekilde sunduğumuz ve bir fiyat trendinin başlangıcını ve sonunu daha verimli bir şekilde tespit etmeyi mümkün kıldığımız gözlemlendi. Fiyat trendlerini tespit etmedeki verimliliği sayesinde, aynı zamanda tepe ve dip farklarını
FREE
Candle Timer Countdown displays the remaining time before the current bar closes and a new bar forms. It can be used for time management. MT5 version here! Feature Highlights Tracks server time not local time Configurable Text Color and Font Size Optional Visualization of the Symbol Daily Variation Optimized to reduce CPU usage Input Parameters Show Daily Variation: true/false Text Font Size Text Color If you still have questions, please contact me by direct message:  https://www.mql5.com/en/u
FREE
Pivot Point Fibo RSJ, Fibonacci oranlarını kullanarak günün destek ve direnç çizgilerini izleyen bir göstergedir. Bu muhteşem gösterge, Fibonacci oranlarını kullanarak Pivot Point üzerinden 7 seviyeye kadar destek ve direnç oluşturur. Fiyatların, bir operasyonun olası giriş/çıkış noktalarını algılamanın mümkün olduğu bu destek ve direncin her bir düzeyine uyması harika. Özellikleri 7 seviyeye kadar destek ve 7 seviye direnç Seviyelerin renklerini ayrı ayrı ayarlayın Girişler Pivot Tipi Pivo
FREE
Candle Counter is an indicator that prints the number of candles from the first candle of the day . The first candle of the day will be the number 1 and each new candle will be increased by 1 in this count. Input Parameters Choose from even, odd or all Distance from candle to Print the number Text Font Size Text Font Color If you still have questions, please contact me by direct message:  https://www.mql5.com/en/users/robsjunqueira/
FREE
MACD Gün İçi Trend PRO, 1960'larda Gerald Appel tarafından oluşturulan orijinal MACD'nin uyarlanmasıyla geliştirilen bir Göstergedir. Yıllarca süren ticaret sayesinde, MACD'nin parametrelerini Fibonacci oranlarıyla değiştirerek, trend hareketlerinin sürekliliğinin daha iyi bir sunumunu sağladığımız ve bir fiyat trendinin başlangıcını ve sonunu daha verimli bir şekilde tespit etmeyi mümkün kıldığımız gözlemlendi. Fiyat trendlerini tespit etmedeki etkinliği sayesinde, üst ve dip farklarını çok
Pivot Point Fibo RSJ, Fibonacci oranlarını kullanarak günün destek ve direnç çizgilerini izleyen bir göstergedir. Bu muhteşem gösterge, Fibonacci oranlarını kullanarak Pivot Point üzerinden 7 seviyeye kadar destek ve direnç oluşturur. Fiyatların, bir operasyonun olası giriş/çıkış noktalarını algılamanın mümkün olduğu bu destek ve direncin her bir düzeyine uyması harika. Özellikleri 7 seviyeye kadar destek ve 7 seviye direnç Seviyelerin renklerini ayrı ayrı ayarlayın Girişler Pivot Tipi Pivo
FREE
Weis Waves RSJ
JETINVEST
4.56 (9)
The Weis Waves RSJ Indicator sums up volumes in each wave. This is how we receive a bar chart of cumulative volumes of alternating waves. Namely the cumulative volume makes the Weis wave charts unique. It allows comparing the relation of the wave sequence characteristics, such as correspondence of the applied force (expressed in the volume) and received result (the price progress). If you still have questions, please contact me by direct message:  https://www.mql5.com/en/users/robsjunqueira/
FREE
VWAP Fibo Bands RSJ is an indicator that traces the lines of the daily VWAP and from it creates bands using Fibonacci proportions. This spectacular indicator creates 10 band levels through the selected VWAP period using Fibonacci ratios. It is fantastic how the prices respect each level of the bands, where it is possible to realize that almost every time the price closes above / below a level of the bands he will seek the next one. If close above will seek to reach the level above and if close
FREE
MACD Gün İçi Trend, 1960'larda Gerald Appel tarafından oluşturulan orijinal MACD'nin uyarlanmasıyla geliştirilen bir Göstergedir. Yıllarca süren ticaret boyunca, MACD'nin parametrelerini Fibonacci oranlarıyla değiştirerek, trend hareketlerinin sürekliliğini daha iyi bir şekilde sunduğumuz ve bir fiyat trendinin başlangıcını ve sonunu daha verimli bir şekilde tespit etmeyi mümkün kıldığımız gözlemlendi. Fiyat trendlerini tespit etmedeki verimliliği sayesinde, aynı zamanda tepe ve dip farklarını
FREE
Tabajara Ogro
JETINVEST
4.75 (12)
Setup Tabajara was created by a Brazilian trader known as  "The OGRO of Wall Street" . The idea of this setup is to indicate to the trader the current trend of prices and  the type of operation should be looked for in the graph. Operation It does this through the relation of the closing price position and the     of 20 periods, by painting the candles in 4 possible colors : Green -> Price rising in upward trend (Search entry points for PURCHASE) Black -> Price correcting in Bullish Trend (Sear
FREE
This indicator sums up the difference between the sells aggression and the buys aggression that occurred in each Candle, graphically plotting the waves of accumulation of the aggression volumes.   Through these waves an exponential average is calculated that indicates the direction of the business flow. Note: This indicator DOES NOT WORK for Brokers and/or Markets WITHOUT the type of aggression (BUY or SELL).   Be sure to try our Professional version with configurable features and alerts:  Agre
FREE
Funcionamento: O Painel  Netting Panel RSJ  funciona com   qualquer ativo   e em   qualquer tempo gráfico . Ele funciona em contas do tipo " Netting " e " Hedge ", mas gerencia apenas uma posição por ativo, por isso o nome   Netting.   Se ele for executado em contas do tipo " Hedge ", ele fará o gerenciamento e proteção   apenas da posição mais antiga , ou seja, da primeira posição que foi aberta por ele. Em contas " Netting " quando os botões " SELL " ou " BUY " forem pressionados,   ocorrerá
FREE
RENKO PRICE ACTION ATR is an "Expert Advisor" developed through the construction of the Renko Chart where each BRICK has the size calculated through the ATR of the period selected by the user. Renko charts are designed to filter out minor price movements, thus making it easier for traders to focus on important trends. Due to its efficiency in detecting price trends, it is also possible to clearly identify supports and resistances as well as top and bottom divergences, thus making better use of t
This simple indicator paints with a darker color on the volume bar when the quantity traded is above the average of select number of periods of the volume itself, highlighting the moments when there was a large volume of deals above the average. It is also possible to use a configuration of four colors where the color tone shows a candle volume strength. The indicator defaults to the simple average of 20 periods, but it is possible to change to other types of averages and periods. If you like t
FREE
This indicator calculates the difference between the SELL aggression and the BUY aggression that occurred in each Candle, plotting the balance of each one graphically. Note: This indicator DOES NOT WORK for Brokers and/or Markets WITHOUT the type of aggression (BUY or SELL). Be sure to try our   Professional   version with configurable features and alerts:   Delta Agression Volume PRO Settings Aggression by volume (Real Volume) or by number of trades (Tick Volume) Start of the Aggression Delta
FREE
Vwap RSJ
JETINVEST
4.8 (10)
VWAP RSJ is an indicator that plots the Hourly, Daily, Weekly and Monthly  VWAP Lines. Large institutional buyers and   mutual funds   use the VWAP ratio to help move into or out of stocks with as small of a market impact as possible. Therefore, when possible, institutions will try to buy below the VWAP, or sell above it. This way their actions push the price back toward the average, instead of away from it. Based on this information I developed this indicator that combines 4 types of VWAP Tim
FREE
This simple indicator paints with a darker color on the volume bar when the quantity traded is above the average of select number of periods of the volume itself, highlighting the moments when there was a large volume of deals above the average. It is also possible to use a configuration of four colors where the color tone shows a candle volume strength. The indicator defaults to the simple average of 20 periods, but it is possible to change to other types of averages and periods. If you like t
FREE
MACD Gün İçi Trend PRO, 1960'larda Gerald Appel tarafından oluşturulan orijinal MACD'nin uyarlanmasıyla geliştirilen bir Göstergedir. Yıllarca süren ticaret sayesinde, MACD'nin parametrelerini Fibonacci oranlarıyla değiştirerek, trend hareketlerinin sürekliliğinin daha iyi bir sunumunu sağladığımız ve bir fiyat trendinin başlangıcını ve sonunu daha verimli bir şekilde tespit etmeyi mümkün kıldığımız gözlemlendi. Fiyat trendlerini tespit etmedeki etkinliği sayesinde, üst ve dip farklarını çok
The indicator Supply Demand RSJ PRO calculates and plots the "Supply" and "Demand" zones on the graph, identifying the type of Zone (Weak, Strong, Verified, Proven) and in case of retests of the Zone it shows how many times it was retested. "Supply" Zones are the price zones where more supply than demand has occurred, driving prices down. "Demand" Zones are the price zones where more demand than supply has occurred, pushing prices up. Be sure to try our professional version with configurable fe
Aggression Wave PRO is an indicator developed to monitor the divergence, strength, and continuity of the aggression volume of sell and buy negotiations.  The  Agrression Wave PRO   has features that allow you to view beyond the accumulated delta volume of the day. Note: This indicator DOES NOT WORK for Brokers and/or Markets WITHOUT the type of aggression (BUY or SELL). Cryptocurrencies and Forex do not provide this type of information, that is, it does not work with it. Operation It is possib
Delta Aggression Volume PRO is an indicator developed to monitor the strength and continuity of the aggression volume of sell and buy negotiations. Note: This indicator DOES NOT WORK for Brokers and/or Markets WITHOUT the type of aggression (BUY or SELL). Cryptocurrencies and Forex do not provide this type of data, that is, it does not work with them. O Delta Agrression Volume PRO has features that allow you to view beyond the delta volume of the day. Operation Multi symbols  (those who provid
The indicator Supply Demand RSJ PRO calculates and plots the "Supply" and "Demand" zones on the graph, identifying the type of Zone (Weak, Strong, Verified, Proven) and in case of retests of the Zone it shows how many times it was retested. "Supply" Zones are the price zones where more supply than demand has occurred, driving prices down. "Demand" Zones are the price zones where more demand than supply has occurred, pushing prices up. Classification of zones Weak: Price region which, if re-test
Trend WDO B3, MT5 platformu için oluşturulmuş ve BREZİLYA'da B3'te MINI DOLAR INDEX (WDO) ile çalışmak üzere optimize edilmiş profesyonel bir ticaret sistemidir. Sistem, yapılan hesaplamalara göre her zaman diliminde ağırlıklar uygulayarak fiyat trendini belirlemek için birkaç zaman diliminde (1M, 5M, 15M, 30M, H1, H4, D1) Bulanık Mantık kullanır. Trendi belirledikten sonra, sistem ortalama oynaklığa göre bir STOP emri (AL veya SATIŞ) konumlandırır ve pozisyon açıldığında, EA, her zaman karı m
Trend WIN B3, MT5 platformu için oluşturulmuş ve BREZİLYA'da B3'te MINI FUTURE INDEX (WIN) ile çalışmak üzere optimize edilmiş profesyonel bir ticaret sistemidir. Sistem, yapılan hesaplamalara göre her zaman diliminde ağırlıklar uygulayarak fiyat trendini belirlemek için birkaç zaman diliminde (1M, 5M, 15M, 30M, H1, H4, D1) Bulanık Mantık kullanır. Trendi belirledikten sonra, sistem ortalama oynaklığa göre bir STOP emri (AL veya SATIŞ) konumlandırır ve pozisyon açıldığında, EA, her zaman karı
EA, ne zaman ticaret yapılacağına karar vermek için oynaklık, yayılma, sıklık ve zamanlamayı kullanır. EA, Pozisyonları açmak için Limit Emirleri yöntemini kullanır. Bu durumda, Kayma, girişlerin yürütülmesinde en fazla olumlu olacaktır. EA, sistemin odak noktası sermayenizi korurken para kazanmak olduğundan, Takip Edilen Kâr Al mantığını kullanır. Çoğu ticaret, bir keskin nişancı vesikalığı gibi, hızlı bir şekilde kapatılır. Ana Özellikler martingal kullanmaz ızgara kullanmaz Optimize edilmiş
EA, ne zaman ticaret yapılacağına karar vermek için oynaklık, yayılma, sıklık ve zamanlamayı kullanır. EA, Pozisyonları açmak için Limit Emirleri yöntemini kullanır. Bu durumda, Kayma, girişlerin yürütülmesinde en fazla olumlu olacaktır. EA, sistemin odak noktası sermayenizi korurken para kazanmak olduğundan, Takip Edilen Kâr Al mantığını kullanır. Çoğu ticaret, bir keskin nişancı vesikalığı gibi, hızlı bir şekilde kapatılır. Ana Özellikler martingal kullanmaz ızgara kullanmaz Optimize edilmi
Filtrele:
Kittisak Polsuk
92
Kittisak Polsuk 2025.11.21 04:32 
 

Work for me, thank you

baik6211
86
baik6211 2025.08.24 08:07 
 

very good fo me thank you

JETINVEST
360681
Geliştiriciden yanıt Roberto Sant Ana Junqueira 2025.08.25 09:30
enjoy
Lydia Kwarteng
2110
Lydia Kwarteng 2025.06.12 11:38 
 

Kullanıcı incelemeye herhangi bir yorum bırakmadı

JETINVEST
360681
Geliştiriciden yanıt Roberto Sant Ana Junqueira 2025.06.12 12:14
enjoy
Benjamin Afedzie
3602
Benjamin Afedzie 2025.06.11 15:44 
 

works for me

JETINVEST
360681
Geliştiriciden yanıt Roberto Sant Ana Junqueira 2025.06.11 20:38
enjoy
Kedrov
1159
Kedrov 2025.05.15 12:12 
 

Просмотрел штук 40 VWAP в разных исполнениях. Но ни в одном не нашел коррекции по временной зоне по GMT – такое впечатление, что все брокеры работают в одной зоне. Странно!

33.Hl21
154
33.Hl21 2025.04.12 13:27 
 

Excelente Indicador!!

JETINVEST
360681
Geliştiriciden yanıt Roberto Sant Ana Junqueira 2025.04.12 13:47
enjoy
PhanHuyThanh887
44
PhanHuyThanh887 2025.01.16 06:05 
 

really good

JETINVEST
360681
Geliştiriciden yanıt Roberto Sant Ana Junqueira 2025.01.19 15:08
enjoy
Giovanni Di Grazia
130
Giovanni Di Grazia 2024.12.20 14:12 
 

good

JETINVEST
360681
Geliştiriciden yanıt Roberto Sant Ana Junqueira 2024.12.23 15:47
enjoy
Francisco Gomes Da Silva
142473
Francisco Gomes Da Silva 2024.09.22 02:01 
 

Obrigado por esse indicador excelente do orgro de all street, eu só fiquei em duvidas porque você tem 2 indicadores dele, não entendi muito bem a diferença mas baixei e estou usando esse daqui

JETINVEST
360681
Geliştiriciden yanıt Roberto Sant Ana Junqueira 2024.12.23 15:48
Tem dois, porque este é sem VWAP e outro com VWAP. A diferença é que o que tem a VWAP faz a análise das cores através dela até o momento que no dia a média de 20 já tem 20 candles
Dharmesh Kumar
133
Dharmesh Kumar 2024.07.26 05:29 
 

This indicator really works!! Thanks a lot for sharing...

JETINVEST
360681
Geliştiriciden yanıt Roberto Sant Ana Junqueira 2024.07.29 17:11
enjoy
Cappuccinono
92
Cappuccinono 2024.06.18 16:36 
 

Kullanıcı incelemeye herhangi bir yorum bırakmadı

JETINVEST
360681
Geliştiriciden yanıt Roberto Sant Ana Junqueira 2024.06.20 16:55
tks
Seth Tetteh
2276
Seth Tetteh 2024.04.25 12:07 
 

nice one

JETINVEST
360681
Geliştiriciden yanıt Roberto Sant Ana Junqueira 2024.04.25 12:47
enjoy
Chispa2023
64
Chispa2023 2024.04.21 14:54 
 

Excelente! Obrigado pela sua generosidade.

JETINVEST
360681
Geliştiriciden yanıt Roberto Sant Ana Junqueira 2024.04.24 16:43
Obrigado pelo review
Tanya Silver
86
Tanya Silver 2024.02.06 21:38 
 

Awesome indicator. Simple, customisable, effective.

JETINVEST
360681
Geliştiriciden yanıt Roberto Sant Ana Junqueira 2024.02.07 12:02
tks
mohamad.H Valipour
296
mohamad.H Valipour 2023.12.15 12:34 
 

Kullanıcı incelemeye herhangi bir yorum bırakmadı

JETINVEST
360681
Geliştiriciden yanıt Roberto Sant Ana Junqueira 2023.12.15 13:00
tks
eduardonascimentto23
14
eduardonascimentto23 2023.08.30 02:38 
 

Já uso a muito tempo... MARAVILHOSO

JETINVEST
360681
Geliştiriciden yanıt Roberto Sant Ana Junqueira 2023.08.30 11:44
Obrigado pelo review
TonyynoT
29
TonyynoT 2023.04.05 09:06 
 

Ótimo indicador! Só acho que os candles deveriam manter a cor do tipo se desce ficar vermelho... sobe ficar verde, porque confunde um pouco isso, mas é muito bom!

JETINVEST
360681
Geliştiriciden yanıt Roberto Sant Ana Junqueira 2023.08.30 11:44
Bom dia Tony, mas o indicador pinta os candles conforme a posição das médias. Da uma lida na descrição que você vai compreender a ideia. Abraço
dallagnol81
17
dallagnol81 2023.02.17 15:04 
 

entrega o que esta descrito valeu

JETINVEST
360681
Geliştiriciden yanıt Roberto Sant Ana Junqueira 2023.02.17 15:12
tks
teatime
76
teatime 2023.01.18 02:23 
 

very good indicator !!! tysm for many green pips !!!

JETINVEST
360681
Geliştiriciden yanıt Roberto Sant Ana Junqueira 2023.02.17 15:12
tks
KinGor
71
KinGor 2023.01.05 13:46 
 

Kullanıcı incelemeye herhangi bir yorum bırakmadı

JETINVEST
360681
Geliştiriciden yanıt Roberto Sant Ana Junqueira 2023.02.17 15:12
tks
123
İncelemeye yanıt