Dashboard Stochastic Multicurrency
- Indicatori
- Versione: 7.20
- Aggiornato: 12 maggio 2026
- Attivazioni: 10

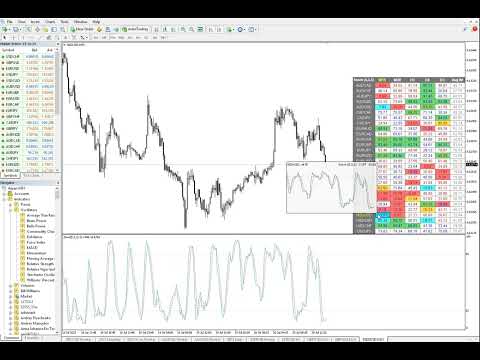
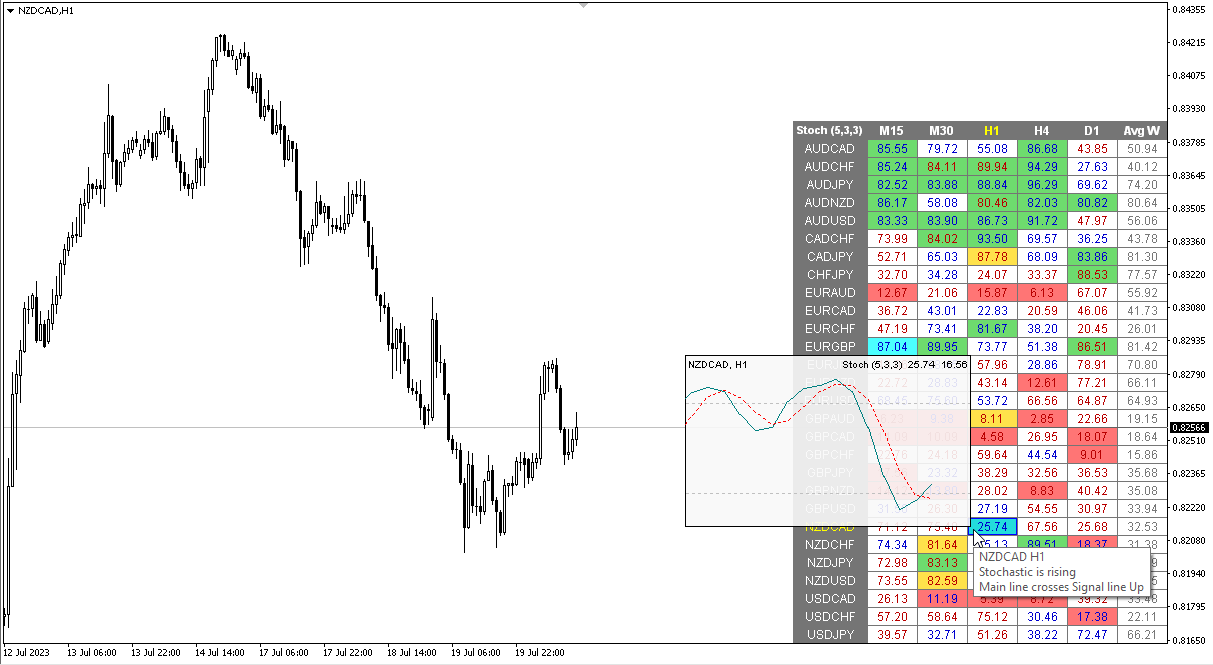
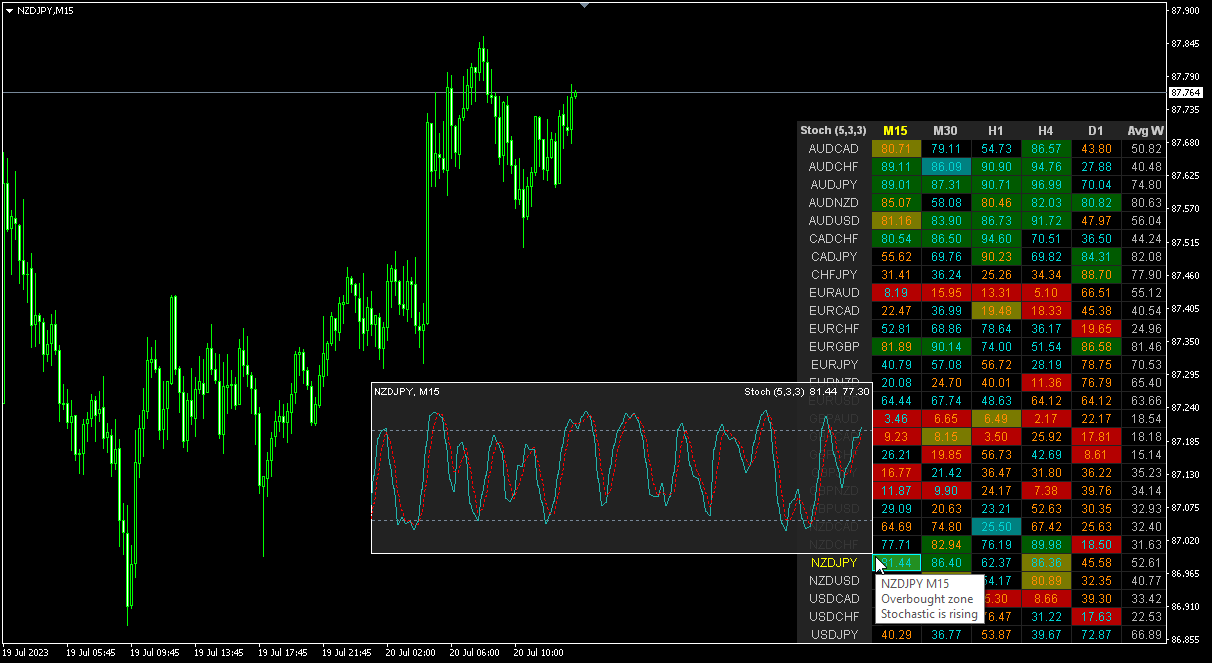
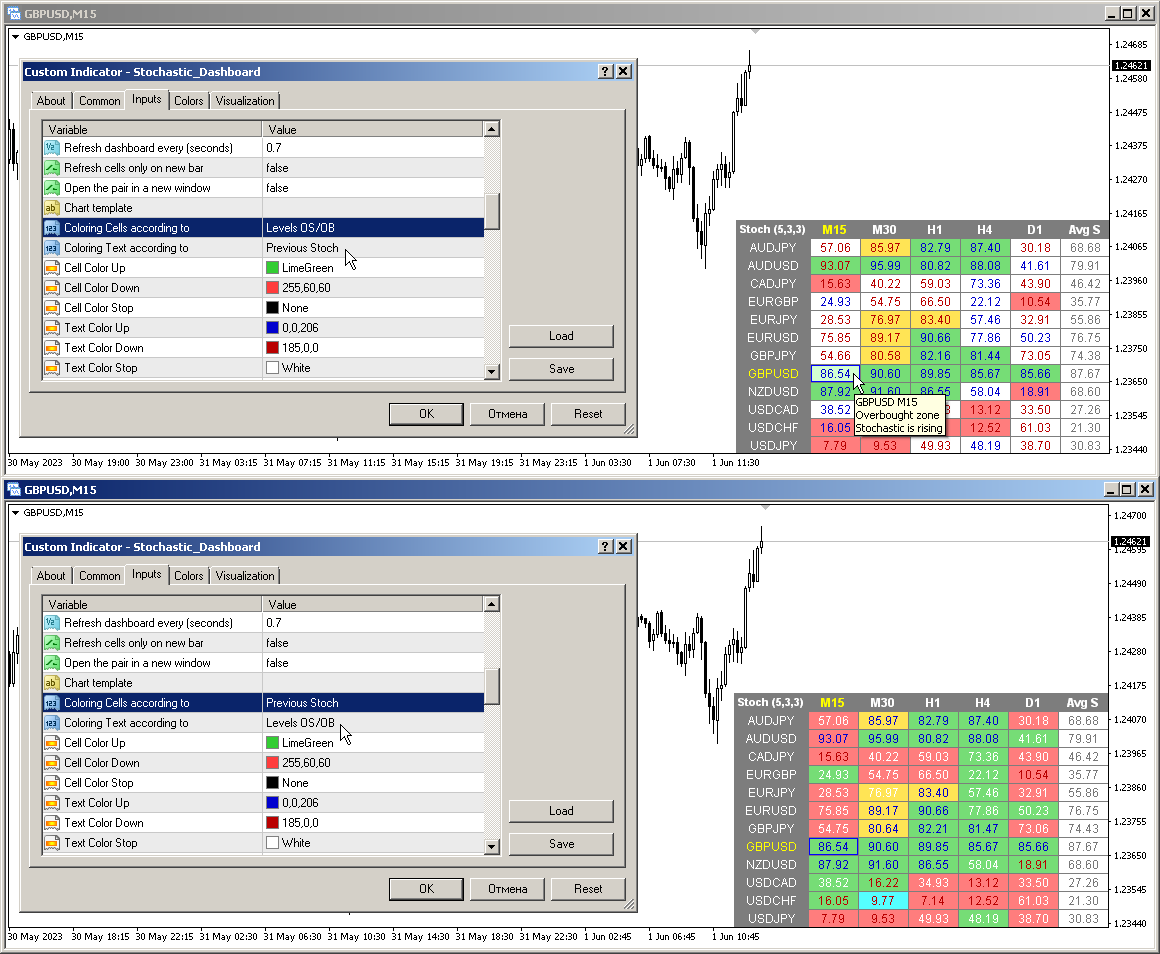
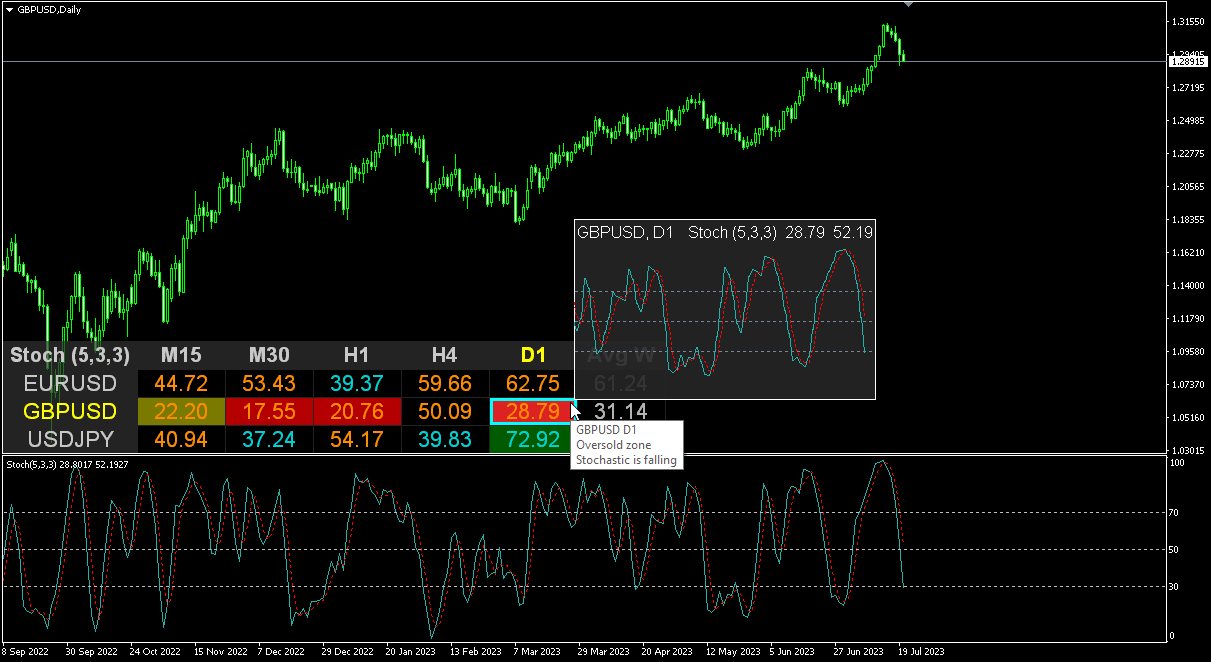
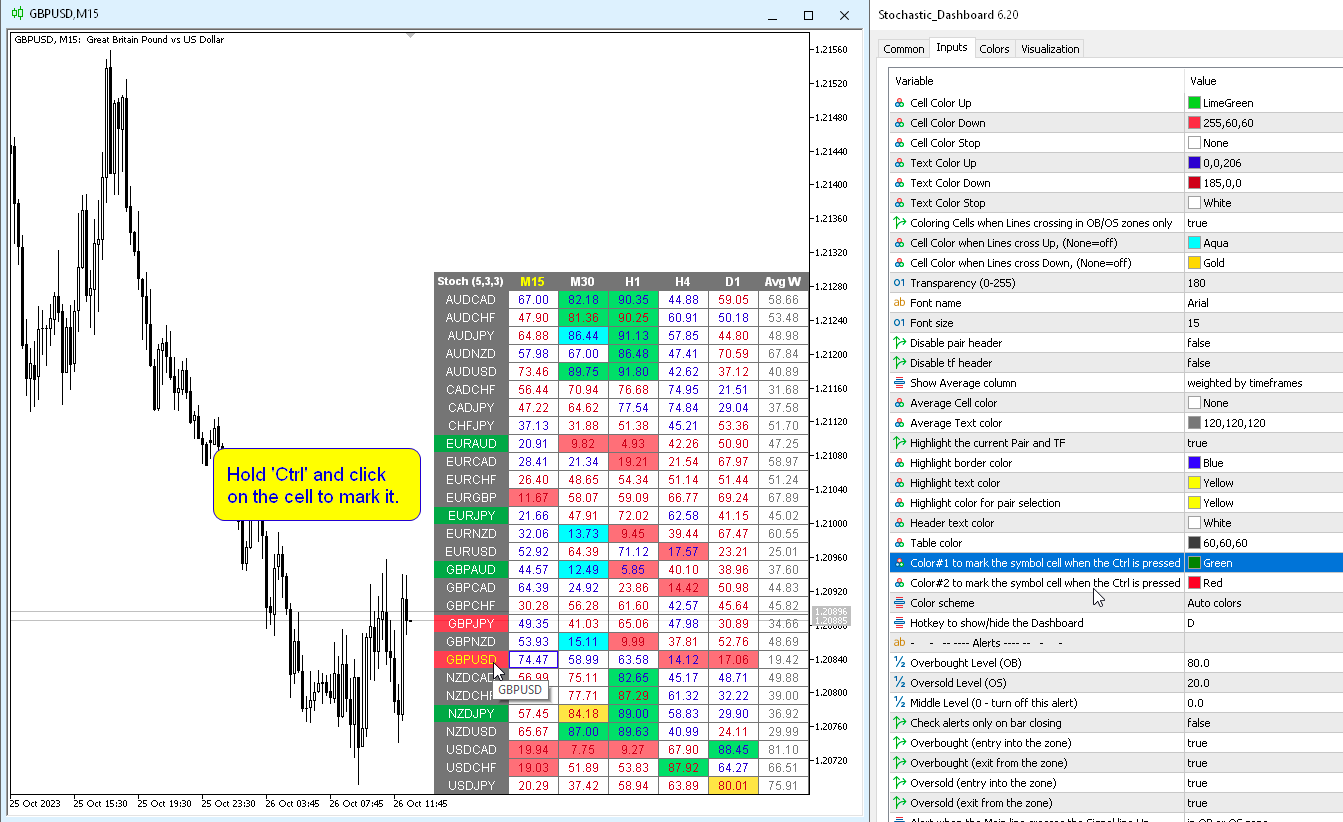
Modifica multivaluta e multitimeframe dell'oscillatore stocastico. È possibile specificare qualsiasi valuta e intervallo di tempo desiderati nei parametri. Il pannello visualizza i valori correnti e le intersezioni delle linee: Segnale e Principale (crossover stocastico). Inoltre, l'indicatore può inviare notifiche quando si attraversano i livelli di ipercomprato e ipervenduto. Cliccando su una cella con un punto, questo simbolo e punto verranno aperti. Questo è lo scanner MTF.
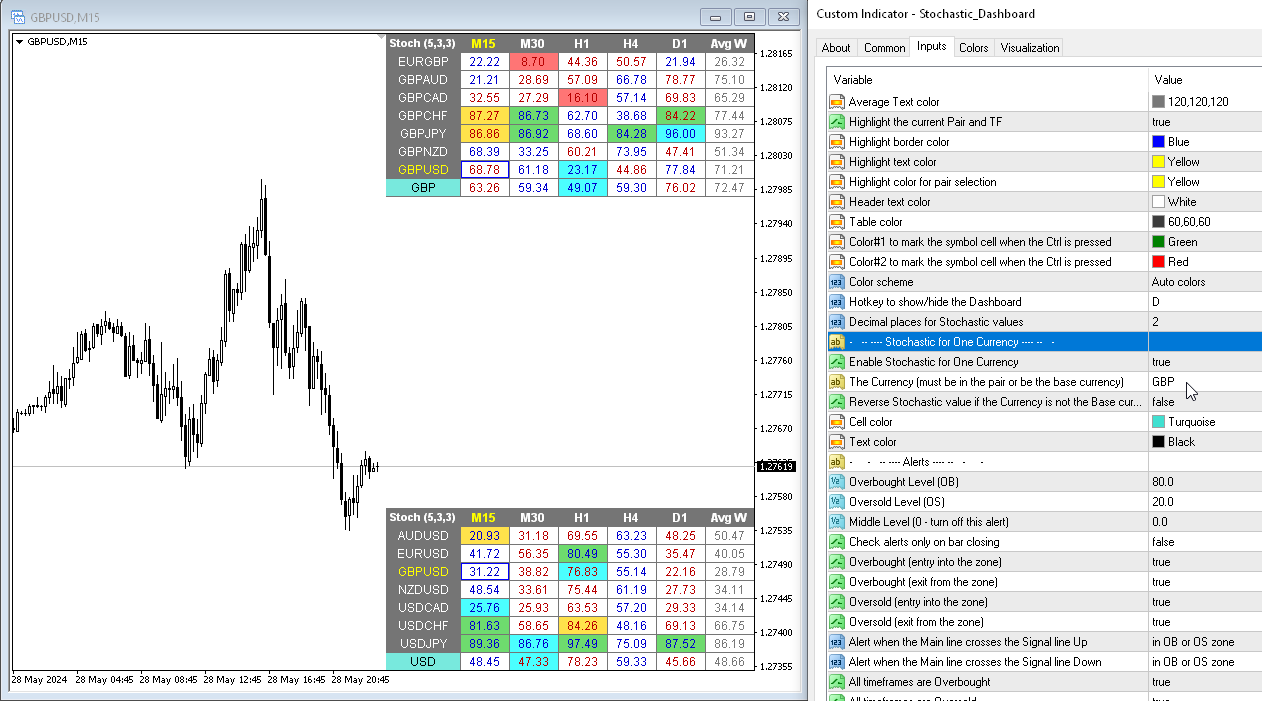
Similmente al Valuta Strength Meter (CSM), la Dashboard può selezionare automaticamente le coppie che contengono una valuta specifica, o quelle coppie che hanno quella valuta come valuta base. L'indicatore cerca la valuta in tutte le coppie specificate nel “Set di coppie”; le altre coppie vengono ignorate. E sulla base di queste coppie, viene calcolato lo stocastico totale per questa valuta. E puoi vedere quanto è forte o debole quella valuta.
La chiave per nascondere la dashboard dal grafico è "D" per impostazione predefinita
Parametri
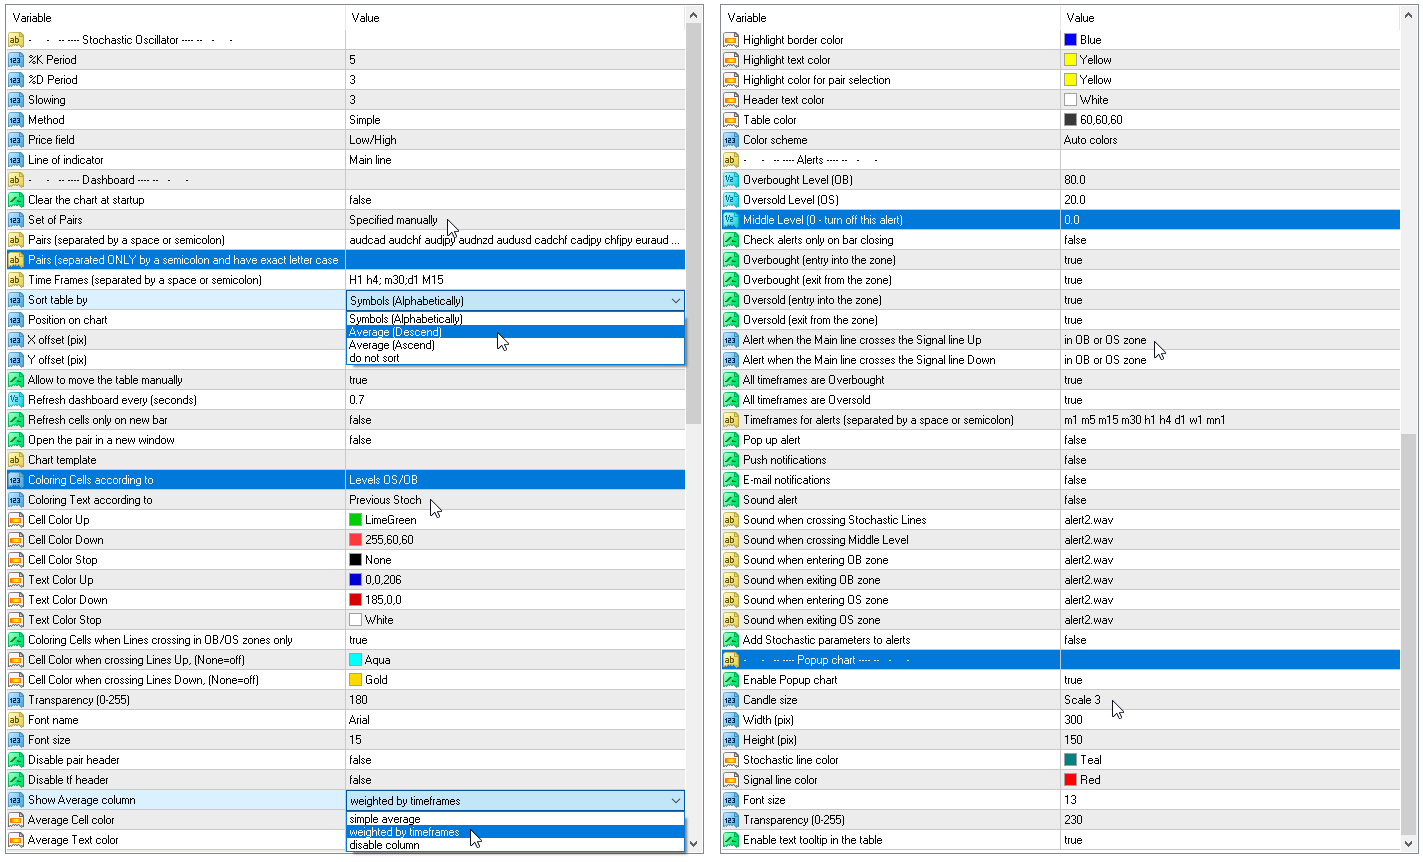
%K Period — il periodo della linea K.
%D Period — il periodo della linea D.
Slowing — rallentamento;
Method — metodo di media;
Price field — tipo di prezzo.
Line of indicator — indice della linea.
Clear the chart at startup — cancella il grafico all'avvio
Set of Pairs — set di simboli:
— Market Watch — Coppie da "Market Watch" del MT.— Specified manually — coppie specificate manualmente, nei parametri "Coppie".— Current pair — mostra solo la coppia attuale.
Pairs (separated by a space or semicolon) — elenco di simboli separati da spazi o punto e virgola. I nomi delle valute dovrebbero essere scritti esattamente come quelli del broker, mantenendo maiuscole e minuscole e prefisso/suffisso.
Time Frames (separated by a space or semicolon) — elenco di intervalli temporali separati da spazi o punti e virgola (intervallo temporale multiplo).
Sort pairs — ordina l'elenco delle coppie.
Position on chart — angolo per visualizzare il pannello sulla carta.
X offset (pix) — sposta il pannello lungo l'asse X;
Y offset (pix) — sposta il pannello lungo l'asse Y;
Refresh dashboard every (seconds) — periodo di aggiornamento per tutte le coppie e gli intervalli di tempo.
Open the pair in a new window — apri un simbolo in una nuova finestra del grafico facendo clic.
Chart template — il nome del modello per il grafico, se il grafico si apre in una nuova finestra.
Coloring the cells according to the — al colore delle celle della tabella in base ai livelli di ipercomprato/ipervenduto o in base alla direzione della candela precedente.
Check Lines crossing only in OB/OS zones — determina l'intersezione delle linee solo nelle zone Ipercomprato/Ipervenduto.
Impostazioni del colore
Color Up — colore della cella se l'indicatore aumenta o supera il livello di ipercomprato.
Color Down — colore della cella se l'indicatore diminuisce o supera il livello di ipervenduto.
Color Stop — colore della cella se l'indicatore non cambia.
Color when crossing Lines Up — colore della cella quando la linea principale incrocia la linea del segnale.
Color when crossing Lines Down — colore della cella quando la linea principale attraversa la linea del segnale verso il basso.
Transparency (0-255) — trasparenza del pannello.
Font name — nome del carattere.
Avvisi
Overbought level — livello di ipercomprato per gli avvisi.
Oversold level — livello di ipervenduto per gli avvisi.
Middle Level (0 — turn off this alert) — controllo del passaggio di terzo livello (solo avviso). Se viene specificato zero, il controllo di questo livello è disabilitato.
Check alerts only on bar closing — controlla gli avvisi solo quando il bar è chiuso.
Overbought/Oversold (entry into the zone) — invia un avviso quando si entra nella zona ipercomprato o ipervenduto.
Overbought/Oversold (exit from the zone) — invia un avviso quando si esce dalla zona ipercomprato o ipervenduto.
Main line crosses the Signal line Up — avvisa quando la linea principale attraversa la linea del segnale in alto.
Main line crosses the Signal line Down — avvisa quando la linea principale attraversa la linea del segnale in basso.
All timeframes are Overbought/Oversold — avvisa quando tutti i periodi entrano nella zona di ipercomprato o ipervenduto.
Timeframes for alerts (separated by a space or semicolon) — elenco dei periodi per i quali verrà inviato l'avviso (separati da uno spazio o un punto e virgola).


Wow, thank you so much. Feeling very happy for your 6.80 update. Thank you for creating a great indicator