Dashboard Stochastic Multicurrency
- Indikatoren
- Version: 7.20
- Aktualisiert: 12 Mai 2026
- Aktivierungen: 10

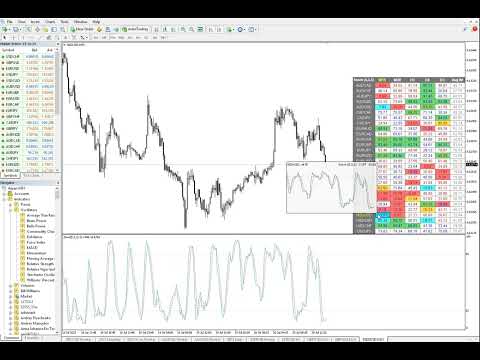
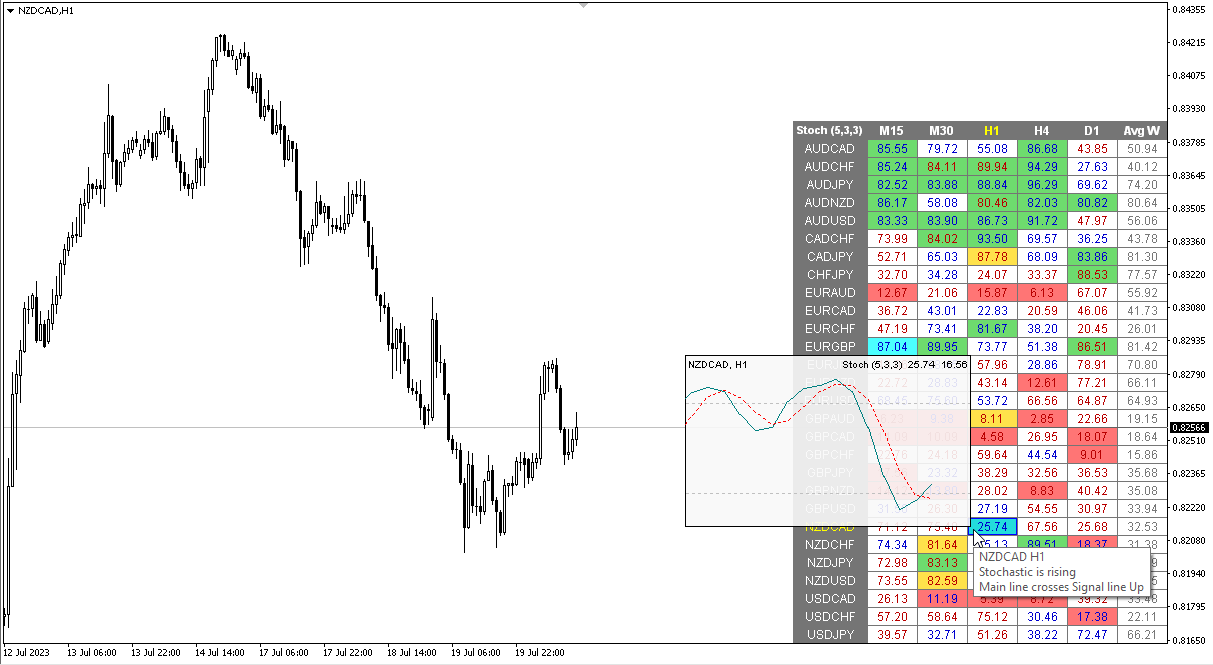
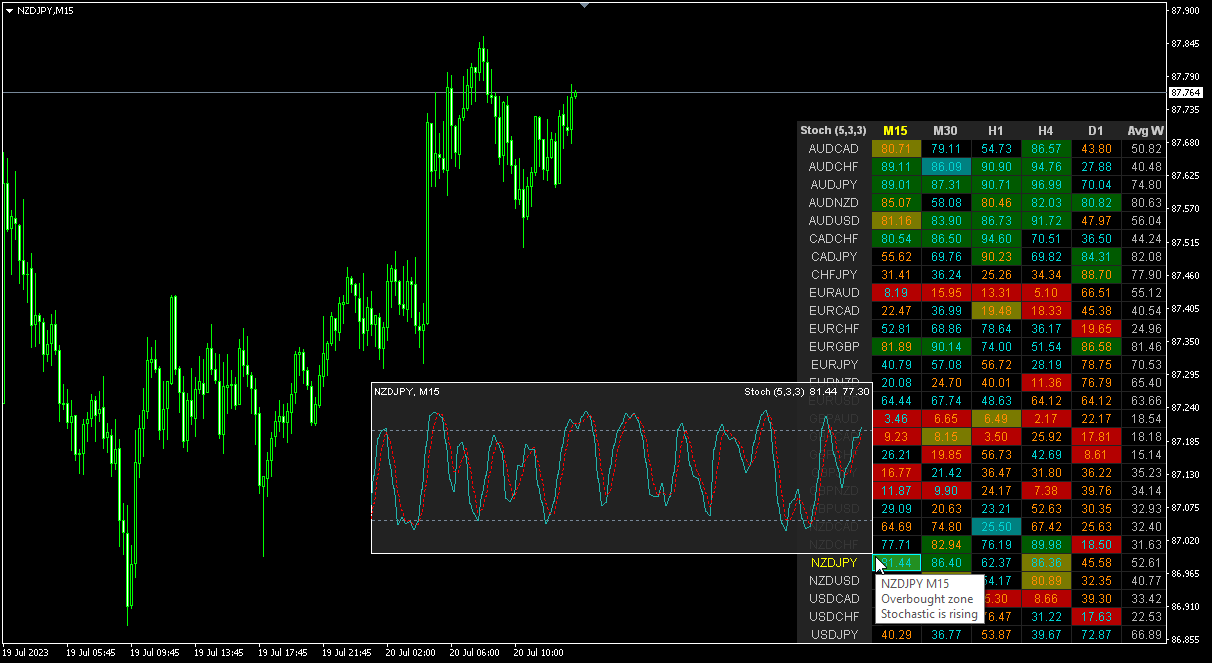
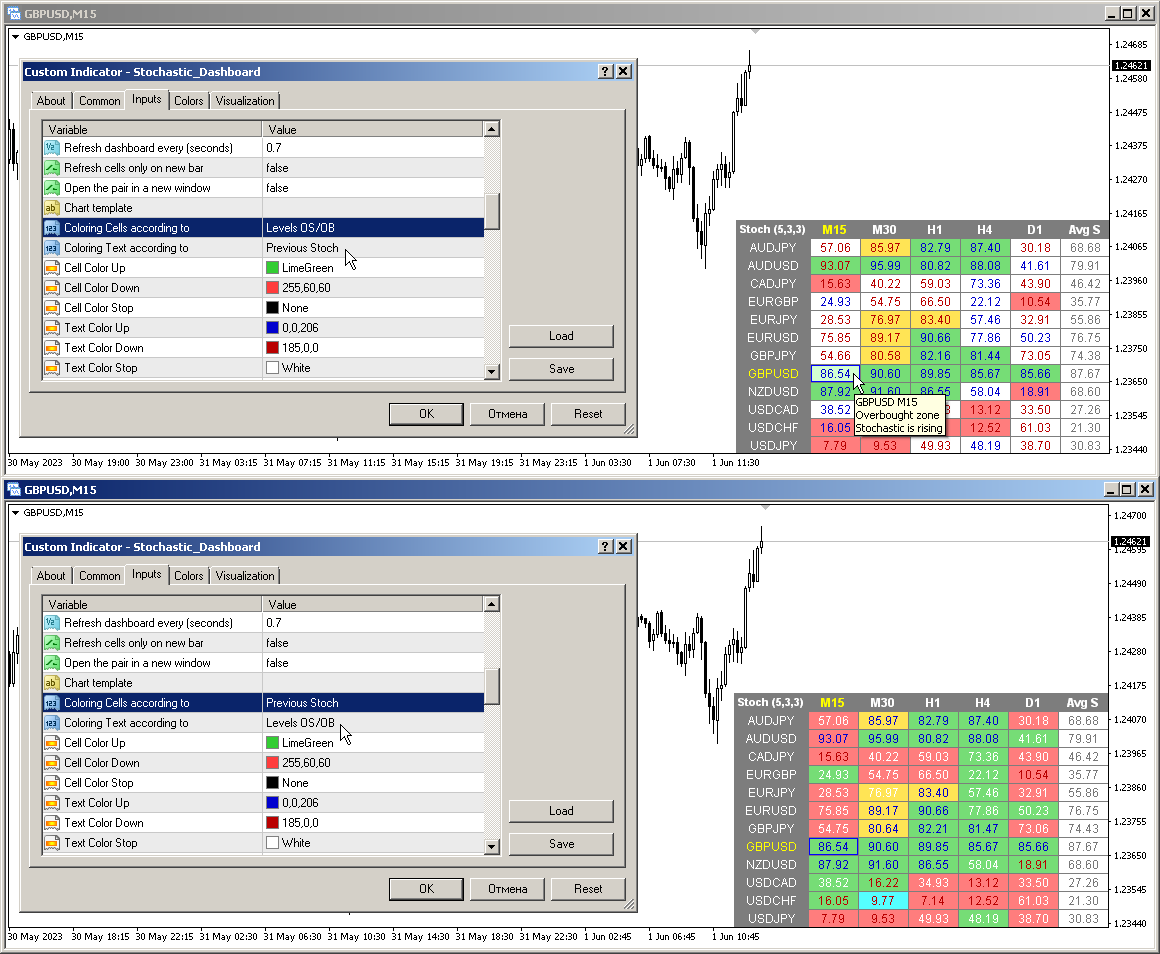
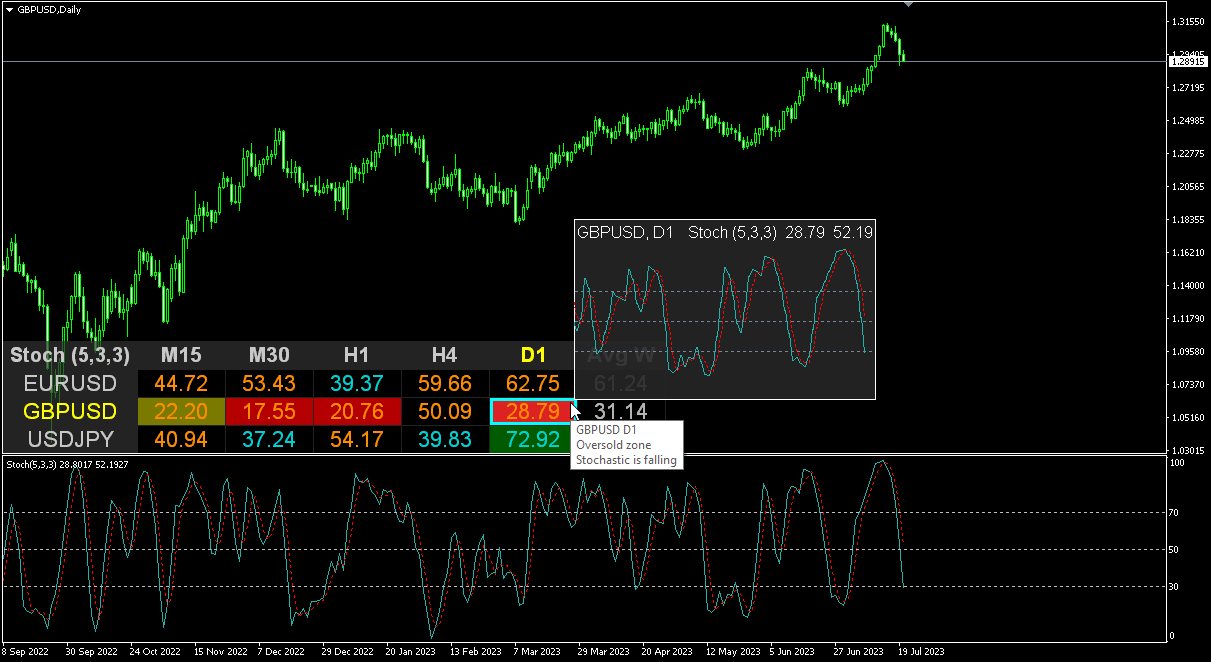
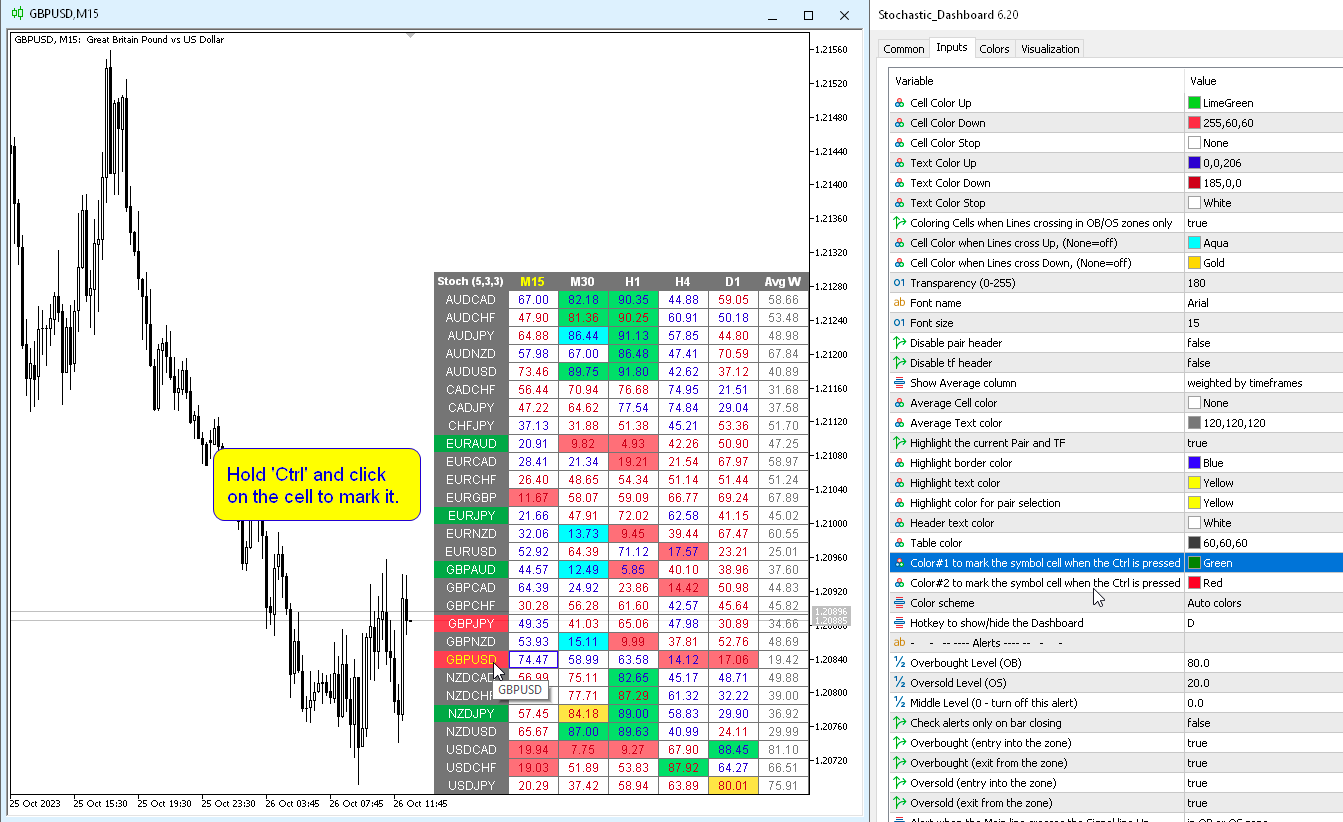
Modifikation des stochastischen Oszillators für mehrere Währungen und mehrere Zeitrahmen. Sie können in den Parametern beliebige Währungen und Zeitrahmen angeben. Das Panel zeigt die aktuellen Werte und Schnittpunkte der Linien – Signal und Main (Stochastik-Crossover) – an. Außerdem kann der Indikator Benachrichtigungen senden, wenn überkaufte und überverkaufte Niveaus überschritten werden. Durch Klicken auf eine Zelle mit einem Punkt werden dieses Symbol und dieser Punkt geöffnet. Dies ist der MTF-Scanner.
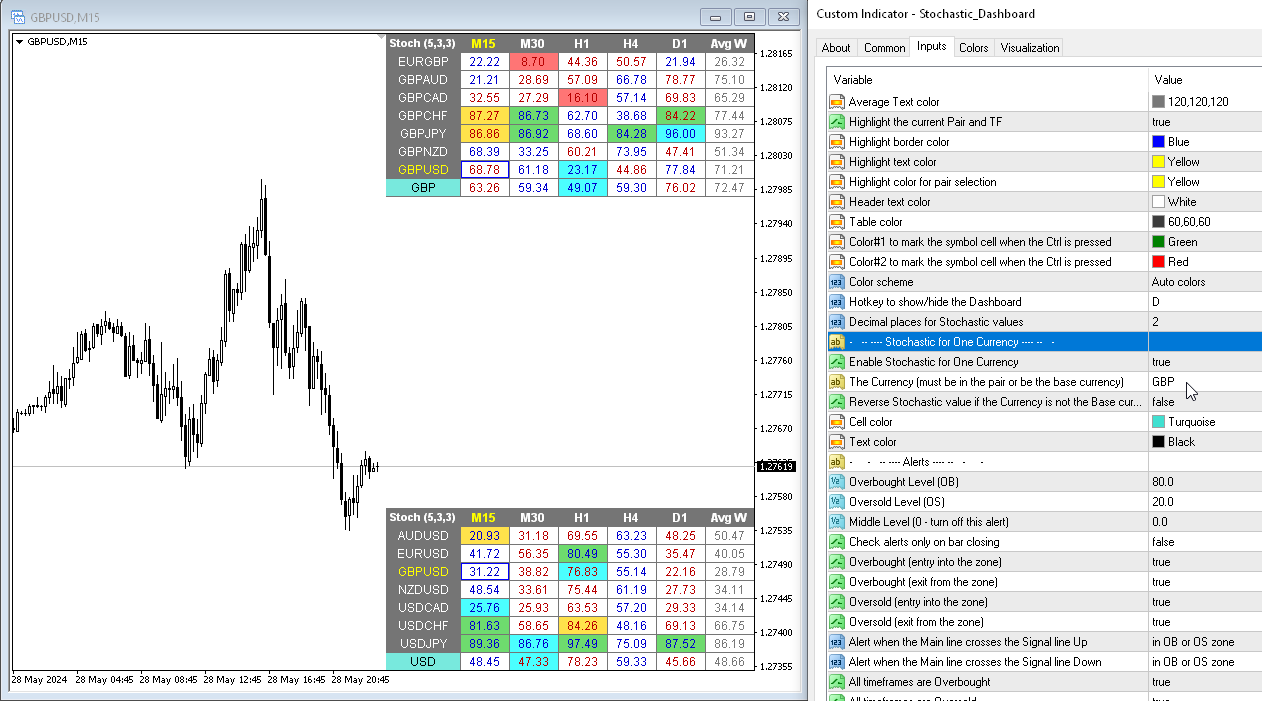
Ähnlich wie der Currency Strength Meter (CSM) kann das Dashboard automatisch Paare auswählen, die eine bestimmte Währung enthalten, oder solche Paare, die diese Währung als Basiswährung haben. Der Indikator sucht in allen Paaren, die im „Set of Pairs“ angegeben sind, nach Währungen; andere Paare werden ignoriert. Und basierend auf diesen Paaren wird der Gesamt-Stochastikwert für diese Währung berechnet. Und Sie können sehen, wie stark oder schwach diese Währung ist.
Der Schlüssel zum Ausblenden des Dashboards aus dem Diagramm ist standardmäßig „D“
Parameter
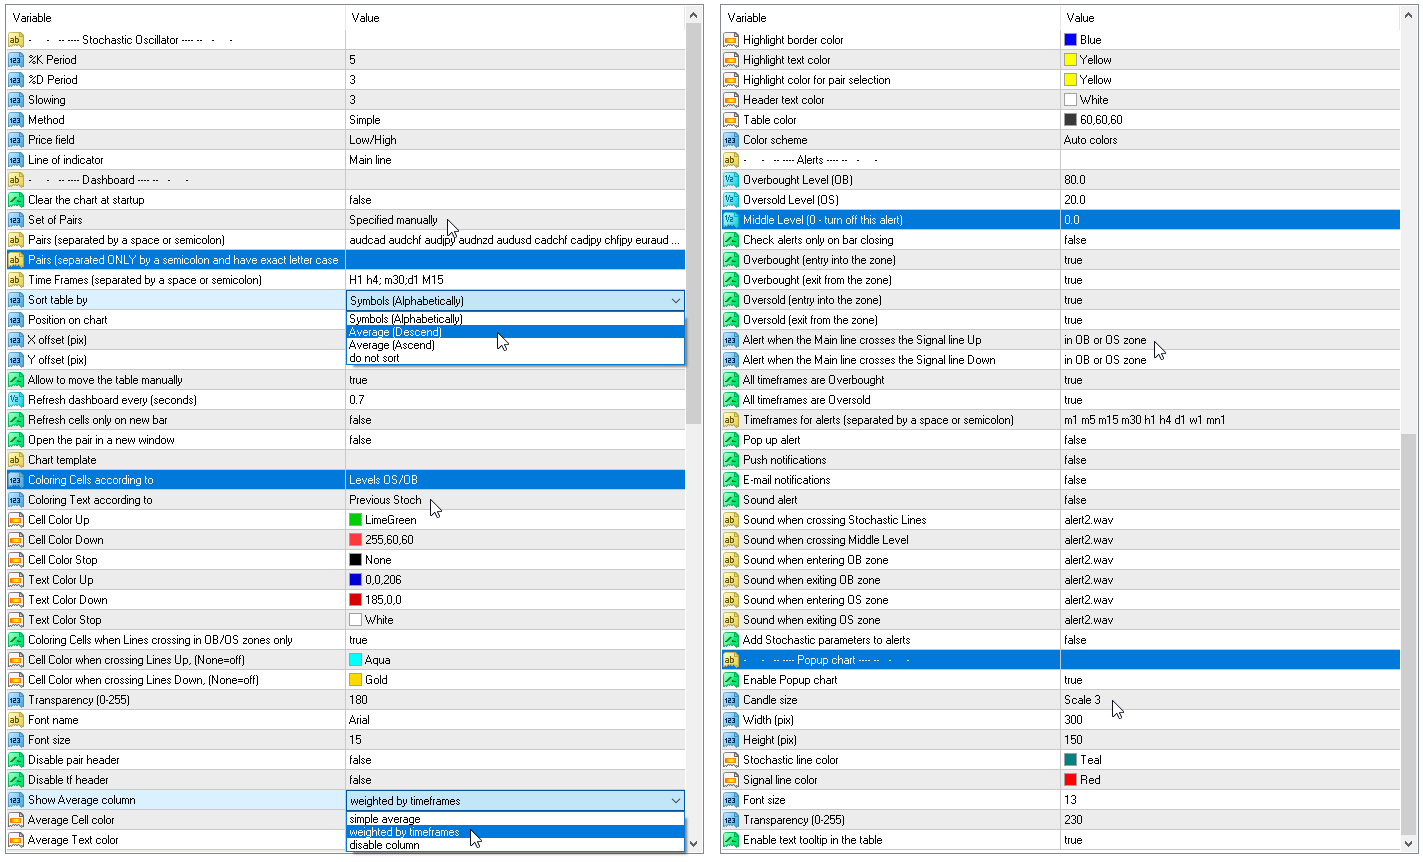
%K Period — die Periode der K-Linie.
%D Period — die Periode der D-Linie.
Slowing — Verlangsamung;
Method — Methode der Mittelwertbildung;
Price field — Preistyp.
Line of indicator — Zeilenindex.
Clear the chart at startup — Diagramm beim Start löschen
Set of Pairs — Symbolsatz:
— Market Watch — Paare aus „Market Watch“ des MT.— Specified manually — — Paare, die manuell in den Parametern „Paare“ angegeben wurden.— Current pair — — nur das aktuelle Paar anzeigen.
Pairs (separated by a space or semicolon) — Liste von Symbolen, die durch Leerzeichen oder Semikolon getrennt sind. Die Währungsnamen sollten genau wie die des Brokers geschrieben werden, Groß- und Kleinschreibung sowie Präfix/Suffix sollten beibehalten werden.
Time Frames (separated by a space or semicolon) — Liste von Zeitrahmen, die durch Leerzeichen oder Semikolon getrennt sind (mehrere Zeitrahmen).
Sort pairs — Liste von Paaren sortieren.
Position on chart — Ecke, in der das Panel auf dem Diagramm angezeigt wird.
X offset (pix) — Panel entlang der X-Achse verschieben;
Y offset (pix) — Panel entlang der Y-Achse verschieben;
Refresh dashboard every (seconds) — Aktualisierungszeitraum für alle Paare und Zeitrahmen.
Open the pair in a new window — durch Klicken ein Symbol in einem neuen Diagrammfenster öffnen.
Chart template — Name der Vorlage für das Diagramm, wenn das Diagramm in einem neuen Fenster geöffnet wird.
Coloring the cells according to the — Farbe der Tabellenzellen gemäß den überkauften/überverkauften Niveaus oder gemäß der Richtung der vorherigen Kerze.
Check Lines crossing only in OB/OS zones — Schnittpunkte von Linien nur in überkauften/überverkauften Zonen bestimmen.
Farbeinstellungen
Color Up — Zellenfarbe, wenn der Indikator das überkaufte Niveau erhöht oder überschritten hat.
Color Down — Zellenfarbe, wenn der Indikator das überverkaufte Niveau verringert oder überschritten hat.
Color Stop — Zellenfarbe, wenn sich der Indikator nicht ändert.
Color when crossing Lines Up — Zellenfarbe, wenn die Hauptlinie die Signallinie nach oben kreuzt.
Color when crossing Lines Down — Zellenfarbe, wenn die Hauptlinie die Signallinie nach unten kreuzt.
Transparency (0-255) — Transparenz des Panels.
Font name — Schriftname.
Alarme
Overbought level — Überkaufter Level für Alarme.
Oversold level — Überverkaufter Level für Alarme.
Middle Level (0 — turn off this alert) — Überprüfung auf Überschreiten des dritten Levels (nur Alarm). Wenn Null angegeben ist, wird die Überprüfung auf diesen Level deaktiviert.
Check alerts only on bar closing — Alarme nur prüfen, wenn die Bar geschlossen ist.
Overbought/Oversold (entry into the zone) — Alarm senden, wenn die überkaufte oder überverkaufte Zone betreten wird.
Overbought/Oversold (exit from the zone) — Alarm senden, wenn die überkaufte oder überverkaufte Zone verlassen wird.
Main line crosses the Signal line Up — Alarm, wenn die Hauptlinie die Signallinie nach oben kreuzt.
Main line crosses the Signal line Down — Alarm, wenn die Hauptlinie die Signallinie nach unten kreuzt.
All timeframes are Overbought/Oversold — Alarm, wenn alle Zeiträume die überkaufte oder überverkaufte Zone betreten.
Timeframes for alerts (separated by a space or semicolon) — Liste der Zeiträume, für die die Warnung gesendet wird (durch Leerzeichen oder Semikolon getrennt).


Wow, thank you so much. Feeling very happy for your 6.80 update. Thank you for creating a great indicator