Dashboard Stochastic Multicurrency
- Indicadores
- Versión: 7.20
- Actualizado: 12 mayo 2026
- Activaciones: 10

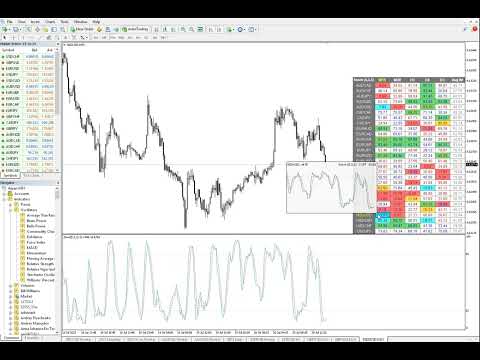
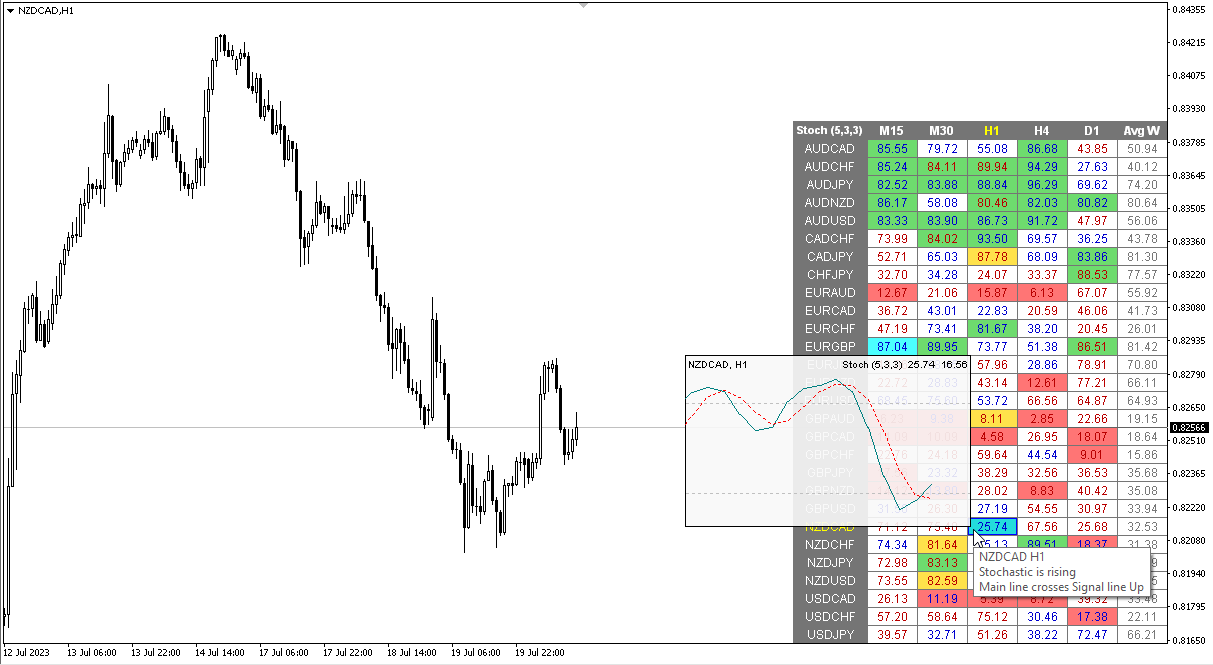
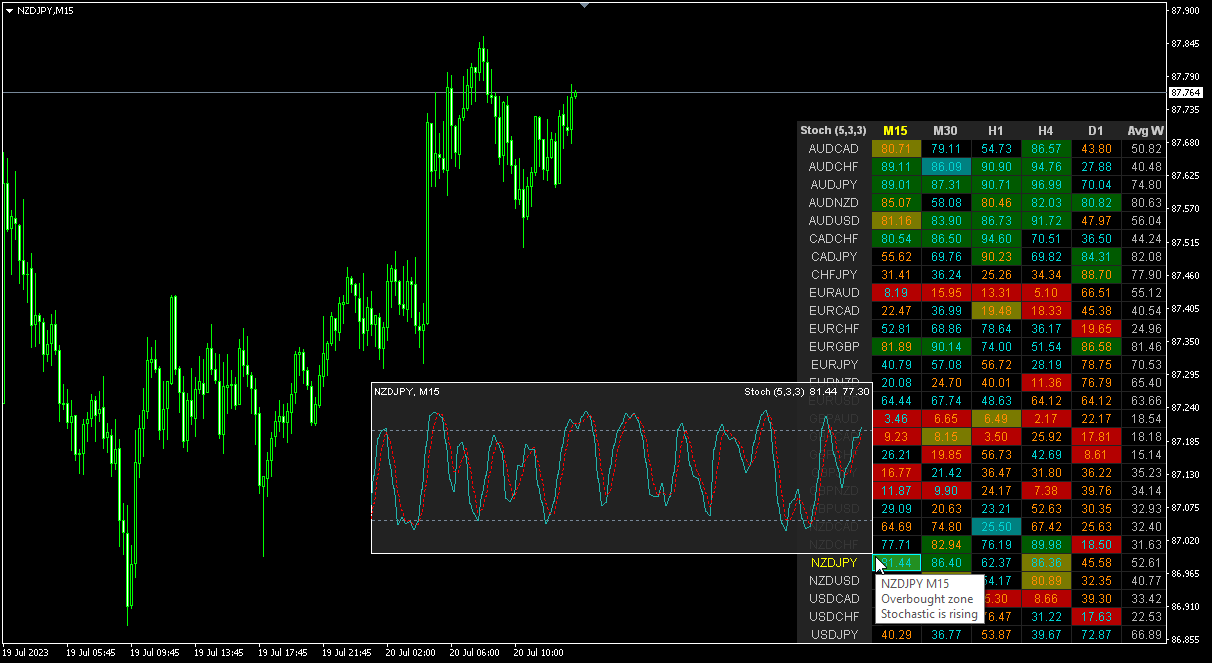
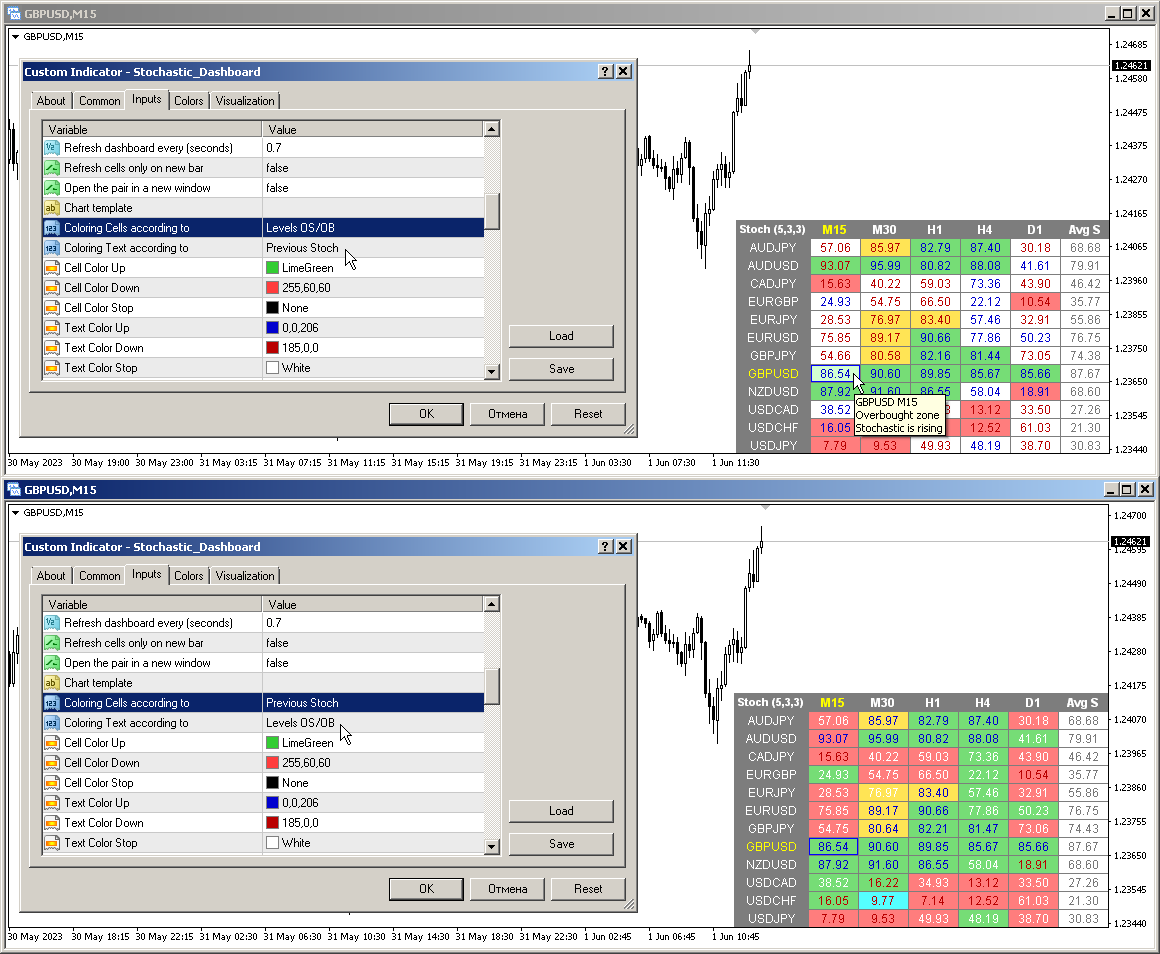
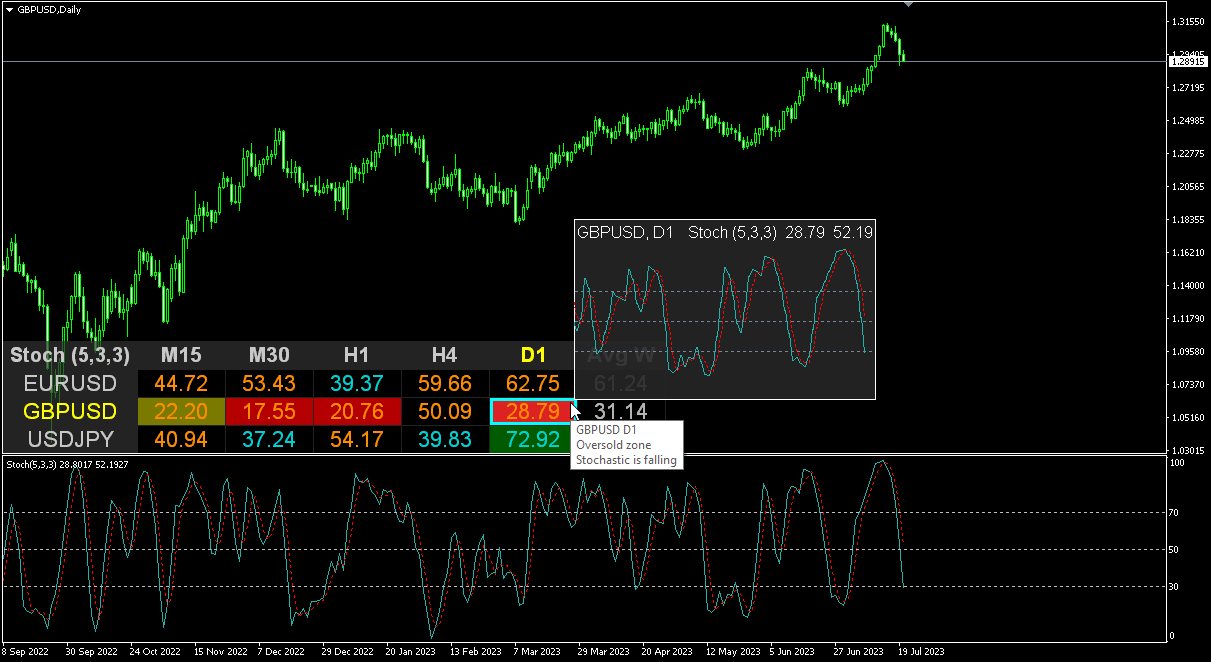
Modificación multidivisa y multitemporal del Oscilador Estocástico. Puede especificar las monedas y plazos que desee en los parámetros. El panel muestra los valores actuales y las intersecciones de las líneas - Señal y Principal (cruce estocástico). Además, el indicador puede enviar notificaciones cuando se cruzan niveles de sobrecompra y sobreventa. Al hacer clic en una celda con un punto, se abrirá este símbolo y punto. Este es el escáner MTF.
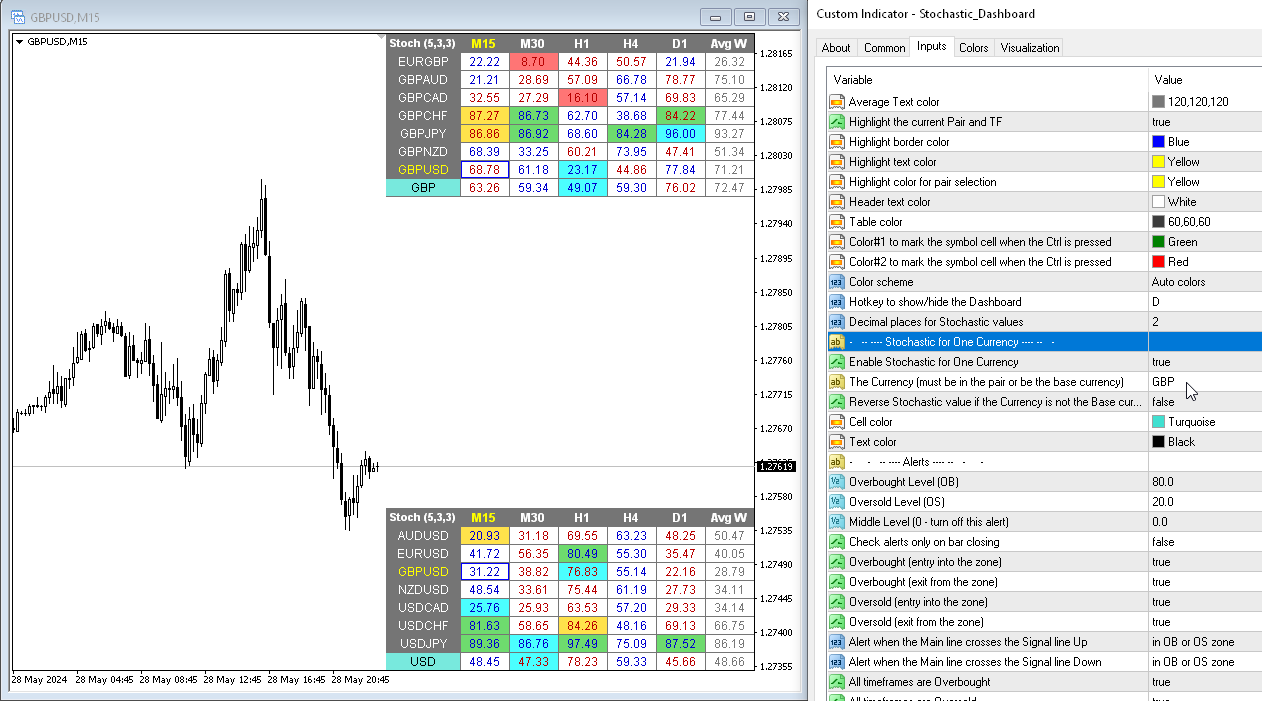
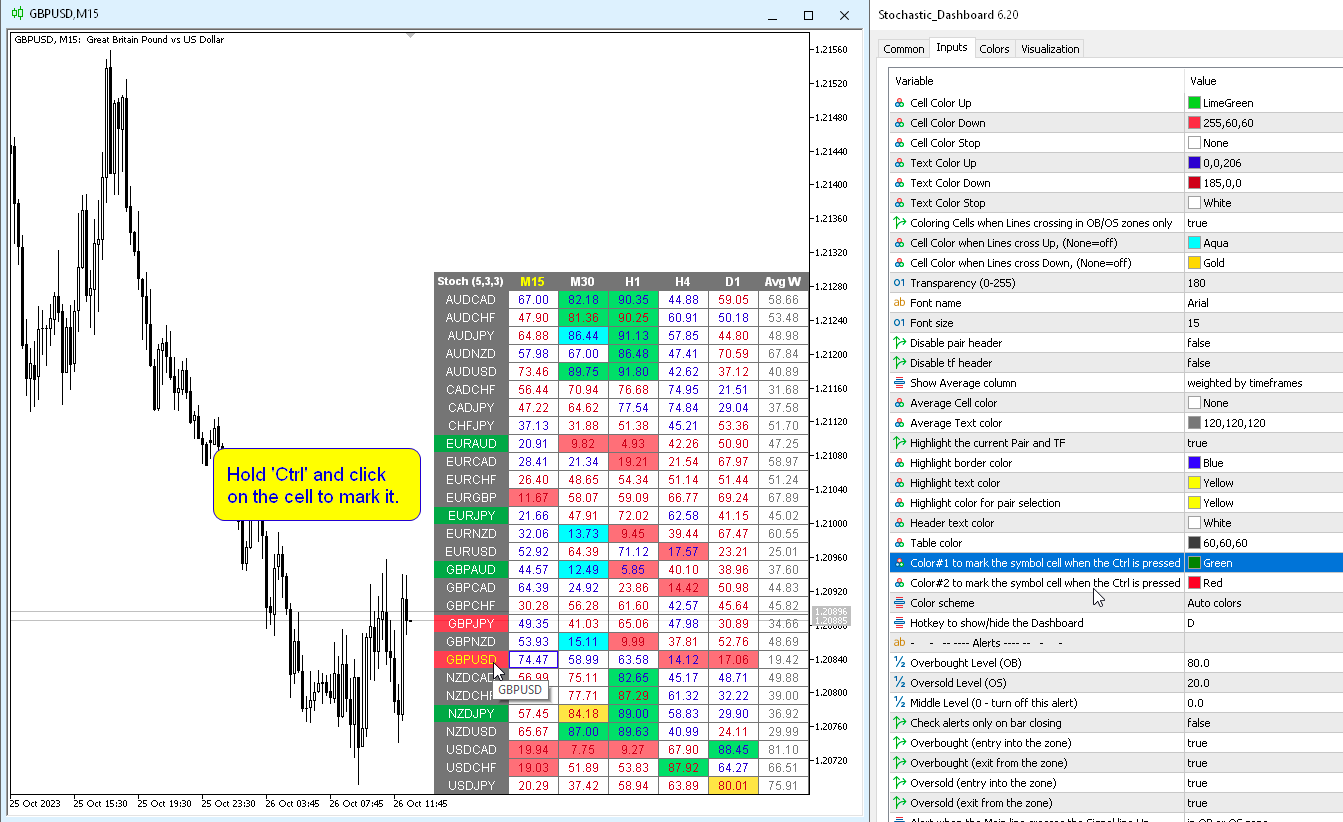
De manera similar al medidor de fortaleza de la moneda, el Panel puede seleccionar automáticamente pares que contengan una moneda específica o aquellos pares que tengan esa moneda como moneda base. El indicador busca Moneda en todos los pares especificados en el “Conjunto de Pares”; otros pares se ignoran. Y en base a estos pares se calcula el estocástico total para esta moneda. Y puedes ver cuán fuerte o débil es esa moneda.
La clave para ocultar el panel del gráfico es "D" de forma predeterminada
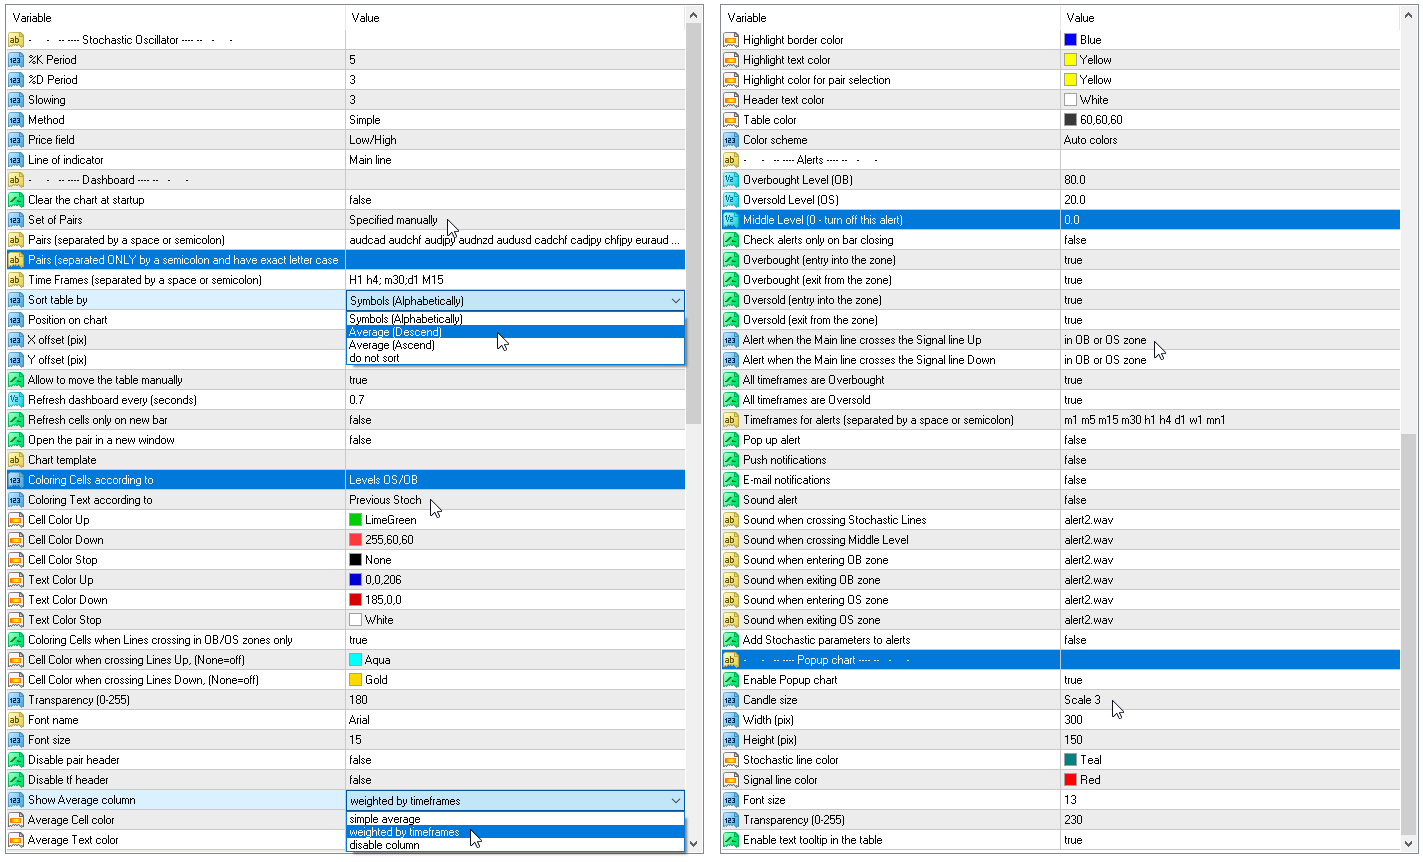
Parámetros
%K Period - el período de la línea K.
%D Period - el período de la línea D.
Slowing – desaceleración;
Method — método de promediar;
Price field - tipo de precio.
Line of indicator — índice de línea.
Clear the chart at startup - borre el gráfico al inicio
Set of Pairs - conjunto de símbolos:
— Market Watch — Pares del "Market Watch" del MT.— Specified manually - pares especificados manualmente, en los parámetros "Pares".— Current pair - muestra solo el par actual.
Pairs (separated by a space or semicolon) - lista de símbolos separados por espacios o punto y coma. Los nombres de las monedas deben escribirse exactamente igual que los del bróker, manteniendo las mayúsculas y minúsculas y el prefijo/sufijo.
Time Frames (separated by a space or semicolon) - lista de períodos de tiempo separados por espacios o punto y coma (marcos de tiempo múltiples).
Sort pairs - ordenar la lista de pares.
Position on chart - esquina para mostrar el panel en el gráfico.
X offset (pix) - desplaza el panel a lo largo del eje X;
Y offset (pix) - desplaza el panel a lo largo del eje Y;
Refresh dashboard every (seconds) - período de actualización para todos los pares y períodos de tiempo.
Open the pair in a new window - abra un símbolo en una nueva ventana del gráfico haciendo clic.
Chart template - el nombre de la plantilla del gráfico, si el gráfico se abre en una ventana nueva.
Coloring the cells according to the - Coloreando las celdas según el color de las celdas de la tabla según los niveles de sobrecompra/sobreventa o según la dirección de la vela anterior.
Check Lines crossing only in OB/OS zones - determine la intersección de las líneas solo en las zonas de sobrecompra/sobreventa.
Configuraciones de color
Color Up - color de la celda si el indicador aumenta o cruza el nivel de sobrecompra.
Color Down - color de la celda si el indicador disminuye o cruza el nivel de sobreventa.
Color Stop - color de la celda si el indicador no cambia.
Color when crossing Lines Up - color de celda cuando la línea principal cruza la línea de señal.
Color when crossing Lines Down - color de celda cuando la línea principal cruza la línea de señal hacia abajo.
Transparency (0-255) — transparencia del panel.
Font name - nombre de fuente.
Alertas
Overbought level - nivel de sobrecompra para alertas.
Oversold level - nivel de sobreventa para alertas.
Middle Level (0 — turn off this alert) - verificación del tercer cruce a nivel (solo alerta). Si se especifica cero, la verificación de este nivel está deshabilitada.
Check alerts only on bar closing - verifique las alertas solo cuando el bar esté cerrado.
Overbought/Oversold (entry into the zone) - envía una alerta al ingresar a la zona de sobrecompra o sobreventa.
Overbought/Oversold (exit from the zone) - envía una alerta al salir de la zona de sobrecompra o sobreventa.
Main line crosses the Signal line Up - alerta cuando la línea principal cruza la línea de señal hacia arriba.
Main line crosses the Signal line Down - alerta cuando la línea principal cruza la línea de señal hacia abajo.
All timeframes are Overbought/Oversold - alerta cuando todos los períodos ingresan a la zona de sobrecompra o sobreventa.
Timeframes for alerts (separated by a space or semicolon) - lista de períodos durante los cuales se enviará la alerta (separados por un espacio o punto y coma).


Wow, thank you so much. Feeling very happy for your 6.80 update. Thank you for creating a great indicator