Dashboard Stochastic Multicurrency
- Indicateurs
- Version: 7.20
- Mise à jour: 12 mai 2026
- Activations: 10

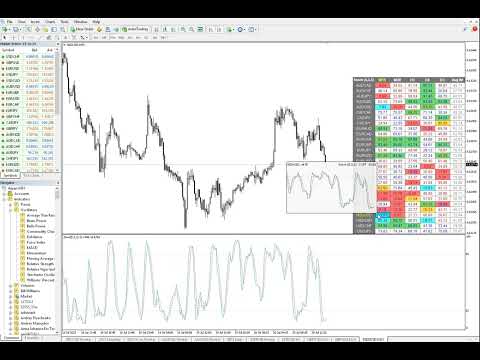
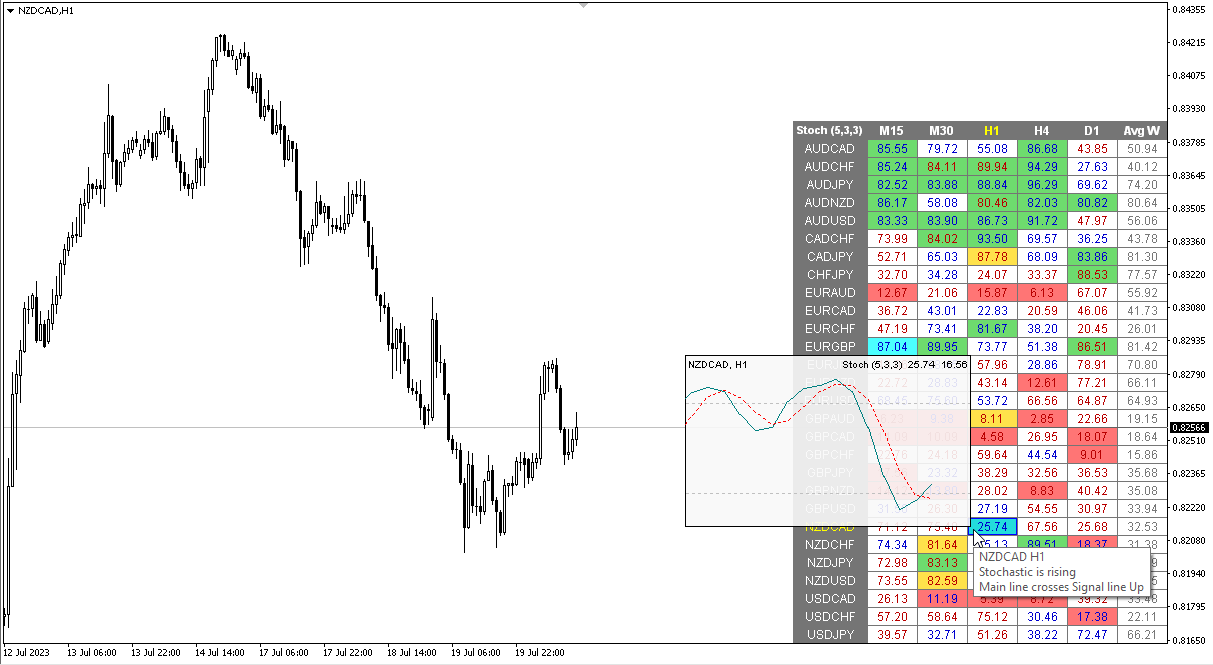
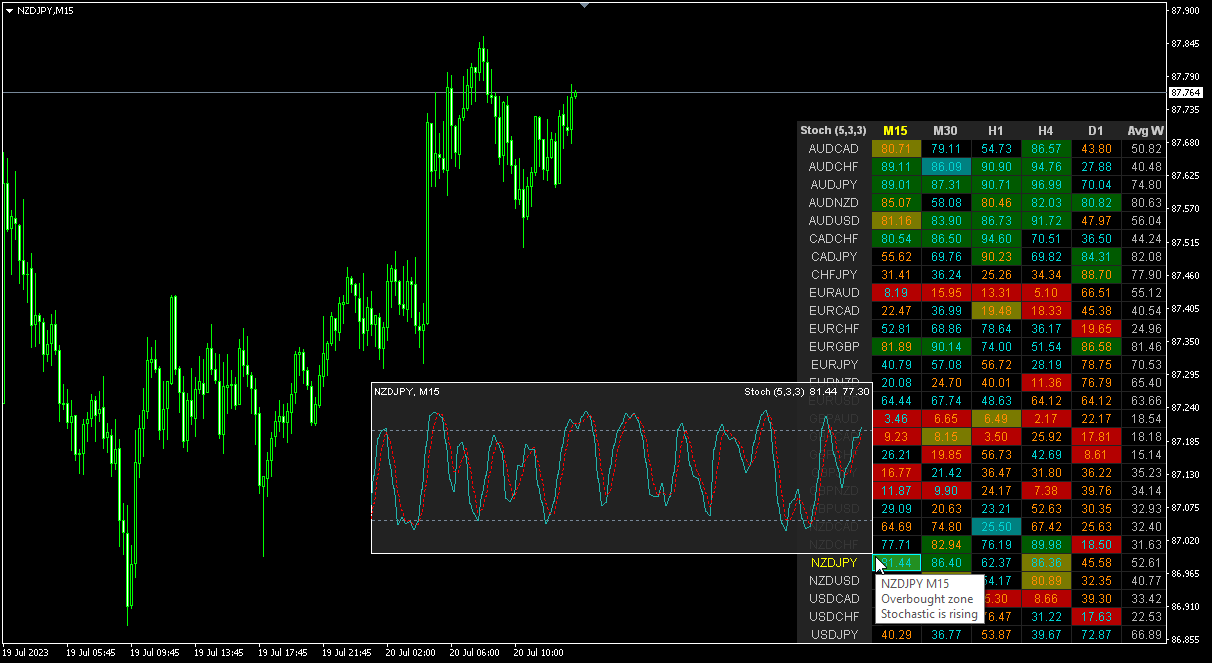
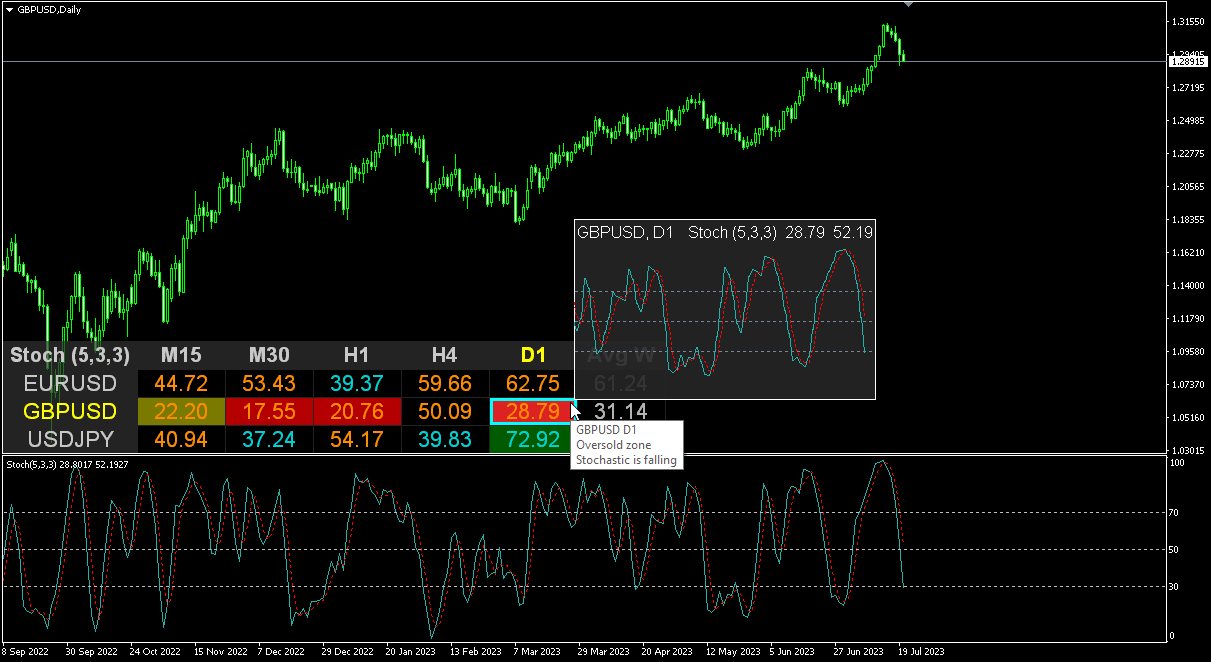
Modification multidevises et multitemporelles de l'oscillateur stochastique. Vous pouvez spécifier les devises et les délais souhaités dans les paramètres. Le panneau affiche les valeurs actuelles et les intersections des lignes — Signal et Principal (croisement stochastique). En outre, l'indicateur peut envoyer des notifications lors du franchissement des niveaux de surachat et de survente. En cliquant sur une cellule avec un point, ce symbole et ce point seront ouverts. Il s'agit du scanner MTF.
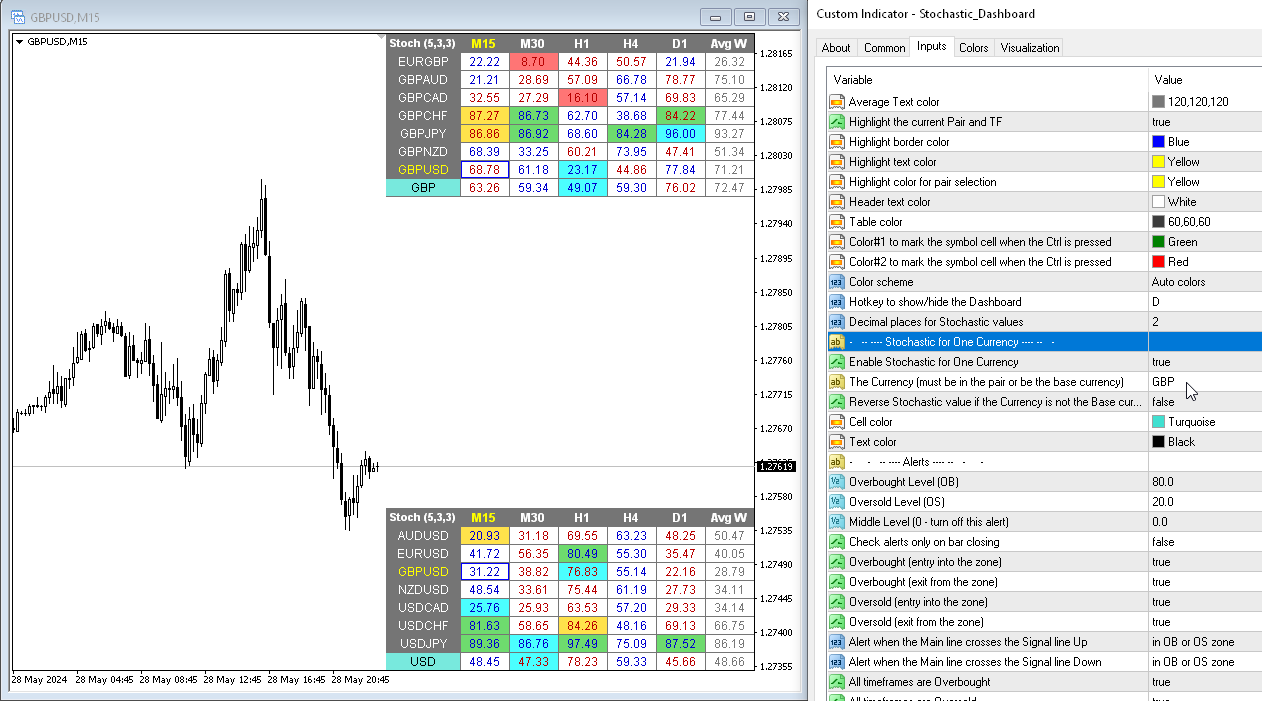
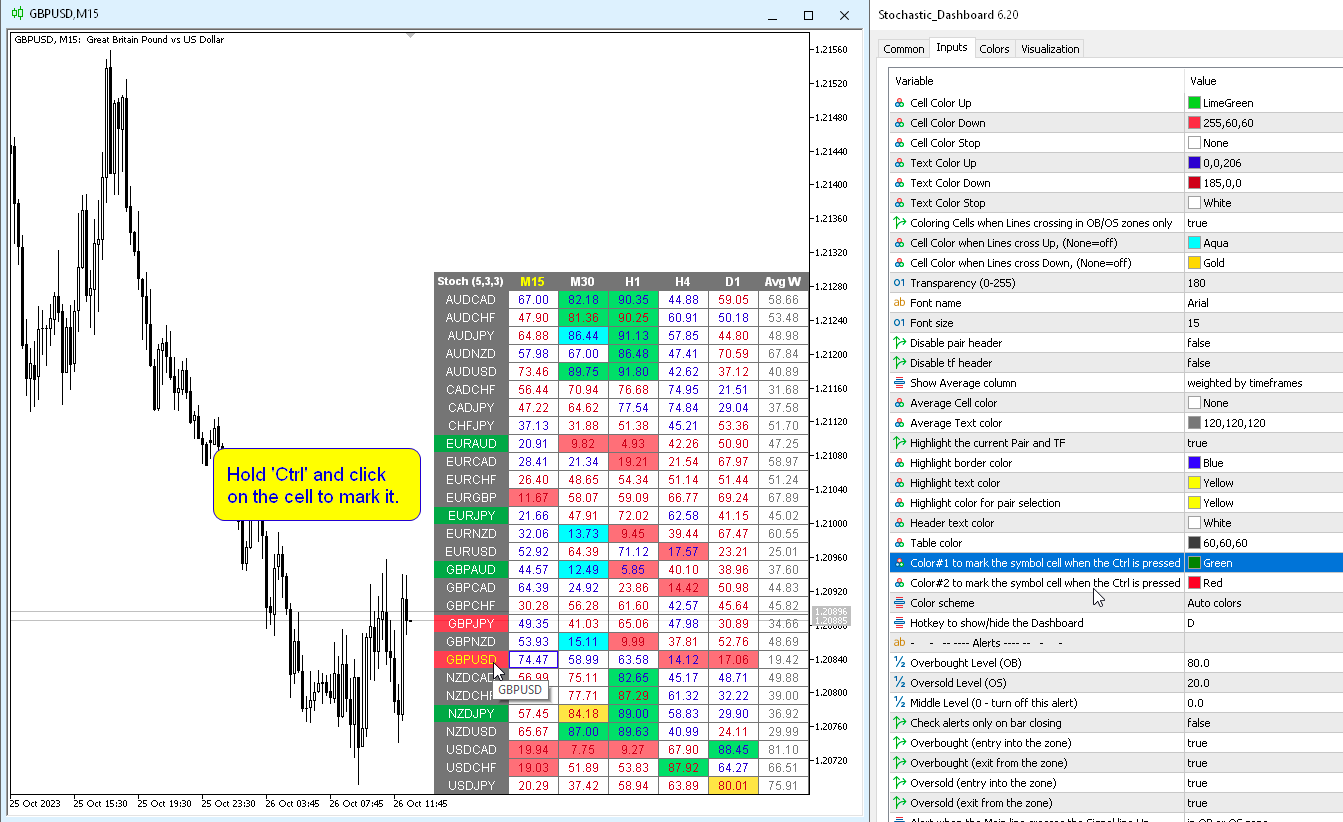
Semblable au Currency Strength Meter (CSM), le tableau de bord peut sélectionner automatiquement les paires qui contiennent une devise spécifiée, ou les paires qui ont cette devise comme devise de base. L'indicateur recherche la devise dans toutes les paires spécifiées dans « Ensemble de paires » ; les autres paires sont ignorées. Et sur la base de ces paires, le stochastique total pour cette devise est calculé. Et vous pouvez voir à quel point cette monnaie est forte ou faible.
La clé pour masquer le tableau de bord du graphique est "D" par défaut
Paramètres
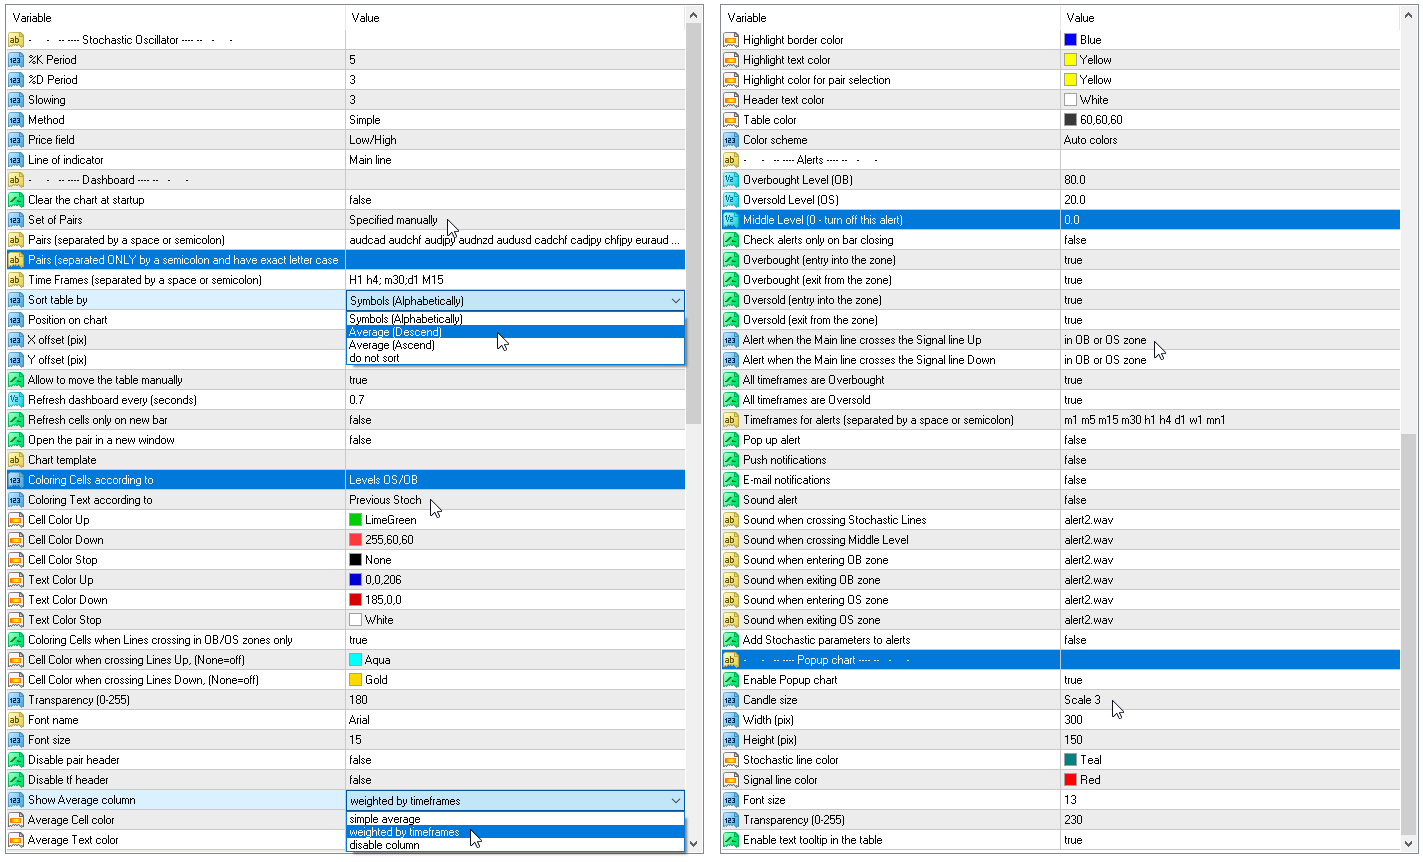
%K Period — la période de la ligne K.
%D Period — la période de la ligne D.
Slowing — ralentissement;
Method — méthode de calcul de la moyenne;
Price field — type de prix.
Line of indicator — indice de ligne.
Clear the chart at startup — effacez le graphique au démarrage
Set of Pairs — ensemble de symboles :
— Market Watch — Paires de "Market Watch" du MT.— Specified manually — paires spécifiées manuellement, dans les paramètres "Paires".— Current pair — affiche uniquement la paire actuelle.
Pairs (separated by a space or semicolon) — liste de symboles séparés par des espaces ou des points-virgules. Les noms des devises doivent être écrits exactement comme ceux du courtier, en conservant la casse et le préfixe/suffixe.
Time Frames (separated by a space or semicolon) — liste de délais séparés par des espaces ou des points-virgules (multi-périodes).
Sort pairs — trier la liste des paires.
Position on chart — coin pour afficher le panneau sur la carte.
X offset (pix) — décale le panneau le long de l'axe X ;
Y offset (pix) — décale le panneau le long de l'axe Y ;
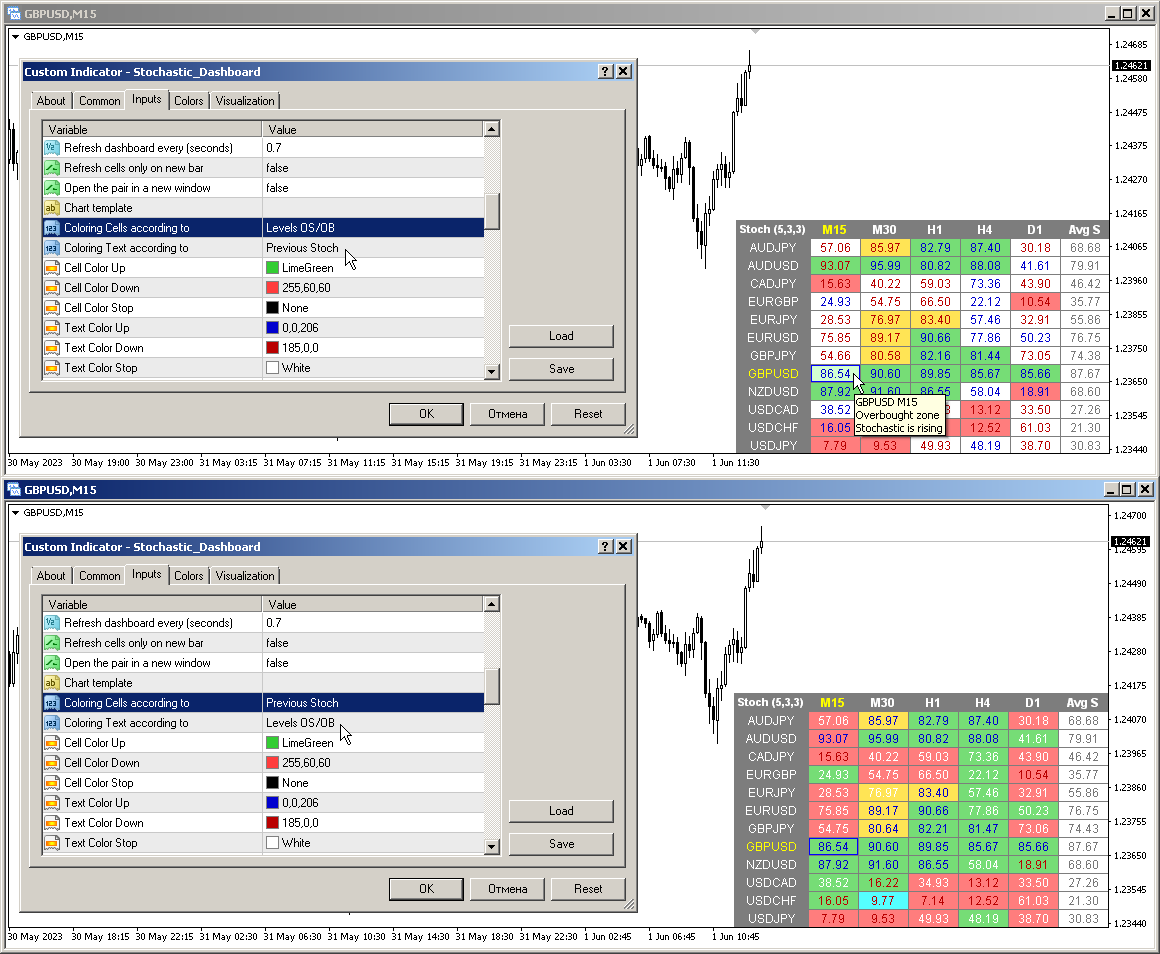
Refresh dashboard every (seconds) — période de mise à jour pour toutes les paires et toutes les périodes.
Open the pair in a new window — ouvrez un symbole dans une nouvelle fenêtre graphique en cliquant.
Chart template — nom du modèle du graphique, si le graphique s'ouvre dans une nouvelle fenêtre.
Coloring the cells according to the — couleur des cellules du tableau selon les niveaux de surachat/survente ou selon la direction de la bougie précédente.
Check Lines crossing only in OB/OS zones — déterminez l'intersection des lignes uniquement dans les zones de surachat/survente.
Paramètres de couleur
Color Up — couleur de la cellule si l'indicateur augmente ou dépasse le niveau de surachat.
Color Down — couleur de la cellule si l'indicateur diminue ou dépasse le niveau de survente.
Color Stop — couleur des cellules si l’indicateur ne change pas.
Color when crossing Lines Up — couleur de la cellule lorsque la ligne principale traverse la ligne de signal.
Color when crossing Lines Down — couleur de la cellule lorsque la ligne principale traverse la ligne de signal vers le bas.
Transparency (0-255) — transparence du panneau.
Font name — nom de la police.
Alertes
Overbought level — niveau de surachat pour les alertes.
Oversold level — niveau de survente pour les alertes.
Middle Level (0 — turn off this alert) — contrôle du troisième passage à niveau (alerte uniquement). Si zéro est spécifié, la vérification de ce niveau est désactivée.
Check alerts only on bar closing — vérifiez les alertes uniquement lorsque le bar est fermé.
Overbought/Oversold (entry into the zone) — envoie une alerte lorsque vous entrez dans la zone de surachat ou de survente.
Overbought/Oversold (exit from the zone) — envoie une alerte lorsque vous quittez la zone de surachat ou de survente.
Main line crosses the Signal line Up — alerte lorsque la ligne principale traverse la ligne de signal.
Main line crosses the Signal line Down — alerte lorsque la ligne principale traverse la ligne de signal vers le bas.
All timeframes are Overbought/Oversold — alerte lorsque toutes les périodes entrent dans la zone de surachat ou de survente.
Timeframes for alerts (separated by a space or semicolon) — liste des périodes pour lesquelles l'alerte sera envoyée (séparées par un espace ou un point-virgule).


Wow, thank you so much. Feeling very happy for your 6.80 update. Thank you for creating a great indicator