Dashboard Stochastic Multicurrency
- インディケータ
- バージョン: 7.20
- アップデート済み: 12 5月 2026
- アクティベーション: 10

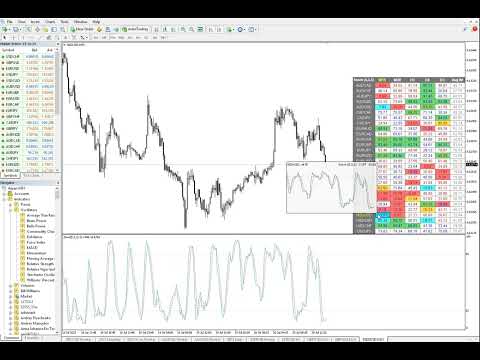
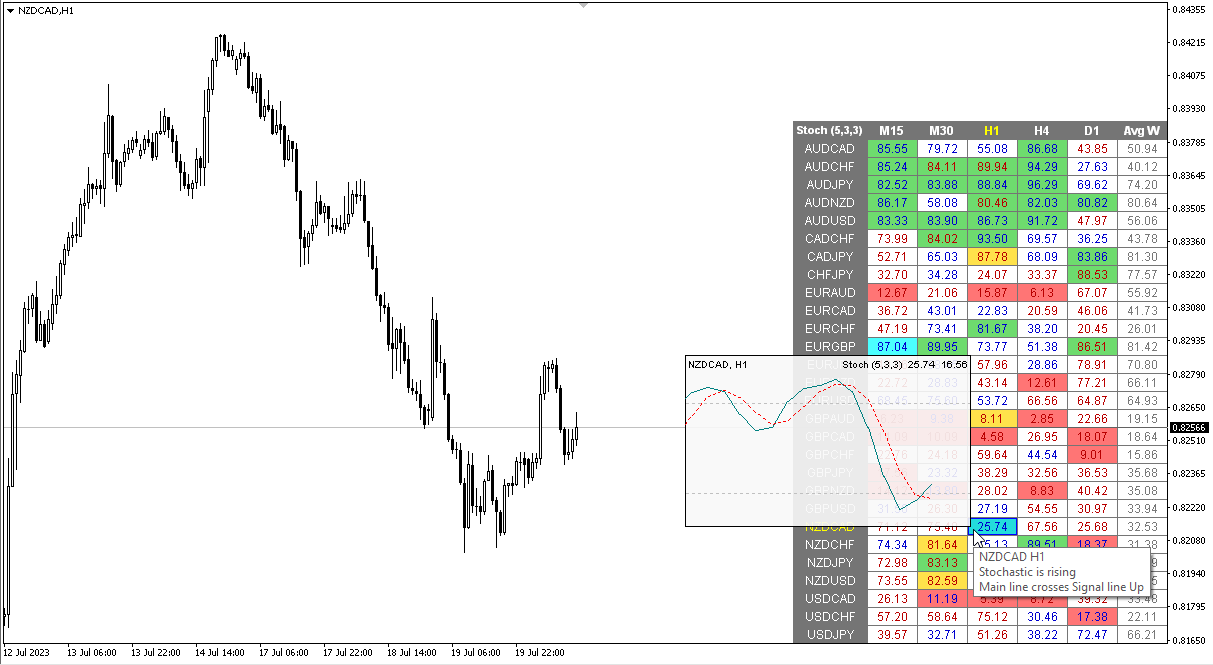
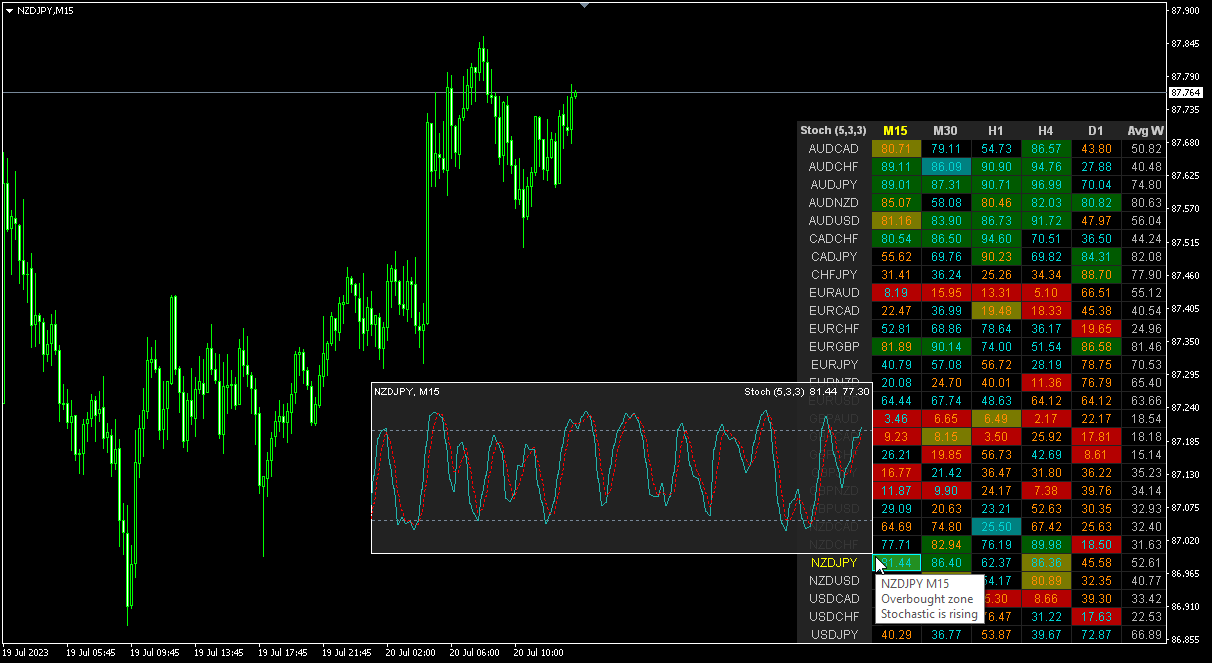
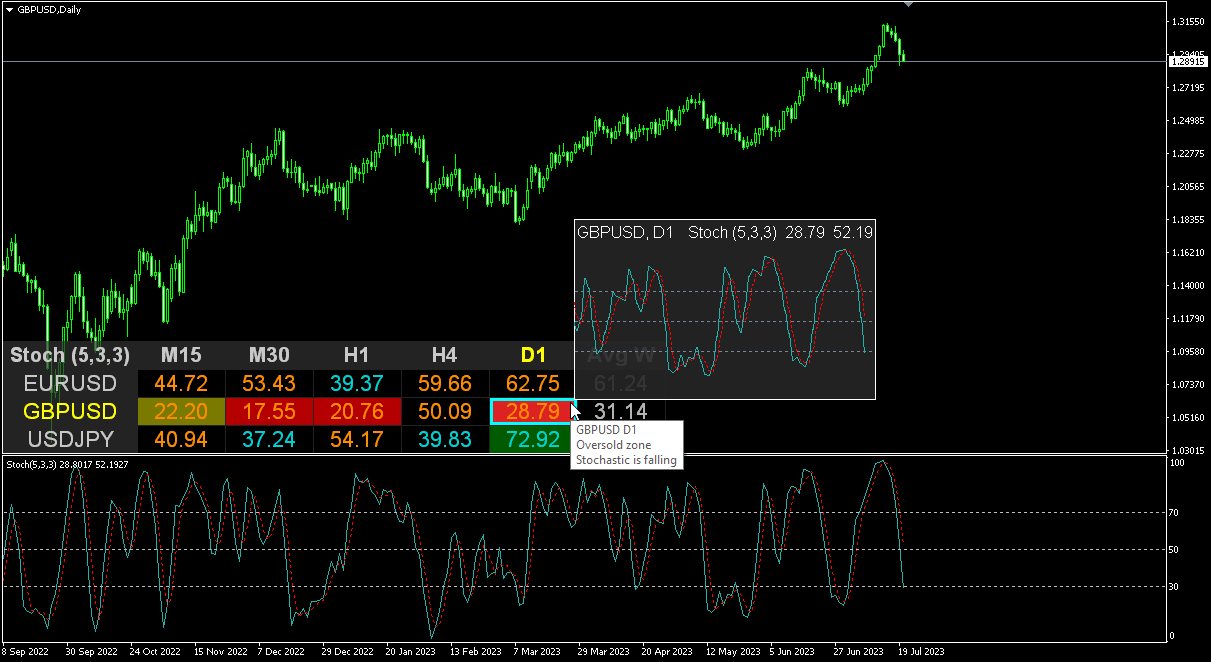
ストキャスティクス オシレーターのマルチ通貨およびマルチタイムフレームの変更。パラメータで任意の通貨とタイムフレームを指定できます。パネルには、シグナルとメイン (ストキャスティクス クロスオーバー) のラインの現在の値と交差点が表示されます。また、インジケーターは、買われすぎレベルと売られすぎレベルを横切るときに通知を送信できます。ピリオド付きのセルをクリックすると、このシンボルとピリオドが開きます。これが MTF スキャナーです。
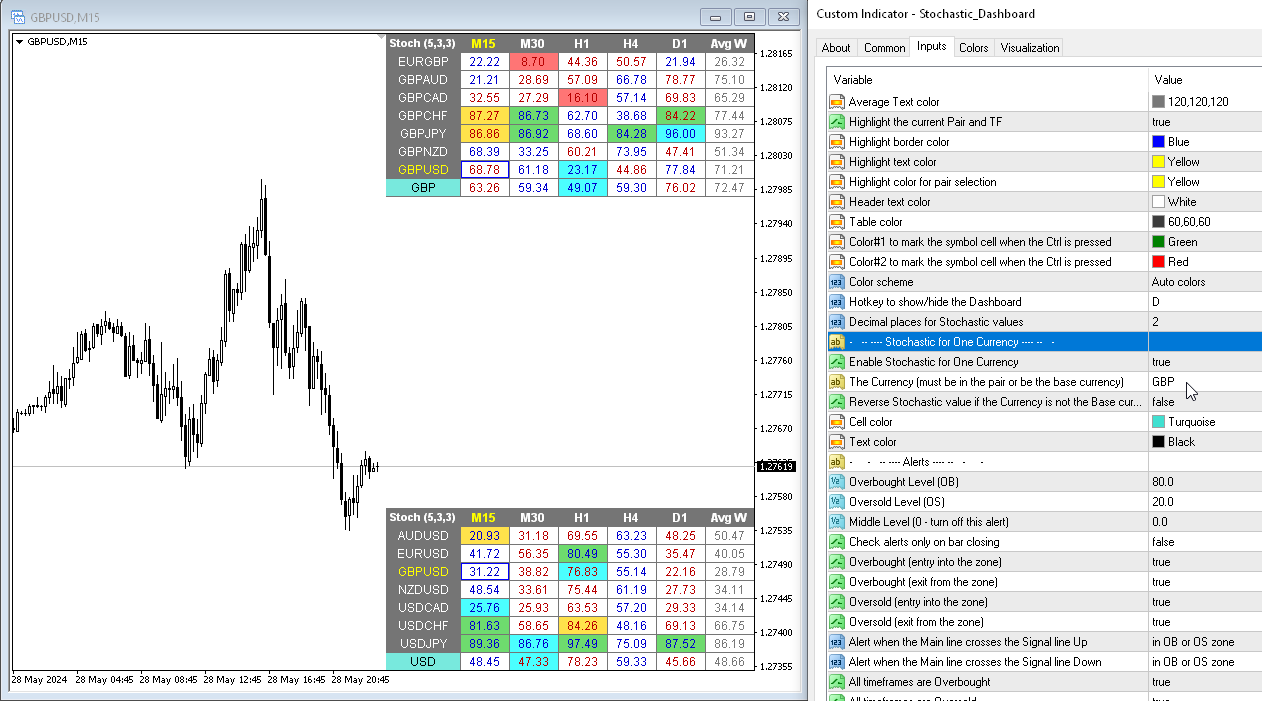
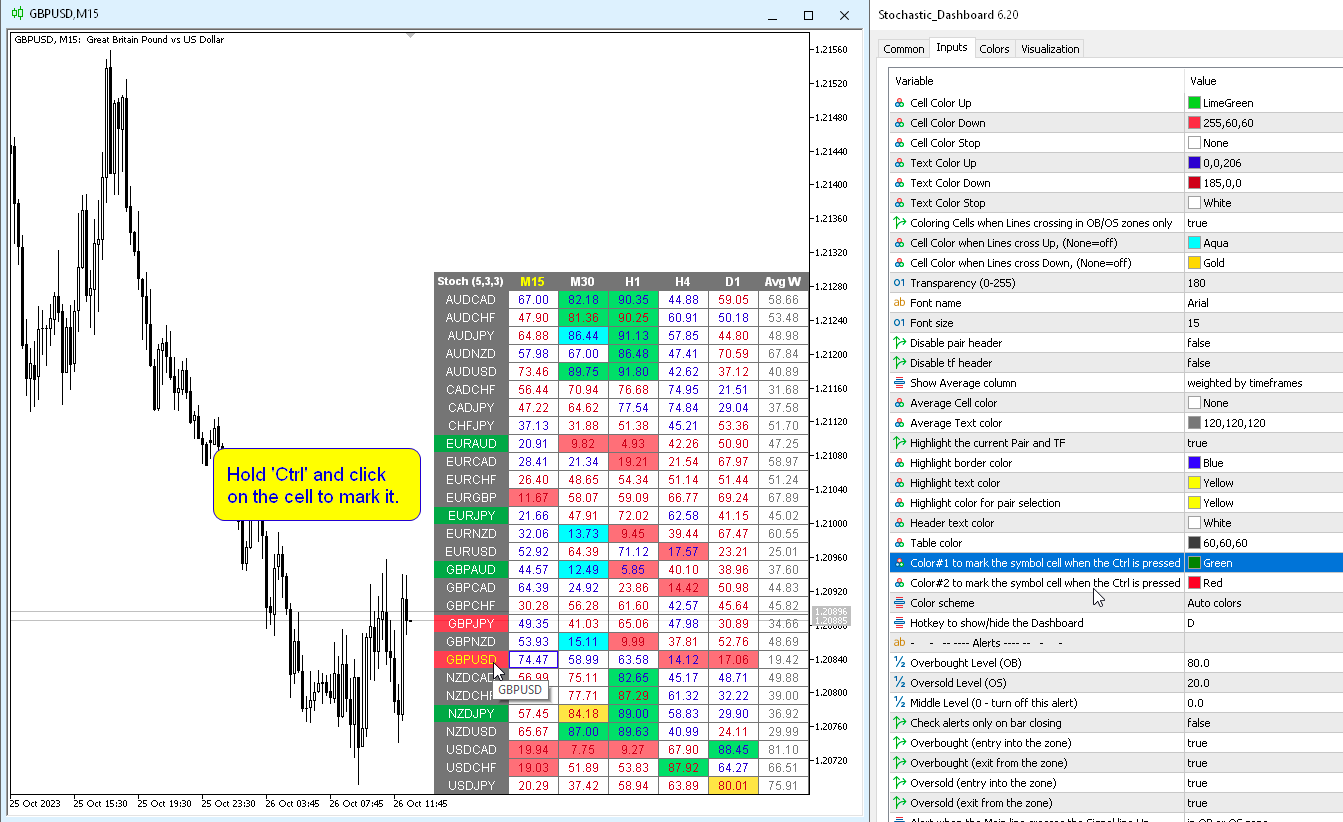
通貨強度メーター (CSM) と同様に、ダッシュボードは、指定された通貨を含むペア、またはその通貨を基本通貨とするペアを自動的に選択できます。インジケーターは、「ペアのセット」で指定されたすべてのペアで通貨を検索します。他のペアは無視されます。これらのペアに基づいて、この通貨の合計ストキャスティクスが計算されます。そして、その通貨がどれだけ強いか弱いかを確認できます。
ダッシュボードをチャートから非表示にするキーは、デフォルトでは「D」です
パラメータ
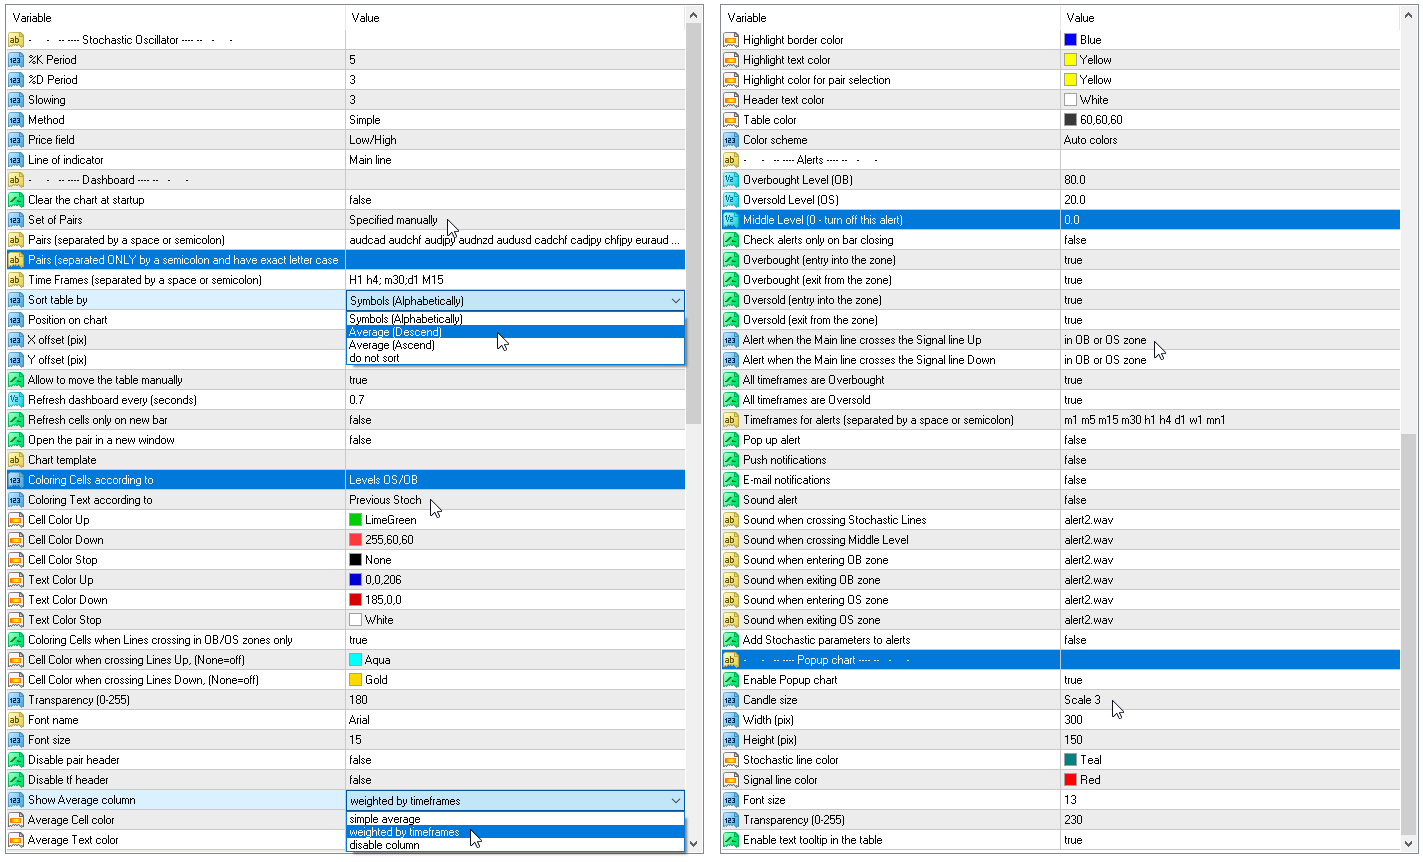
%K Period — K ラインの期間。
%D Period — D ラインの期間。
Slowing — スローダウン。
Method — 平均化の方法。
Price field — 価格の種類。
Line of indicator — ラインのインデックス。
Clear the chart at startup — 起動時にチャートをクリアします
Set of Pairs — シンボルのセット:
— Market Watch — MTの「マーケットウォッチ」からのペア。— Specified manually — パラメータ「ペア」で手動で指定されたペア。— Current pair — 現在のペアのみを表示します。
Pairs (separated by a space or semicolon) — スペースまたはセミコロンで区切ったシンボルのリスト。通貨名はブローカーのものとまったく同じように記述し、大文字と小文字、および接頭辞/接尾辞を維持する必要があります。
Time Frames (separated by a space or semicolon) — スペースまたはセミコロンで区切った時間枠のリスト (複数の時間枠)。
Sort pairs — ペアのリストを並べ替えます。
Position on chart — チャートにパネルを表示するコーナー。
X offset (pix) — X 軸に沿ってパネルをシフトします。
Y offset (pix) — Y 軸に沿ってパネルをシフトします。
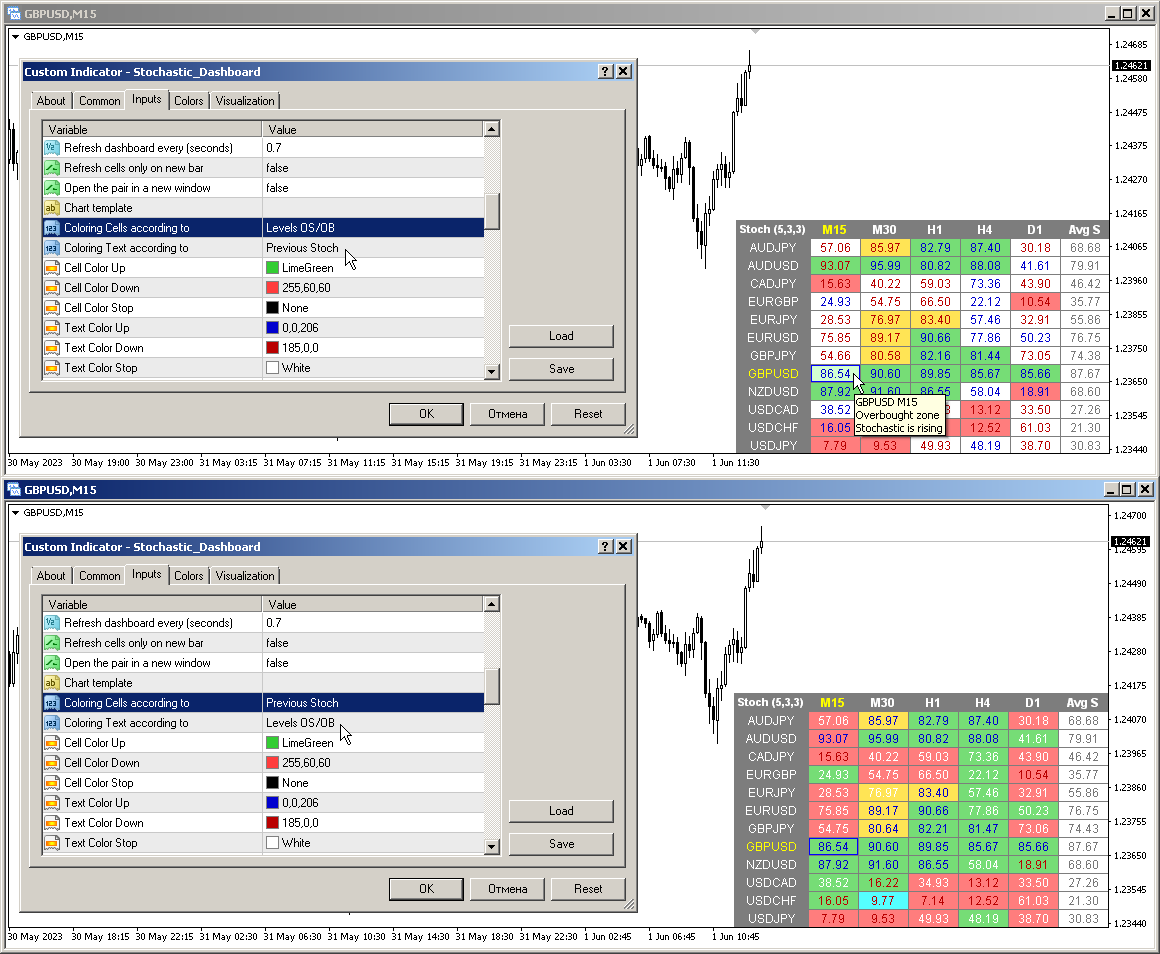
Refresh dashboard every (seconds) — すべてのペアと時間枠の期間を更新します。
Open the pair in a new window — クリックして新しいチャート ウィンドウでシンボルを開きます。
Chart template — チャートが新しいウィンドウで開く場合のチャートのテンプレートの名前。
Coloring the cells according to the — 買われすぎ / 売られすぎレベルまたは前のローソク足の方向に応じてテーブル セルの色を決定します。
Check Lines crossing only in OB/OS zones — 買われすぎ / 売られすぎゾーンでのみラインの交差を決定します。
色の設定
Color Up — インジケーターが上昇または買われすぎレベルを超えた場合のセルの色。
Color Down — インジケーターが下降または売られすぎレベルを超えた場合のセルの色。
Color Stop — インジケーターが変化しない場合のセルの色。
Color when crossing Lines Up — メイン ラインがシグナル ラインを上向きに交差するときのセルの色。
Color when crossing Lines Down — メイン ラインがシグナル ラインを下向きに交差するときのセルの色。
Transparency (0-255) — — パネルの透明度。
Font name — フォント名。
アラート
Overbought level — アラートの買われすぎレベル。
Oversold level — アラートの売られすぎレベル。
Middle Level (0 — turn off this alert) — 3 番目のレベルの交差チェック (アラートのみ)。ゼロを指定すると、このレベルのチェックは無効になります。
Check alerts only on bar closing — バーがクローズされたときにのみアラートをチェックします。
Overbought/Oversold (entry into the zone) — 買われすぎまたは売られすぎゾーンに入るときにアラートを送信します。
Overbought/Oversold (exit from the zone) — 買われすぎまたは売られすぎゾーンから出るときにアラートを送信します。
Main line crosses the Signal line Up — メイン ラインがシグナル ラインを上向きに交差するとアラートを送信します。
Main line crosses the Signal line Down — メイン ラインがシグナル ラインを下向きに交差するとアラートを送信します。
All timeframes are Overbought/Oversold — すべての期間が買われすぎまたは売られすぎゾーンに入るときにアラートを送信します。
Timeframes for alerts (separated by a space or semicolon) — アラートが送信される期間のリスト (スペースまたはセミコロンで区切る)。


Wow, thank you so much. Feeling very happy for your 6.80 update. Thank you for creating a great indicator