Dashboard Stochastic Multicurrency
- Göstergeler
- Sürüm: 7.20
- Güncellendi: 12 Mayıs 2026
- Etkinleştirmeler: 10

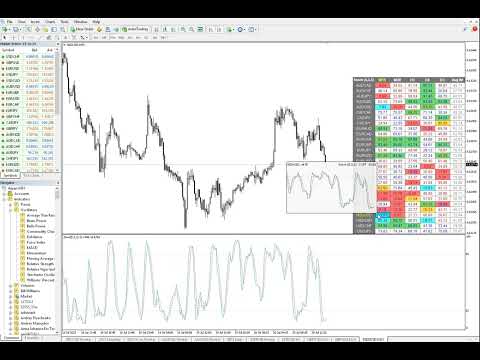
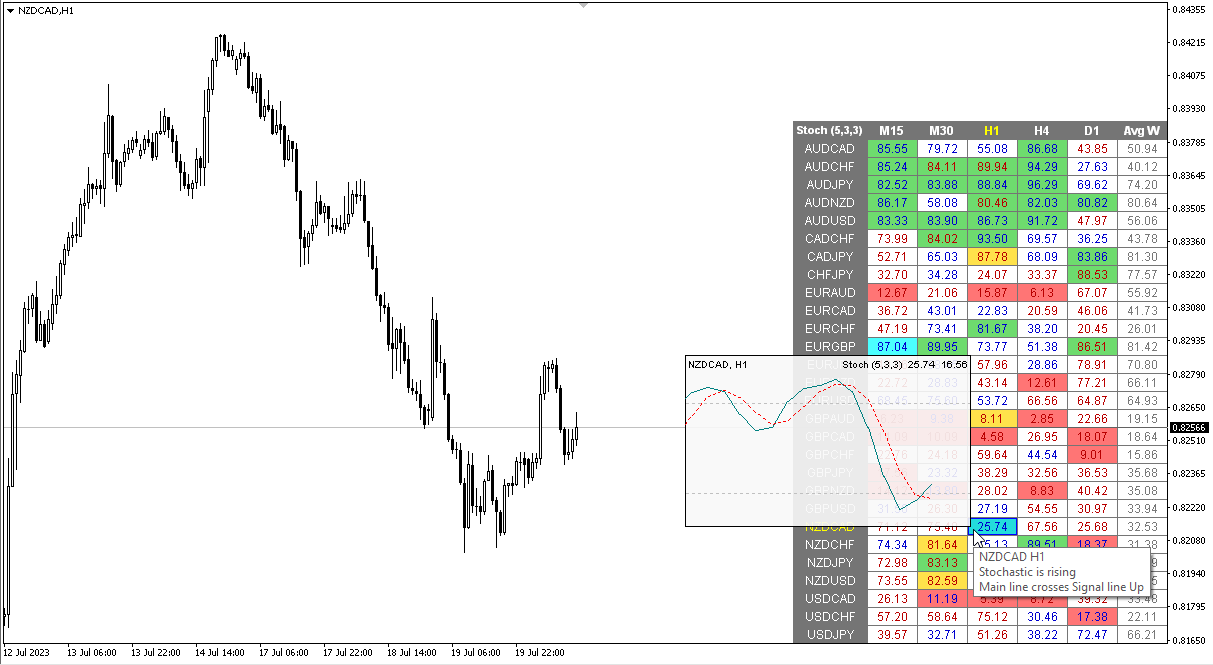
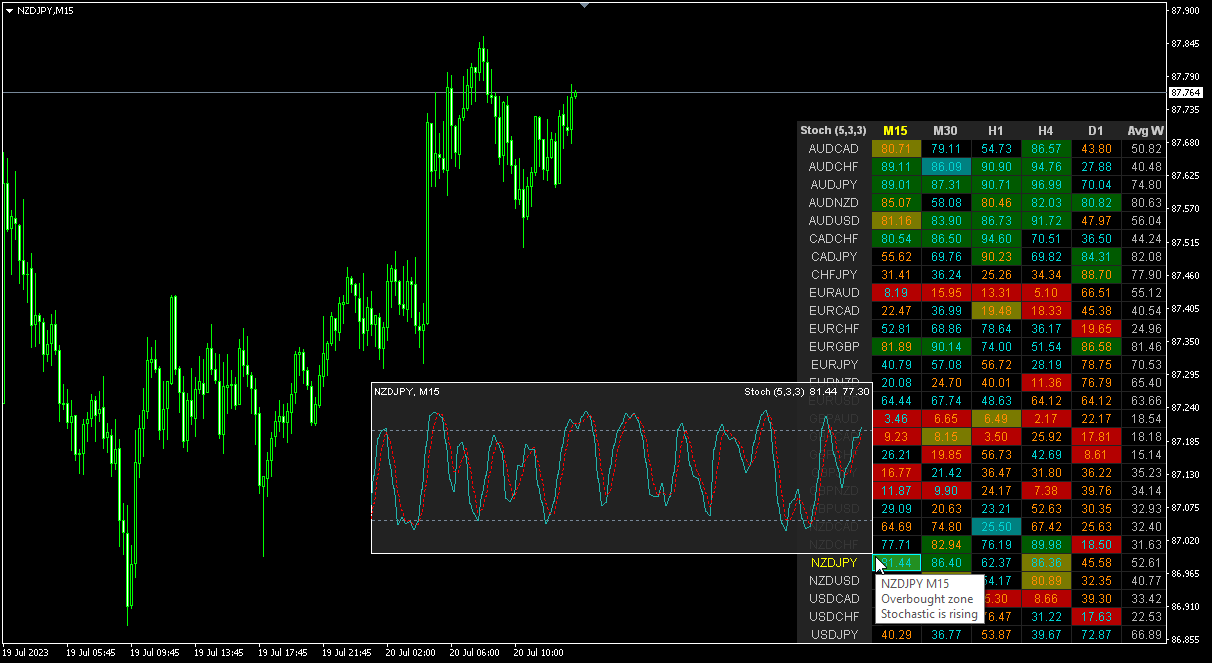
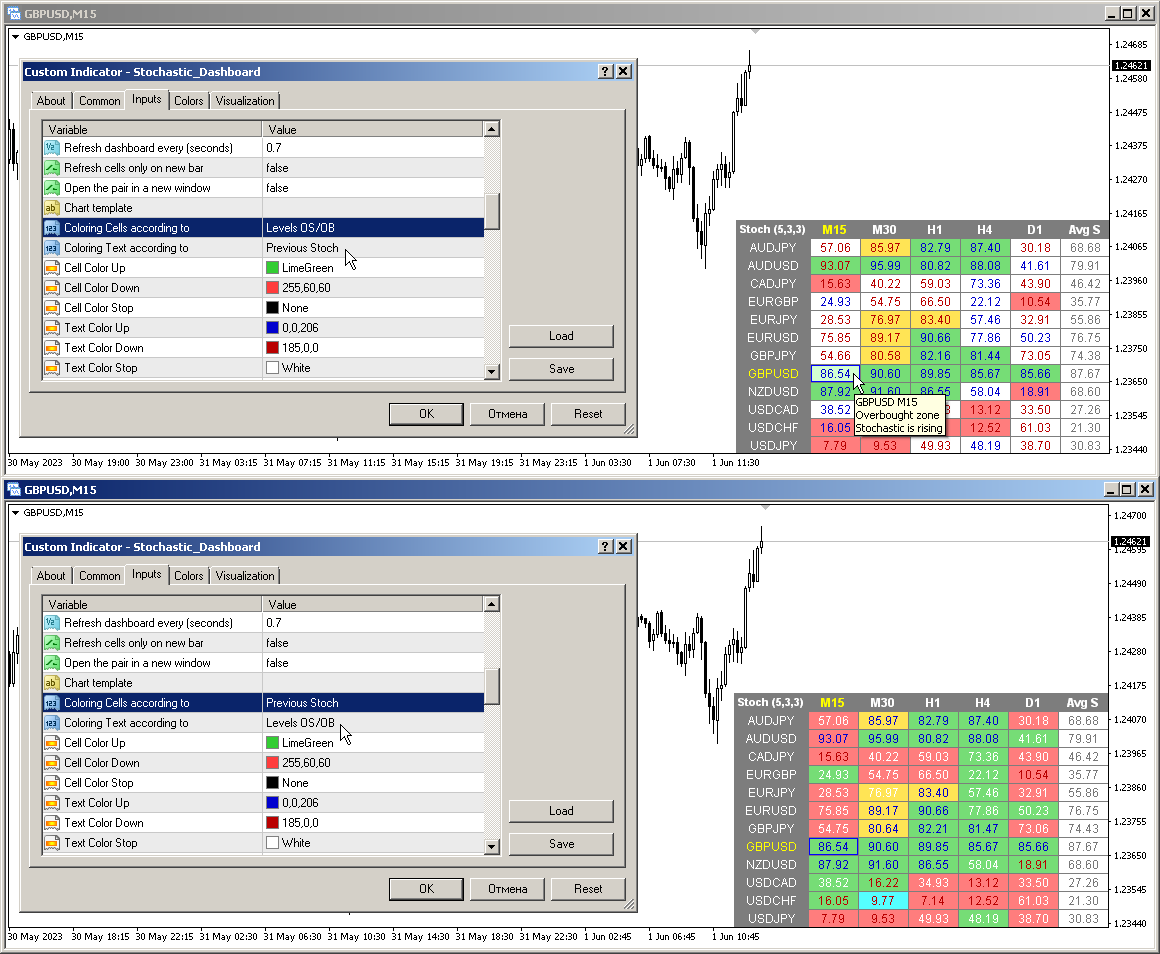
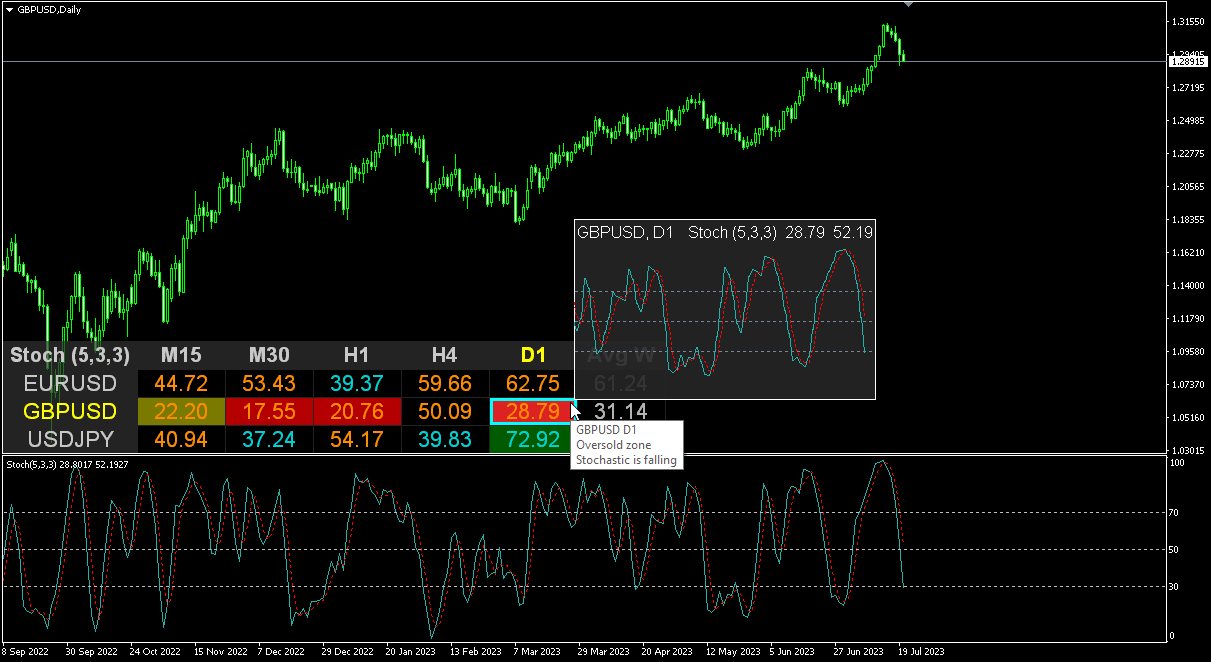
Stokastik Osilatörün çoklu para birimi ve çoklu zaman çerçevesi modifikasyonu. Parametrelerde istediğiniz para birimini ve zaman dilimlerini belirtebilirsiniz. Panel, Sinyal ve Ana (stokastik geçiş) çizgilerinin mevcut değerlerini ve kesişimlerini görüntüler. Ayrıca gösterge aşırı alım ve aşırı satım seviyelerini geçerken bildirim gönderebilir. Noktalı bir hücreye tıkladığınızda bu sembol ve nokta açılacaktır. Bu MTF Tarayıcıdır.
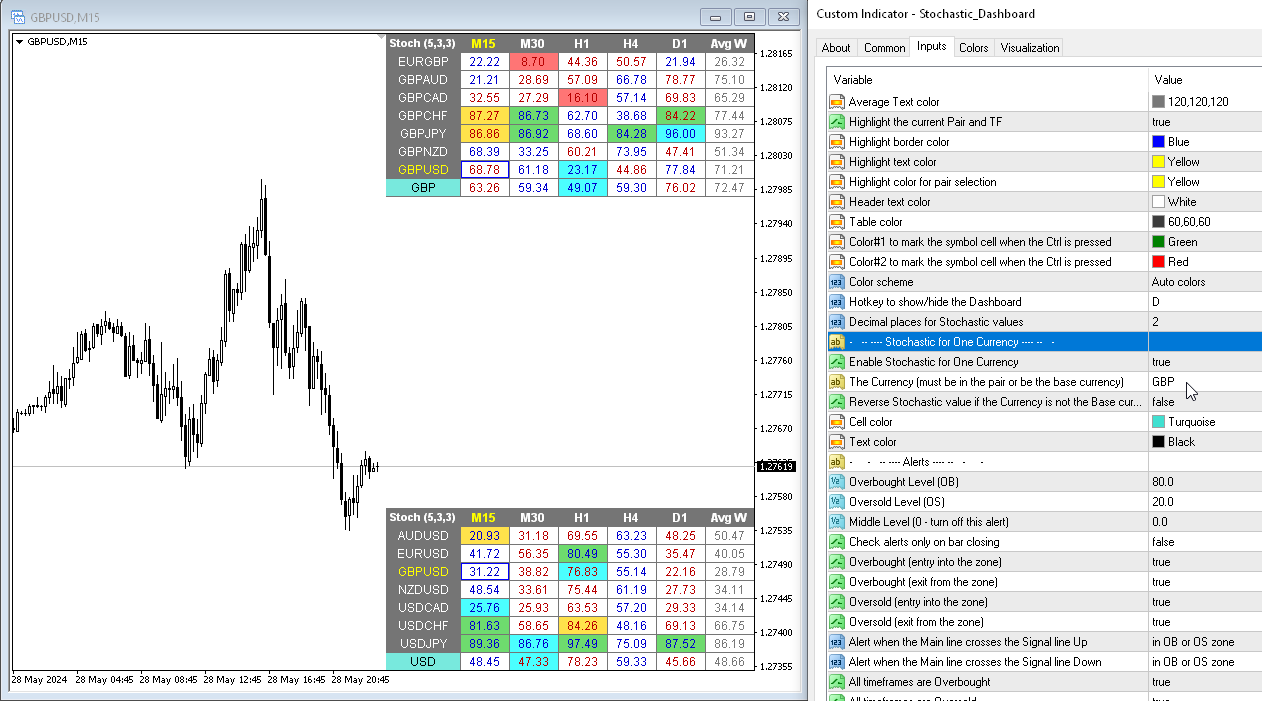
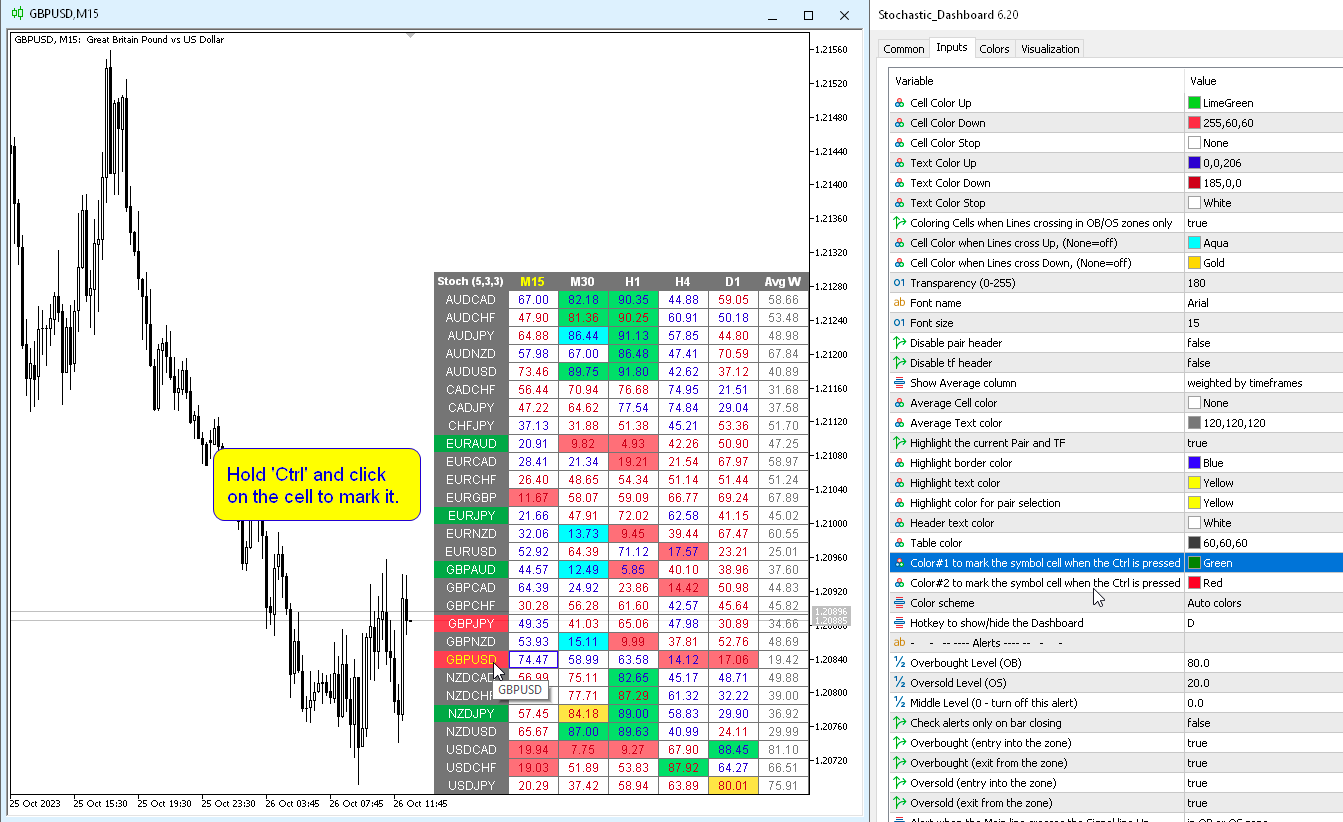
Para Birimi Gücü Ölçer'e benzer şekilde, Kontrol Paneli belirli bir para birimini içeren çiftleri veya bu para birimini temel para birimi olarak kullanan çiftleri otomatik olarak seçebilir. Gösterge, “Çiftler Kümesi”nde belirtilen tüm çiftlerde Para Birimini arar; diğer çiftler göz ardı edilir. Ve bu çiftlere dayanarak bu para biriminin toplam Stokastik değeri hesaplanır. Ve o para biriminin ne kadar güçlü ya da zayıf olduğunu görebilirsiniz.
Kontrol panelini grafikten gizlemenin anahtarı varsayılan olarak "D"dir
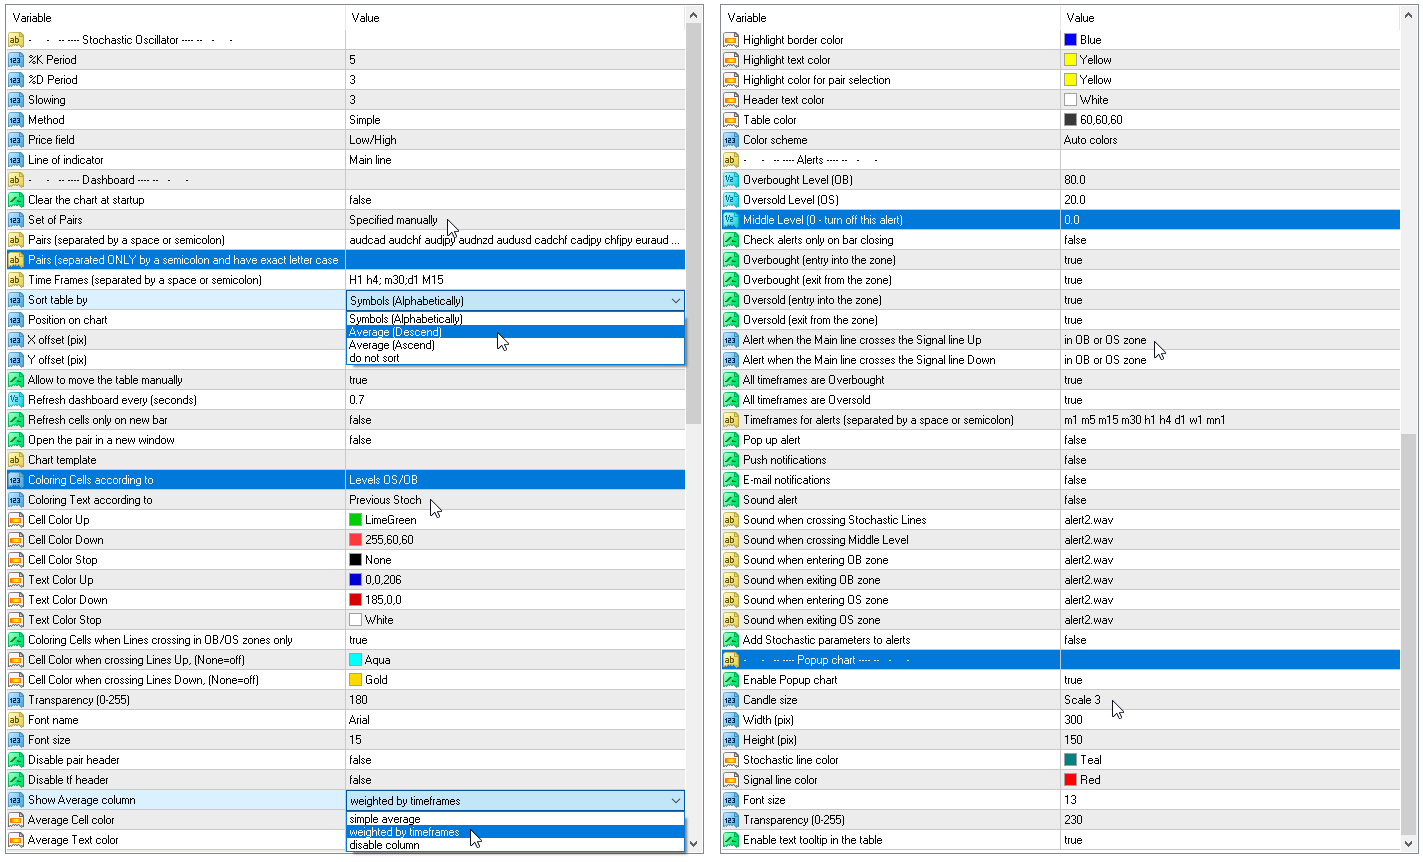
Parametreler
%K Period — K çizgisinin dönemi.
%D Period — D çizgisinin dönemi.
Slowing – yavaşlama;
Method – ortalama alma yöntemi;
Price field — fiyat türü.
Line of indicator — çizgi dizini.
Clear the chart at startup - başlangıçta grafiği temizleyin
Set of Pairs - semboller kümesi:
— Market Watch — MT'nin "Piyasa Gözlemi"nden çiftler.— Specified manually — "Çiftler" parametrelerinde manüel olarak belirtilen çiftler.— Current pair — yalnızca geçerli çifti gösterir.
Pairs (separated by a space or semicolon) - boşluk veya noktalı virgülle ayrılmış sembollerin listesi. Para birimi adları, büyük/küçük harf ve önek/sonek korunarak tam olarak komisyoncununki gibi yazılmalıdır.
Time Frames (separated by a space or semicolon) — boşluk veya noktalı virgülle ayrılmış zaman dilimlerinin listesi (çoklu zaman dilimi).
Sort pairs — çiftlerin listesini sıralama.
Position on chart — panelin grafikte görüntüleneceği köşe.
X offset (pix) — paneli X ekseni boyunca kaydırın;
Y offset (pix) — paneli Y ekseni boyunca kaydırın;
Refresh dashboard every (seconds) — tüm çiftler ve zaman dilimleri için güncelleme süresi.
Open the pair in a new window — tıklayarak yeni bir grafik penceresinde bir sembol açın.
Chart template — grafik yeni bir pencerede açılırsa, grafiğin şablonunun adı.
Coloring the cells according to the — Hücrelerin aşırı alım / aşırı satım seviyelerine göre veya önceki mumun yönüne göre tablo hücrelerinin rengine göre renklendirilmesi.
Check Lines crossing only in OB/OS zones — yalnızca Aşırı Alım/Aşırı Satış bölgelerindeki Çizgilerin kesişimini belirleyin.
Renk ayarları
Color Up - gösterge aşırı alım seviyesini arttırırsa veya geçerse hücre rengi.
Color Down - gösterge azalırsa veya aşırı satış seviyesini geçerse hücre rengi.
Color Stop — gösterge değişmezse hücre rengi.
Color when crossing Lines Up — Ana hat, Sinyal hattını yukarı doğru geçtiğinde hücre rengi.
Color when crossing Lines Down — Ana hat Sinyal hattını aşağıya doğru geçtiğinde hücre rengi.
Transparency (0-255) — panelin şeffaflığı.
Font name — yazı tipi adı.
Uyarılar
Overbought level — uyarılar için aşırı alım seviyesi.
Oversold level — uyarılar için aşırı satış seviyesi.
Middle Level (0 — turn off this alert) — üçüncü seviye geçiş kontrolü (yalnızca uyarı). Sıfır belirtilirse bu seviyenin kontrolü devre dışı bırakılır.
Check alerts only on bar closing — uyarıları yalnızca bar kapatıldığında kontrol edin.
Overbought/Oversold (entry into the zone) — aşırı alım veya aşırı satım bölgesine girerken uyarı gönderin.
Overbought/Oversold (exit from the zone) — aşırı alım veya aşırı satım bölgesinden ayrılırken uyarı gönderin.
Main line crosses the Signal line Up - Ana hat, Sinyal hattını yukarıya doğru geçtiğinde uyarı verir.
Main line crosses the Signal line Down — Ana hat, Sinyal hattını aşağı doğru geçtiğinde uyarı verir.
All timeframes are Overbought/Oversold — Tüm zaman dilimleri Aşırı Alım/Aşırı Satış'tır; tüm dönemler aşırı alım veya aşırı satım bölgesine girdiğinde uyarı verir.
Timeframes for alerts (separated by a space or semicolon) — uyarının gönderileceği dönemlerin listesi (boşluk veya noktalı virgülle ayrılmış olarak).


Wow, thank you so much. Feeling very happy for your 6.80 update. Thank you for creating a great indicator