Scalpetronix
- Indicators
- Andrey Kozak
- Version: 1.0
- Activations: 20
Scalpetronix Indicator — the signal core of the Scalpetronix robot.
This indicator implements the algorithms and signals on which the Scalpetronix Expert Advisor operates. All entries of the robot are generated based on these calculations: a combination of exponential moving averages, trend filtering via ADX, volatility normalization through ATR, and bar structure analysis.
Advantages of the indicator
-
works on a multi-level EMA system (fast and slow) with a dynamic threshold;
-
eliminates weak signals thanks to ADX filtering;
-
accounts for volatility through ATR, adapting sensitivity to different market phases;
-
analyzes bar structure (HH/HL models for buys and LH/LL models for sells);
-
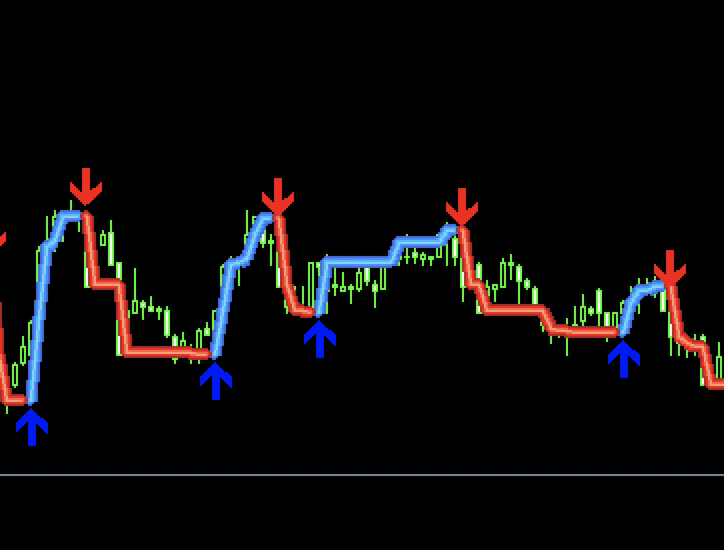
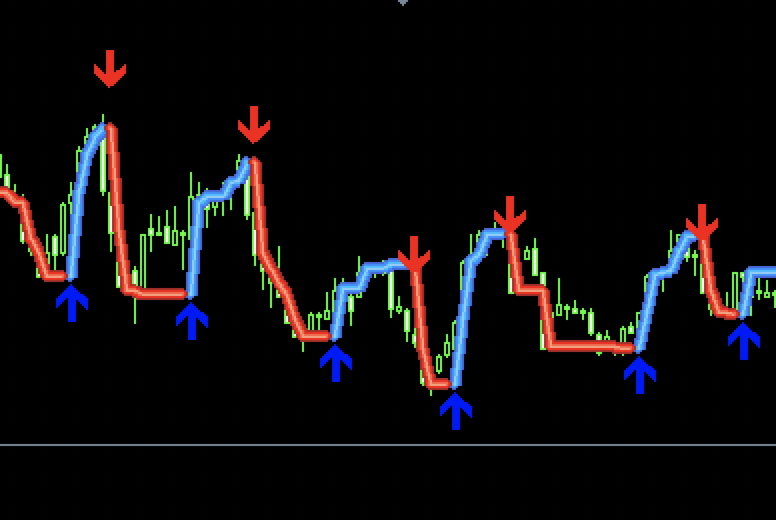
visualizes signals through multi-layered lines and phase filling, as well as plots arrows at entry points.
Algorithm of operation
EMA and dynamic threshold calculation
sep(t) = max(Point, 0.1 * ATR(t))
— buy state: EMA_fast(t) > EMA_slow(t) + sep(t)
— sell state: EMA_fast(t) < EMA_slow(t) - sep(t)
Bar structure validation
— for buys: High(t-1) > High(t-2) and Low(t-1) > Low(t-2)
— for sells: High(t-1) < High(t-2) and Low(t-1) < Low(t-2)
Trend strength filtering
A signal is confirmed only if ADX(t) > ADX_threshold.
Phase switching
When direction changes, layer copying (Up↔Down) is performed to maintain channel continuity.
Signal generation rules
A Buy signal is generated if:
-
EMA_fast(t) > EMA_slow(t) + sep(t)
-
and (EMA_fast(t-1) <= EMA_slow(t-1) + 0.5 * sep(t-1) or the HH/HL model is satisfied)
-
and ADX(t) > ADX_threshold
A Sell signal is generated if:
-
EMA_fast(t) < EMA_slow(t) - sep(t)
-
and (EMA_fast(t-1) >= EMA_slow(t-1) - 0.5 * sep(t-1) or the LH/LL model is satisfied)
-
and ADX(t) > ADX_threshold
Segmentation and visualization
The indicator uses 10 buffers:
-
4 lines for buy phases (bufUpL1…L4),
-
4 lines for sell phases (bufDownL1…L4),
-
2 filling buffers (bandBuy and bandSell).
The line thickness is set via widthCore, widthInner, widthOuter, widthEdge parameters, creating a visual gradation of trend strength.
When the phase changes, arrow objects appear on the chart: blue (code 233) for buy and red (code 234) for sell.
Indicator parameters
-
fastEmaPeriod — fast EMA period.
-
slowEmaPeriod — calculated as fastEmaPeriod + 2.
-
calcBars — analysis depth (from 50 to 5000).
-
widthCore, widthInner, widthOuter, widthEdge — system of line widths for multi-layered rendering.