• Overview
  • Reviews
  • Comments

Stop Loss Take Profit Drawer

Introduction

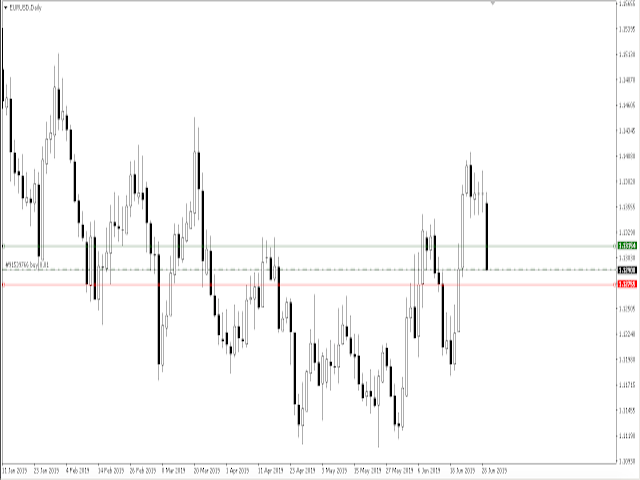
It is common practice for professional trades to hide their stop loss / take profit from their brokers. Either from keeping their strategy to the themselves or from the fear that their broker works against them. Using this indicator, the stop loss / take profit points will be drawn on the product chart using the bid price. So, you can see exactly when the price is hit and close it manually. 


Usage

Once attached to the chart, the indicator scans the open orders to attach lines for them and then waits for new one. As soon as the order is closed, the indicator will remove the target lines from the chart. 

The default stop loss value for the red line is 15 pips, while for the take profit green line it's 25 pips. You may set any value you wish for the initial values, but also drag the lines on the screen for your desired values.

© 2019 Roy Meshulam

Recommended products
VR Cub
Vladimir Pastushak
VR Cub is an indicator for getting high-quality entry points. The indicator was developed to facilitate mathematical calculations and simplify the search for entry points into a position. The trading strategy for which the indicator was written has been proving its effectiveness for many years. The simplicity of the trading strategy is its great advantage, which allows even novice traders to successfully trade with it. VR Cub calculates position opening points and Take Profit and Stop Loss targe
Infinity Trend Pro
Yaroslav Varankin
1 (1)
This is a trend indicator without redrawing Developed instead of the binary options strategy (by the color of the Martingale candlestick) Also works well in forex trading When to open trades (binary options) A signal will appear in the place with a candle signaling the current candle It is recommended to open a deal for one candle of the current timeframe M1 and M5 When a blue dot appears, open a deal up When a red dot appears, open a trade down. How to open trades on Forex. When a signal is rec
Noize Absorption Index MT4
Ekaterina Saltykova
5 (1)
Noize Absorption Index - is the manual trading system that measures the difference of pressure between bears forces and bulls forces. Green line - is a noize free index that showing curent situation. Zero value of index shows totally choppy/flat market.Values above zero level shows how powerfull bullish wave is and values below zero measures bearish forces.Up arrow appears on bearish market when it's ready to reverse, dn arrow appears on weak bullish market, as a result of reverse expectation. S
Owl smart levels
Sergey Ermolov
4.34 (35)
MT5 version  |  FAQ The Owl Smart Levels Indicator  is a complete trading system within the one indicator that includes such popular market analysis tools as  Bill Williams' advanced fractals , Valable ZigZag which builds  the correct wave structure  of the market, and  Fibonacci levels  which mark the exact levels of entry into the market and places to take profits. Detailed description of the strategy Instructions for working with the indicator Advisor-assistant in trading Owl Helper Private
Daily Candle Predictor is an indicator that predicts the closing price of a candle. The indicator is primarily intended for use on D1 charts. This indicator is suitable for both traditional forex trading and binary options trading. The indicator can be used as a standalone trading system, or it can act as an addition to your existing trading system. This indicator analyzes the current candle, calculating certain strength factors inside the body of the candle itself, as well as the parameters of
PABT Pattern Indicator - it's classical system one of the signal patterns. Indicator logic - the Hi & Lo of the bar is fully within the range of the preceding bar, look to trade them as pullback in trend. In the way if indicator found PABT pattern it's drawing two lines and arrow what showing trend way.  - First line - it's entry point and drawing at: 1. On the high of signal bar or on middle of the signal bar (depending from indicator mode) for buy; 2. On the low of signal bar or on middle of t
One of the number sequences is called "Forest Fire Sequence". It has been recognized as one of the most beautiful new sequences. Its main feature is that this sequence avoids linear trends, even the shortest ones. It is this property that formed the basis of this indicator. When analyzing a financial time series, this indicator tries to reject all possible trend options. And only if he fails, then he recognizes the presence of a trend and gives the appropriate signal. This approach allows one t
Based on MACD indicator waves with standard parameters Applies Fibonacci levels to the last two MACD waves, positive and negative respectively, if at the moment the MACD indicator runs out of negative Wave - the color is green, if at the moment the MACD indicator runs out of positive Wave - the color is red. The Wave termination criterion is two ticks with a different MACD sign. Applies trend lines on the last four MACD Waves. Works well with the expert Figures MACD   https://www.mql5.com/ru/mar
5 signal in 1  Product     TimeFrame   Recommend   1m-5m recommend  signal   TF  5m    Banks Pro Binary Option is Indicator for binary option Can Use Manaul Trade or Robot on Platform  Mt2Trading  https://www.mt2trading.com/?ref=104    Time Trading   good work  EU session    Recommend  Curency   EUR  GBP USD        careful   AUD JPY      Recommend  Martingale 2-5 Step   Recommend  set profit  2%-5%/Day Setting Brake  News Event High volatility   recommend  15-30 min Have Problem Contract
PW Oscillator
Svyatoslav Kucher
PW Oscillator   - индикатор предназначенный для поиска локальных экстремумов, определения текущей тенденции. В расчетах индикатора используется авторская методика. С помощью индикатора можно определять места возможного разворота цены желательно в направлении тенденции, но также с достаточной точностью и против нее. Также с помощью индикатора можно определять текущую тенденцию. Индикатор подходит для любых валютных пар, но для адекватного отображения показания необходимо, чтобы было достаточно ис
Trend Ray
Andriy Sydoruk
The indicator shows the potential trend direction by cyclical-wave dependence. Thus, all the rays of the intersection will be optimal rays, in the direction of which the price is expected to move, taking into account the indicator period. Rays can be used as a direction for potential market movement. But we must not forget that the approach must be comprehensive, the indicator signals require additional information to enter the market.
Magic Balance
Daniil Evstratenko
The indicator shows which trading pairs, strategies, robots and signals that you use are profitable and which are not. The statistic of trades and balance graph are displayed in the account currency and pips - to switch simply click on the graph. button "$"(top left) - minimize/expand and move the indicator panel button ">"(bottom right) - stretching and resetting to the original size Statistic of trades 1 line - account balance, current profit and lot of open trades; 2 line - the number of al
Forex Indicator "Support Resistance Levels" for MT4 Indicator " Support Resistance Levels" is very useful auxiliary indicator for trading 'Support' and 'Resistance' are important zones on chart respected by price Support level is where the price regularly stops falling and bounces back up Resistance level is where the price normally stops rising and dips back down I ndicator " Support Resistance Levels" shows the recent levels: Resistance  levels - red lines.  S upport  levels - blue lines
Power Renko MT4
Pierce Vallieres
Power Renko is an indicator which plots Renko bricks underneath the chart using a histogram. You can select the brick size and the timeframe of the Renko bricks as well as whether or not to use the close price or the high/low price of the candles. Renko bricks are based on price alone, not time, therefor the Renko bricks will not be aligned with the chart's time. They are extremely useful for trend trading and many different strategies can be formed from them. Buffers are provided allowing you t
Wave Wolf MT4
Andrei Salanevich
The Wave Wold MT4 Forex indicator is designed to search for Wolf waves and display them in the current window of the trading terminal. An excellent indicator for traders who use Wolf waves in trading. Its application in trading strategies will significantly increase their efficiency and profitability. INFORMATION ABOUT THE INDICATOR Unlike other Wolf wave indicators, the Wave Wold MT4 forex indicator has a number of features that significantly increase its effectiveness: The first is the
Super Reversal Pattern
Parfait Mujinga Ndalika
Super Reversal Pattern Indicator Unlock the power of advanced pattern recognition with our Super Reversal Pattern Indicator. Designed for traders seeking precision and reliability, this indicator identifies one of the most effective reversal patterns in technical analysis, offering a significant edge in your trading strategy. Key Features: Non-Repainting Accuracy: Enjoy the confidence of non-repainting technology. Once a Super Reversal Pattern is detected, it remains static, providing consis
This innovative indicator for measuring the strength of currencies from INFINITY is an indispensable assistant for scalpers and traders trading for a long time. The system for analyzing the Strength / weakness of currencies has long been known and used in the market by the world's leading traders. Any arbitrage trading is not complete without this analysis. Our indicator easily determines the strength of the base currencies in relation to each other. It displays line charts for all or the curren
This is a new strategy for SUPPLY DEMAND areas It is based on a calculation using the tick volume to detect the big price action in market for both bear /bull actions this smart volume action candles are used to determine the supply and demand areas prices in between main supply and demand lines indicate sideway market  up arrows will be shown when prices moves above the main supply and the secondary supply lines Down arrows will be shown when prices moves below the main demand and the secondary
The indicator allows you to trade binary options. The recommended time frame is М1 and the expiration time is 1,2,3 minutes. The indicator suitable for auto and manual trading. A possible signal is specified as a arrows above/under a candle. You should wait until the candle closes! Arrows are not re-painted Trade sessions: TOKYO section (Half-end) Currency pairs: USD/JPY Working time frame: M1 Expiration time: 1,2,3 minutes. The indicator also shows good results when using the martingale strateg
FREE
Trend Bilio - an arrow indicator without redrawing shows potential market entry points in the form of arrows of the corresponding color: upward red arrows suggest opening a buy, green down arrows - selling. The entrance is supposed to be at the next bar after the pointer. The arrow indicator Trend Bilio visually "unloads" the price chart and saves time for analysis: no signal - no deal, if an opposite signal appears, then the current deal should be closed. It is Trend Bilio that is considered
The Penta-O is a 6-point retracement harmonacci pattern which usually precedes big market movements. Penta-O patterns can expand and repaint quite a bit. To make things easier this indicator implements a twist: it waits for a donchian breakout in the right direction before signaling the trade. The end result is an otherwise repainting indicator with a very reliable trading signal. The donchian breakout period is entered as an input. [ Installation Guide | Update Guide | Troubleshooting | FAQ | A
Master Scalping M1 is an innovative indicator that uses an algorithm to quickly and accurately determine the trend.The indicator calculates the time of opening and closing positions, the indicator's algorithms allow you to find the ideal moments to enter a deal (buy or sell an asset), which increase the success of transactions for most traders. Benefits of the indicator: Easy to assemble, does not overload the chart with unnecessary information. Can be used as a filter for any strategy. Works on
Binary Options Support Resistance Indicator This indicator is designed for binary options trading and effectively shows retracements from support and resistance levels. Signals appear on the current candle. A red arrow pointing downwards indicates a potential selling opportunity, while a blue arrow pointing upwards suggests buying opportunities. All that needs adjustment is the color of the signal arrows. It is recommended to use it on the M1-M5 timeframes as signals are frequent on these timef
The Sextet Scalper Pro  is an MT4 indicator that gives signals when new waves are starting in a trend. The trends are calculated using the original " The Sextet " indicator method. You get a free EA to trade with The Sextet Scalper Pro: Free EA . Default settings were optimized on GBPUSD H1 from 2017. EA could be tested on free demo version of The Sextet Scalper Pro, before purchase. Key Features: Uses The Sextet Trend Detection Method which is already a good strategy in itself for detecting l
FX Flow
Eva Stella Conti
FX Flow   indicator can be used as an anticipator of the next trend, preferably confirmed by Price Action or another oscillator (RSi, Stochastic ..). It takes the money flows of the major currencies USD EUR GBP AUD NZD CAD CHF JPY into account, and processes them. Excellent tool for indices, but also for correlations between currencies. Works on each timeframes.  Blue line: Bull market Yellow line: Bear market Note : if the indicator opens the window, but does not draw lines, load the histo
Insider Scalper Binary This tool is designed to trade binary options. for short temporary spends. to make a deal is worth the moment of receiving the signal and only 1 candle if it is m1 then only for a minute and so in accordance with the timeframe. for better results, you need to select well-volatile charts.... recommended currency pairs eur | usd, usd | jpy .... the indicator is already configured, you just have to add it to the chart and trade .... The indicator signals the next can
Diamond PRO
Fanur Galamov
5 (19)
Diamond PRO is enhanced powerful version of Diamond for advanced traders. Pro version includes optimized cores, new impoved entry points filters, new multistage profit closure algorithm and сontains number of external control parameter that allows build and fine tune own tradind decisions and algorithms. The system provides more accurate market entries, analyzes and filters upcoming economic news, contains spread protection and an advanced position management algorithm. Main goal of Diamond PRO
Blahtech Market Profile
Blahtech Limited
4.56 (16)
Was: $249  Now: $99   Market Profile defines a number of day types that can help the trader to determine market behaviour. A key feature is the Value Area, representing the range of price action where 70% of trading took place. Understanding the Value Area can give traders valuable insight into market direction and establish the higher odds trade. It is an excellent addition to any system you may be using. Blahtech Limited presents their Market Profile indicator for the MetaTrader community. Ins
We present you the indicator "Candle closing counter", which will become your indispensable assistant in the world of trading. That’s why knowing when the candle will close can help: If you like to trade using candle patterns, you will know when the candle will be closed. This indicator will allow you to check if a known pattern has formed and if there is a possibility of trading. The indicator will help you to prepare for market opening and market closure. You can set a timer to create a p
Be notified of every color change of Heiken Ashi (HA) candles. The indicator will trigger past and new signals every time that HA candles change their colors. Note : this tool is based on the code of Heiken Ashi indicator developed by MetaQuotes Software Corp. Features The signals are triggered at closing of last bar/opening of a new bar; Any kind of alerts can be enabled: Dialog Box, Email message, SMS notifications for smartphones and tablets, and Sound alerts; By default, up arrows are plot
Buyers of this product also purchase
Gann Made Easy
Oleg Rodin
4.85 (81)
Gann Made Easy is a professional and easy to use Forex trading system which is based on the best principles of trading using the theory of mr. W.D. Gann. The indicator provides accurate BUY and SELL signals including Stop Loss and Take Profit Levels. You can trade even on the go using PUSH notifications. PLEASE CONTACT ME AFTER PURCHASE TO GET MY TRADING TIPS PLUS A GREAT BONUS! Probably you heard already many times about Gann trading methods. Usually Gann's theory is very complex thing not only
TPSpro RFI Levels
Roman Podpora
4.82 (22)
Reversal First Impulse levels (RFI)    INSTRUCTIONS        RUS       -       ENG              R ecommended to use with an indicator   -   TPSpro  TREND PRO -  Version MT5 A key element in trading is zones or levels from which decisions to buy or sell a trading instrument are made. Despite attempts by major players to conceal their presence in the market, they inevitably leave traces. Our task was to learn how to identify these traces and interpret them correctly. Main functions: Displaying activ
Atomic Analyst
Issam Kassas
5 (2)
First of all Its worth emphasizing here that this Trading Indicator is   Non-Repainting , Non Redrawing and Non Lagging Indicator   Indicator, Which makes it ideal from both manual and robot trading.  User manual: settings, inputs and strategy . The Atomic Analyst  is a PA Price Action Indicator that uses Strength and Momentum of the price to find a better edge in the market. Equipped with Advanced filters which help remove noises and false signals, and Increase Trading Potential. Using Multipl
Gold Stuff
Vasiliy Strukov
4.89 (238)
Gold Stuff is a trend indicator designed specifically for gold and can also be used on any financial instrument. The indicator does not redraw and does not lag. Recommended time frame H1. At it indicator work full auto  Expert Advisor EA Gold Stuff. You can find it at my profile. Contact me immediately after the purchase to get   personal bonus!  You can get a free copy of our Strong Support and Trend Scanner indicator, please pm. me! Settings  and manual here   SETTINGS Draw Arrow - on off. dra
Trend Punch
Mohamed Hassan
4.95 (19)
This indicator is unstoppable when combined with our other indicator called  Support & Resistance . After purchase, send us a message and you will get it   for  FREE as a BONUS! Introducing Trend Punch , the revolutionary forex trend indicator that will transform the way you trade! Trend Punch is uniquely designed to provide precise buy and sell arrows during strong market trends, making your trading decisions clearer and more confident. Whether you're trading major currency pairs or exotic sym
Scalper Inside PRO
Alexey Minkov
4.73 (56)
An exclusive indicator that utilizes an innovative algorithm to swiftly and accurately determine the market trend. The indicator automatically calculates opening, closing, and profit levels, providing detailed trading statistics. With these features, you can choose the most appropriate trading instrument for the current market conditions. Additionally, you can easily integrate your own arrow indicators into Scalper Inside Pro to quickly evaluate their statistics and profitability. Scalper Inside
TPSproTREND PrO
Roman Podpora
4.79 (19)
TPSpro TRENDPRO  - is a trend indicator that automatically analyzes the market and provides information about the trend and each of its changes, as well as giving signals for entering trades without redrawing! The indicator uses each candle, analyzing them separately. referring to different impulses - up or down impulse. Exact entry points into transactions for currencies, crypto, metals, stocks, indices!  Version MT5             DETAILED DESCRIPTION              R ecommended to use with an indi
FX Power MT4 NG
Daniel Stein
5 (12)
Trading GOLD, and currencies, with the dog walk strategy  - super smart Trading GOLD, and currencies, with the breakout strategy  - super easy Visit our all-new   Stein Investments Welcome Page   to get the latest information, updates and trading strategies. FX Power MT4 NG  is the next generation of our long-time very popular currency strength meter, FX Power.  And what does this next-generation strength meter offer? Everything you have loved about the original FX Power  PLUS GOLD/XAU stre
Currently 20% OFF ! Best Solution for any Newbie or Expert Trader! This dashboard software is working on 28 currency pairs plus one. It is based on 2 of our main indicators (Advanced Currency Strength 28 and Advanced Currency Impulse). It gives a great overview of the entire Forex market plus Gold or 1 indices. It shows Advanced Currency Strength values, currency speed of movement and signals for 28 Forex pairs in all (9) timeframes. Imagine how your trading will improve when you can watch the e
Trend Screener
STE S.S.COMPANY
4.8 (87)
Unlock the Power of Trends Trading with the Trend Screener Indicator: Your Ultimate Trend Trading Solution powered by Fuzzy Logic and Multi-Currencies System! Elevate your trading game with the Trend Screener, the revolutionary trend indicator designed to transform your Metatrader into a powerful Trend Analyzer. This comprehensive tool leverages fuzzy logic and integrates over 13 premium features and three trading strategies, offering unmatched precision and versatility. LIMITED TIME OFFER : Sup
FX Volume
Daniel Stein
4.58 (33)
Visit our all-new   Stein Investments Welcome Page   to get the latest information, updates and trading strategies. FX Volume is the FIRST and ONLY volume indicator that provides a REAL insight into the market sentiment from a broker's point of view. It provides awesome insights into how institutional market participants, like brokers, are positioned in the Forex market, much faster than COT reports. Seeing this information directly on your chart is the real game-changer and breakthrough solut
- Real price is 80$ - 40% Discount ( It is 49$ now ) Contact me for instruction, add group and any questions! Related EA Product: Bitcoin Expert Introduction The breakout and retest strategy is traded support and resistance levels. it involves price breaking through a previous level.  The break and retest strategy is designed to help traders do two main things, the first is to avoid false breakouts. Many false breakouts start with a candlestick that breaks out of a level but ends with an immedi
CURRENTLY 31% OFF !! Best Solution for any Newbie or Expert Trader! This indicator is a unique, high quality and affordable trading tool because we have incorporated a number of proprietary features and a secret formula. With only ONE chart it gives Alerts for all 28 currency pairs. Imagine how your trading will improve because you are able to pinpoint the exact trigger point of a new trend or scalping opportunity! Built on new underlying algorithms it makes it even easier to identify and confir
Enigmera
Ivan Stefanov
5 (3)
ENIGMERA: The core of the market (If the demo of mql5.com doesn't working and you want to try Enigmera please message me.) Introduction This indicator and trading system is a remarkable approach to the financial markets . ENIGMERA uses the fractal cycles to accurately calculate support and resistance levels. It shows the authentic accumulation phase and gives direction and targets.  A system that works whether we are in a trend or a correction.   How does it operate? ENIGMERA comprises of fol
Trend Cutter
Oleg Rodin
5 (2)
Trend Cutter   is a trend indicator which can be used with any time frame including the lower time frames like M1 and M5. The indicator is ideal for traders who prefer intraday trading and will be helpful to those who prefer long-term trading as well. You can use this indicator as a basis for your trading system or as a standalone trading solution. The indicator provides non-repaint signals on the close of the current candle. When the signal candle is closed, the signal will stay fixed on chart.
PRO Renko System
Oleg Rodin
5 (25)
PRO Renko System is a highly accurate trading system specially designed for trading RENKO charts. The ARROWS and Trend Indicators DO NOT REPAINT! The system effectively neutralizes so called market noise giving you access to accurate reversal signals. The indicator is very easy to use and has only one parameter responsible for signal generation. You can easily adapt the tool to any trading instrument of your choice and the size of the renko bar. I am always ready to provide extra support to help
CURRENTLY 26% OFF Best Solution for any Newbie or Expert Trader! This Indicator is a unique, high quality and affordable trading tool because we have incorporated a number of proprietary features and a new formula. With only ONE chart you can read Currency Strength for 28 Forex pairs! Imagine how your trading will improve because you are able to pinpoint the exact trigger point of a new trend or scalping opportunity? User manual: click here That's the first one, the original! Don't buy a worthle
Market Reversal Alerts
LEE SAMSON
4.19 (113)
Profit from market structure changes as price reverses and pulls back. The market structure reversal alert indicator identifies when a trend or price move is approaching exhaustion and ready to reverse. It alerts you to changes in market structure which typically occur when a reversal or major pullback are about to happen. The indicator identifies breakouts and price momentum initially, every time a new high or low is formed near a possible exhaustion point. The indicator draws in a rectangle on
TakePropips Donchian Trend Pro
Eric John Pajarillaga Aldana
4.44 (16)
TakePropips Donchian Trend Pro  (MT4) is a powerful and effective tool that automatically detects the direction of the trend using the Donchian Channel and provides you with an entry and exit trading signals! This multi-function indicator includes a trend scanner, trading signals, statistical panel, screener, trading sessions, and alerts history dashboard. It is designed to provide you with trading signals and save you hours analyzing the charts! You can download the user manual and installation
Automatically draw support and resistance levels PLUS propulsion candle gaps on your chart, so you can see where price is likely to head next and/or potentially reverse. This indicator is designed to be used as part of the position trading methodology taught on my website (The Market Structure Trader) and displays key information for targeting and potential entries. MT version available here:  https://www.mql5.com/en/market/product/97973 There are 2 CORE features in the indicator and 4 additiona
Currency Strength Wizard is a very powerful indicator that provides you with all-in-one solution for successful trading. The indicator calculates the power of this or that forex pair using the data of all currencies on multiple time frames. This data is represented in a form of easy to use currency index and currency power lines which you can use to see the power of this or that currency. All you need is attach the indicator to the chart you want to trade and the indicator will show you real str
IX Power MT4
Daniel Stein
5 (5)
IX Power finally brings the unbeatable precision of FX Power to all your trading symbols. It accurately determines the intensity of short, medium and long-term trends in your favourite indices, stocks, commodities, ETFs, and even cryptocurrencies. You can analyse everything your terminal has to offer. Try it out and experience how your timing improves significantly when trading. Read about our latest strategic development -  Easy scalping with IX Power Visit our all-new   Stein Investments
The ADR Reversal Indicator shows you at a glance where price is currently trading in relation to it's normal average daily range. You will get instant alerts via pop-up, email or push when price exceeds it's average range and levels above it of your choosing so you can jump into pullbacks and reversals quickly. The indicator draws horizontal lines on the chart at the average daily range extremes and also extensions above those levels which have mathematical probabilities attached to them of pric
Trend Pulse
Mohamed Hassan
5 (4)
Please contact me after purchase to immediately get your PDF strategy + documentation for Trend Pulse !  Introducing Trend Pulse , a unique and robust indicator capable of detecting bullish, bearish, and even ranging trends! Trend Pulse uses a special algorithm to filter out market noise with real precision. If the current symbol is moving sideways, Trend Pulse will send you a ranging signal, letting you know that it's not a good time to enter a trade. This excellent system makes Trend Pulse
The RSI / TDI alert dashboard allows you to monitor RSIs at once (selectable by you) on every major pair you trade. You can use it in two ways: 1. Select multiple time frames and the dash will show you when there are multiple time frames extended beyond normal trading conditions. A great indicator that price has pushed hard recently as it has achieved an overbought or oversold level across multiple time frames so a pullback or reversal is due soon. 2. Use one time frame (your favourite to trade)
Stratos Pali Indicator   is a revolutionary tool designed to enhance your trading strategy by accurately identifying market trends. This sophisticated indicator uses a unique algorithm to generate a complete histogram, which records when the trend is Long or Short. When a trend reversal occurs, an arrow appears, indicating the new direction of the trend. Important Information Revealed Leave a review and contact me via mql5 message to receive My Top 5 set files for Stratos Pali at no cost! D
Gold Channel is a volatility-based indicator, developed with a specific timing algorithm for the XAUUSD pair, which consists of finding possible corrections in the market. This indicator shows two outer lines, an inner line (retracement line) and an arrow sign, where the theory of the channel is to help identify overbought and oversold conditions in the market. The market price will generally fall between the boundaries of the channel. If prices touch or move outside the channel it is a tra
M1 Arrow
Oleg Rodin
4.73 (15)
M1 Arrow is an indicator which is based on natural trading principles of the market which include volatility and volume analysis. The indicator can be used with any time frame and forex pair. One easy to use parameter in the indicator will allow you to adapt the signals to any forex pair and time frame you want to trade. The Arrows DO NOT REPAINT and DO NOT LAG! The algorithm is based on the analysis of volumes and price waves using additional filters. The intelligent algorithm of the indicato
Bomb Bank Signal
Igor Pereira Calil
5 (1)
Bomb Bank Signal: Your Trusted Indicator for MetaTrader 4 The Bomb Bank Signal is a powerful indicator for MetaTrader 4, designed to identify the most relevant trends in the financial market. If you are looking for a tool that accurately anticipates movements, Bomb Bank is the ally you need. How it Works: This indicator combines three distinct methods – volume analysis, candle closes and symmetrical trend – to detect and signal buying and selling opportunities. Bomb Bank is like a "bomb"
Advanced Supply Demand
Bernhard Schweigert
4.91 (294)
CURRENTLY 26% OFF !! Best Solution for any Newbie or Expert Trader! This indicator is a unique, high quality and affordable trading tool because we have incorporated a number of proprietary features and a new formula. With this update, you will be able to show double timeframe zones. You will not only be able to show a higher TF but to show both, the chart TF, PLUS the higher TF: SHOWING NESTED ZONES. All Supply Demand traders will love it. :) Important Information Revealed Maximize the potenti
More from author
Introduction Professional traders use pivot points as support/resistance levels or as an indicator of a trend. Basically, a pivot point are areas at which the direction of price movement can  possibly  change. What makes pivot points so popular is their objectivity as they are recalculated each time the price moves further. The pivot points indicator implements 5 popular pivot points calculation and drawing: Standard –  The most basic and popular type of the pivots, each point serve as an indica
Description The Hurst exponent is referred to as the “index of dependence” or “index of long-range dependence”. It quantifies the relative tendency of a time series either to regress strongly to the mean or to cluster in a direction. A value H in the range 0.5–1 indicates a time series with long-term positive autocorrelation, meaning both that a high value in the series will probably be followed by another high value and that the values a long time into the future will also tend to be high. A va
With the Market View Indicator , you may monitor in a dedicated panel as many as products as you wish. Just add the indicator to the chart, enter the prodcuts you want to view and the change period to track and that's it. A panel will open up at the bottom of the chart which will show you per product the change in pips, the standard deviation, the return etc.  Personally, I use it to track multiple products I have positions with without having multiple charts opened up, it save me bandwith and t
Breakeven calcualtor is a Metatrader 4 indicator which calculates and displays the breakeven value for the open P&L. The value is updated dynamically based on market movements and changes. If the overall P&L is negative, the breakeven point will be displayed as a red value, otherwise green. Besides the breakeven, the following values are also displayed: Pips sum P&L change per minute Pips change per minute P&L total Swap total Commisions total 2019 Roy Meshulam
Period trend indicator calculates and displays the changes in: Trend Pips Standard Deviation Return (%) in the following periods - M1, M5, M15, M30, H1, H4, W1, MN1, MN3, MN6, Y1 and Year to Date.  By default, the current product is used, but it can any product when you attached the indicator to the chart.  I used extensively to monitor the product changes accross multiple charts wihtout having the need to open them in paralle.  2019 Roy Meshulam
In  finance , volatility (symbol σ) is the degree of variation of a trading price series over time as measured by the  standard deviation  of  logarithmic returns . Historic volatility measures a time series of past market prices.  Implied volatility  looks forward in time, being derived from the market price of a market-traded derivative (in particular, an option). In 2000 Yang-Zhang created a volatility measure that handles both opening jumps and drift. It is the sum of the overnight volatilit
The Chart Overlay indicator displays the price action of different products on the same chart, allowing you to evaluate how different symbols fluctuate relative to each other. You may use it to make trading decisions based on convergence / divergence of the displayed products, i.e. USDCAD - XTIUSD, EURUSD - USDCHF etc.  Usage Find overbought or oversold products Adapts to chart size, zoom and timeframe Automatic price level calculation Customizable colors Click 'c' to open underline product in s
What Is the Coppock Curve? The Coppock Curve is a long-term price momentum indicator used primarily to recognize major downturns and upturns in a stock market index. It is calculated as a 10-period weighted moving average of the sum of the 14-period rate of change and the 11-period rate of change for the index. It is also known as the "Coppock Guide." Example of How to Use the Coppock Curve Apply the Coppock Curve to a weekly/monthly price chart of a stock index or stock index exchange traded
Filter:
No reviews
Reply to review