Points Candles Osw
- Indicators
-
William Oswaldo Mayorga Urduy
 MQL4 and MQL5 trader and developer since February 2019, delivering projects in under one day and providing post-delivery technical support.
Optimized code, advanced logic, and high-quality code. - Version: 1.1
- Updated: 7 April 2026
Points Candles Osw
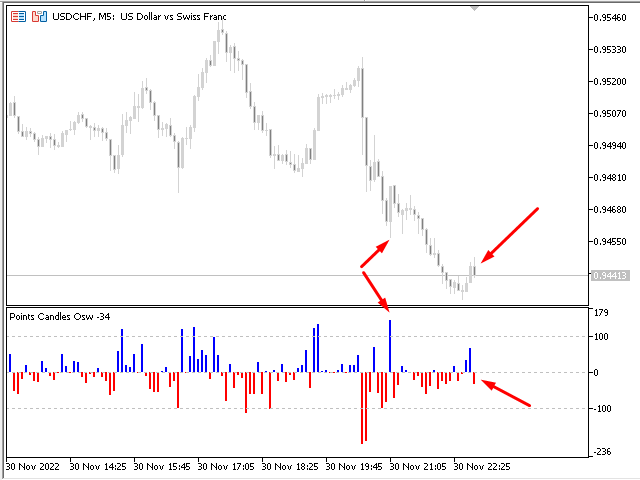
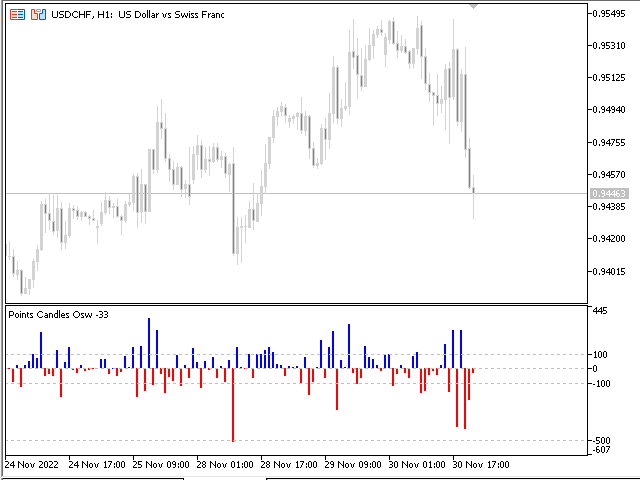
It is a professional volatility indicator designed to quantify the exact path of candles in points. Through a dynamic histogram in an independent window, it allows traders to visualize momentum and price strength, identifying volatility spikes and critical movement levels immediately.
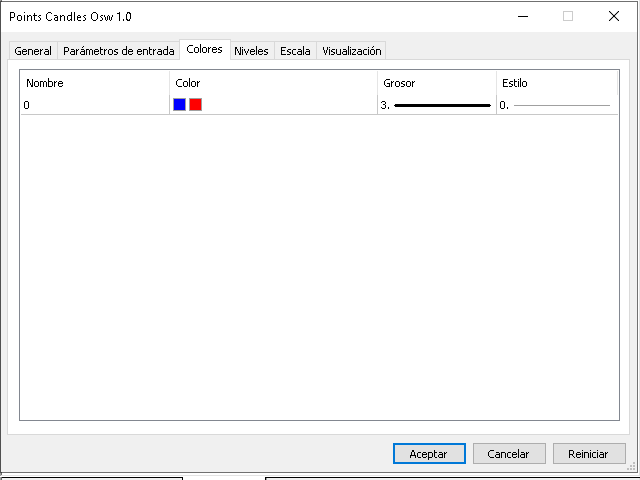
Parameters Guide (Inputs Menu)
Show Points Candles Bullish: Activates the display of data corresponding to bullish candles.
Show Points Candles Bearish: Activates the display of data corresponding to bearish candles.
Visual Interpretation and Levels Interpretation
The indicator uses a color histogram to represent market direction and magnitude:
Blue Histogram: Indicates candles with a close higher than the opening price (bullish).
Red Histogram: Indicates candles with a close lower than the opening price (bearish).
Reference Levels (100, 500, 1000): The indicator integrates automatic levels that serve as benchmarks to detect high-intensity movements or volatility explosions that exceed the usual average.
Main Functions
Real Path Calculation: Measures the distance in points between open and close, allowing knowledge of the real size of the candle body without distractions.
Directional Filtering: Offers the flexibility to monitor only one type of candle (only bullish or only bearish) to adapt to specific trend or counter-trend strategies.
Dynamic Scaling: Automatically configures the levels panel according to user display preferences, maintaining visual control of volatility at all times.
Don't forget to check my other indicators, and rate 5 stars if this indicator was useful to you.