Points Candles Osw

Points Candles Osw

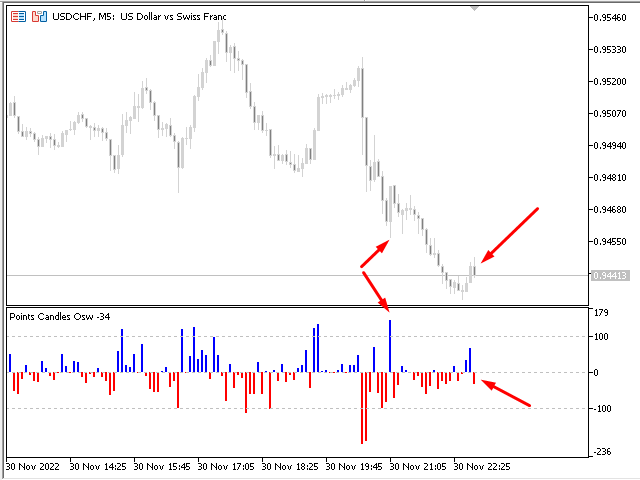
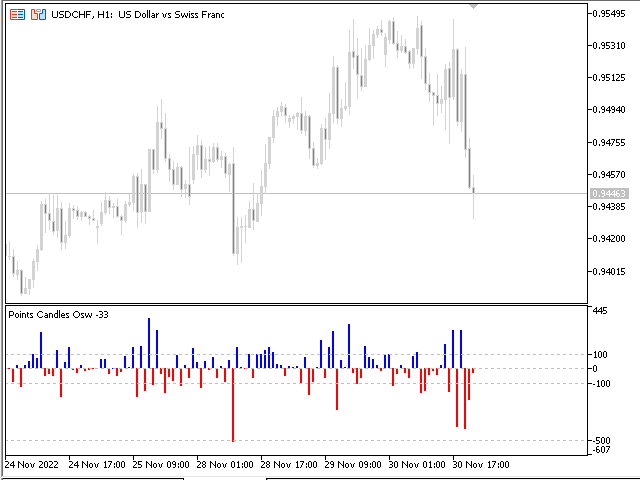
Dies ist ein professioneller Volatilitätsindikator, der entwickelt wurde, um den genauen Verlauf von Kerzen in Punkten zu quantifizieren. Durch ein dynamisches Histogramm in einem unabhängigen Fenster ermöglicht er es Tradern, das Momentum und die Preisstärke zu visualisieren und Volatilitätsspitzen sowie kritische Bewegungsniveaus sofort zu identifizieren.

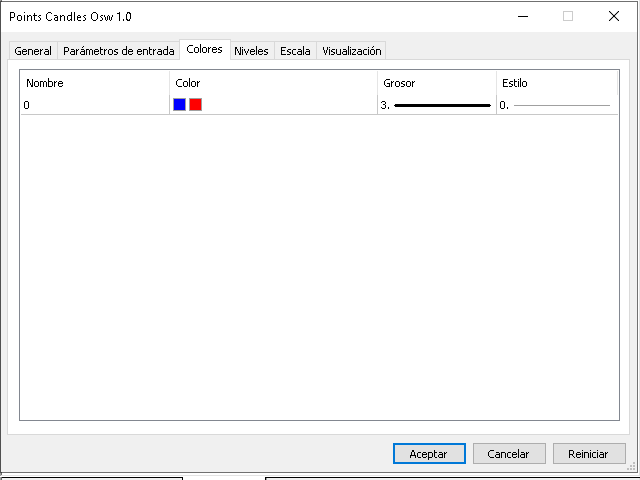
Parameterleitfaden (Eingabemenü)
Show Points Candles Bullish: Aktiviert die Anzeige der Daten für bullische Kerzen.
Show Points Candles Bearish: Aktiviert die Anzeige der Daten für bärische Kerzen.
Visuelle Interpretation und Interpretation der Niveaus
Der Indikator verwendet ein farbiges Histogramm, um die Marktrichtung und -größe darzustellen:

Blaues Histogramm: Zeigt Kerzen mit einem Schlusskurs über dem Eröffnungskurs an (bullisch).
Rotes Histogramm: Zeigt Kerzen mit einem Schlusskurs unter dem Eröffnungskurs an (bärisch).
Referenzniveaus (100, 500, 1000): Der Indikator integriert automatische Niveaus, die als Referenzpunkte dienen, um hochintensive Bewegungen oder Volatilitätsexplosionen zu erkennen, die den üblichen Durchschnitt überschreiten.
Hauptfunktionen
Berechnung des realen Verlaufs: Misst den Abstand in Punkten zwischen Eröffnung und Schluss und ermöglicht so die Kenntnis der tatsächlichen Größe des Kerzenkörpers ohne Ablenkungen.
Richtungsfilterung: Bietet die Flexibilität, nur einen Kerzentyp zu überwachen (nur bullisch oder nur bärisch), um sich an spezifische Trend- oder Gegentrendstrategien anzupassen.
Dynamische Skalierung: Konfiguriert das Niveaupanel automatisch nach den Anzeigepräferenzen des Benutzers und behält so jederzeit die visuelle Kontrolle über die Volatilität.

Vergessen Sie nicht, meine anderen Indikatoren anzusehen, und bewerten Sie mit 5 Sternen, wenn dieser Indikator für Sie nützlich war.
추천 제품
Value Chart Candlesticks
Flavio Javier Jarabeck
4.57 (14)
The idea of a Value Chart indicator was presented in the very good book I read back in 2020 , " Dynamic Trading Indicators: Winning with Value Charts and Price Action Profile ", from the authors Mark Helweg and David Stendahl. The idea is simple and the result is pure genius: Present candlestick Price analysis in a detrended way! HOW TO READ THIS INDICATOR Look for Overbought and Oversold levels. Of course, you will need to test the settings a lot to find the "correct" one for your approach. It
FREE
Tenet Support and Resistance Pro
Lucas De Melo Carvalho Cruz
Ideal for scalpers, day traders and swing trades. Automatically identifies key support and resistance levels based on historical price data. It displays real-time trading zones and a precise countdown timer for each candle, helping traders make faster and more confident decisions. Fully customizable for multiple timeframes and instruments. The indicator analyzes historical price data to draw horizontal levels that represent key trading areas. It also displays, in real time, the current zone whe
FREE
Waves Sizer
Flavio Javier Jarabeck
3.86 (7)
Wyckoff fans, enjoy! Ideally to be used with the Weis Waves indicator, but it can be easily used alone, the Waves Sizer puts the range (in resulting Price movement) done by the Price on its market swings. You can control how accurate or loose will be the swings. This tool is very helpful for visually know how much the Price has traveled in your Timeframe. This way you can confront this level of effort with the resulting Volume, etc... Weis Waves indicator: https://www.mql5.com/en/market/produc
FREE
BoxInside MT5
Evgeny Shevtsov
5 (4)
This indicator calculates the volume profile and places labels that correspond to the VAH, VAL and POC levels, for each candle individually. Indicator operation features The indicator works on the timeframes from M3 to MN, but it uses the history data of smaller periods: M1 - for periods from M3 to H1, M5 - for periods from H2 to H12, M30 - for the D1 period, H4 - for the W1 period, D1 - for the MN period. The color and location of the VAL, VAH and POC labels on the current candle are considere
FREE
Aggression Volume
Flavio Javier Jarabeck
4.29 (17)
Aggression Volume Indicator is the kind of indicator that is rarely found in the MQL5 community because it is not based on the standard Volume data provided by the Metatrader 5 platform. It requires the scrutiny of all traffic Ticks requested on the platform... That said, Aggression Volume indicator requests all Tick Data from your Broker and processes it to build a very special version of a Volume Indicator, where Buyers and Sellers aggressions are plotted in a form of Histogram. Additionally,
FREE
PZ Penta O MT5
PZ TRADING SLU
3.5 (4)
The Penta-O is a 6-point retracement harmonacci pattern which usually precedes big market movements. Penta-O patterns can expand and repaint quite a bit. To make things easier this indicator implements a twist: it waits for a donchian breakout in the right direction before signaling the trade. The end result is an otherwise repainting indicator with a very reliable trading signal. The donchian breakout period is entered as an input. [ Installation Guide | Update Guide | Troubleshooting | FAQ | A
FREE
Donchian Pro
Paulo Henrique Faquineli Garcia
4.75 (4)
The Donchian Channel Channels are among the most popular tools of technical analysis, as they visually convey to the analyst the limits within which most price movement tends to occur. Channel users know that valuable information can be obtained at any time, whether prices are in the central region of a band or close to one of the border lines. One of the best known techniques to explore these concepts is Bollinger Bands. However, John Bollinger was not the only one to research the application
FREE
DALA Forecast
Grigorii Matsnev
About the indicator: DALA Forecast is a universal tool for predicting the dynamics of time series of any nature. For prediction, modified methods of nonlinear dynamics analysis are used, on the basis of which a predictive model is built using machine learning methods.  To get the trial version of the indicator, you can contact me in private messages. How to use the indicator: Apply the indicator to your chosen financial instrument or indicator with the settings you need. The prediction will be
FREE
Here   our more valuable tools SMC Trend Trading   ,  Easy SMC Trading  ,  Institutional SMC Architect Volume Analysis Tools  ,  Volume flow Profile  ,  Market volume profile  , FVG with Volume  , Liquidity Heatmap Profile  ,  Volume Spread Analysis A professional spike pattern indicator built for synthetic traders who scalp and swing Crash 500/300/1000 with precision.  This indicator: Detects powerful 3-candle spike formations (Spike → Pullback → Spike) Automatically draws a clean box a
FREE
Trendline mt5 indicator
David Muriithi
4 (2)
Are you tired of drawing trendlines every time you're analyzing charts? Or perhaps you would like more consistency in your technical analysis. Then this is for you. This indicator will draw trend lines automatically when dropped on a chart. How it works Works similar to standard deviation channel found on mt4 and mt5. It has 2 parameters: 1. Starting Bar 2. Number of bars for calculation The   starting bar   is the bar which drawing of the trend lines will begin, while the   number of bars for c
FREE
Gold Max pro
Israr Hussain Shah
Here   our more valuable tools SMC Trend Trading   ,  Easy SMC Trading  ,  Institutional SMC Architect Volume Analysis Tools  ,  Volume flow Profile  ,  Market volume profile  , FVG with Volume  , Liquidity Heatmap Profile  ,  Volume Spread Analysis Automatic Professional Theme:   Instantly applies a high-contrast "Color on White" theme with DeepSkyBlue bull candles and Black bear candles for maximum clarity. Interactive Timeframe Panel:   21 vertical buttons on the left side allow for one-clic
FREE
Cumulative Delta MT5
Evgeny Shevtsov
4.53 (62)
The indicator analyzes the volume scale and splits it into two components - seller volumes and buyer volumes, and also calculates the delta and cumulative delta. The indicator does not flicker or redraw, its calculation and plotting are performed fairly quickly, while using the data from the smaller (relative to the current) periods. The indicator operation modes can be switched using the Mode input variable: Buy - display only the buyer volumes. Sell - display only the seller volumes. BuySell -
FREE
Weis Waves
Flavio Javier Jarabeck
2.83 (18)
The original author is David Weis, an expert in the Wyckoff Method. The Weis Wave is a modern adaptation of the 1930's Wyckoff Method, another expert in Tape Reading techniques and Chart Analysis. Weis Waves takes market volume and stacks it into waves according to price conditions giving the trader valuable insights about the market conditions. If you want to learn more about this subject you can find tons of videos in YouTube. Just look for "The Wickoff Method", "Weis Wave" and "Volume Spread
FREE
Basic Vwap
james mugendi
4 (1)
Simple Vwap with the daily, weekly and monthly VWAP is the abbreviation for   volume-weighted average price , which is a technical analysis tool that shows the ratio of an asset's price to its total trade volume. It provides traders and investors with a measure of the average price at which a stock is traded over a given period of time. How it's used Identify entry and exit points:   Traders can use VWAP to determine when to buy or sell an asset.   Understand price trends :  Traders can use V
FREE
XbigCandleFibo
Alex Sandro Aparecido
This indicator marks the 50% mark of each candle. It will help you make profitable scalping trades. If the next candle opens above the 50% mark of the previous candle, you should open a BUY position, and if the next candle opens below the 50% mark of the previous candle, you should open a SELL position. This strategy is very profitable. To make the most of it, keep an eye on the candle contexts on the left. Good luck!
FREE
High Low Open Close
Alexandre Borela
4.98 (44)
이 프로젝트를 좋아한다면 5 스타 리뷰를 남겨주세요. 이 지표는 열리고, 높은, 낮은 및 마감 가격을 지정합니다. 기간과 그것은 특정한 시간대를 위해 조정될 수 있습니다. 이들은 많은 기관 및 전문가에 의해 보는 중요한 수준입니다 상인은 당신이 더 많은 것일 수있는 장소를 알고 도움이 될 수 있습니다 이름 * 사용 가능한 기간: 이전 날. 이전 주. 지난 달. 이전 분기. 이전 연도. 또는: 현재 날. 현재 주. 현재 달. 현재 분기. 현재 년.
FREE
Donchian Breakout And Rsi
Mattia Impicciatore
4.5 (2)
개요 이 지표는 클래식 돈치안 채널(Donchian Channel) 의 향상된 버전으로, 실전 트레이딩을 위한 다양한 기능이 추가되었습니다. 표준 세 개의 선(상단, 하단, 중앙선) 외에도 브레이크아웃 을 감지하여 차트에 화살표로 시각적으로 표시하며, 차트를 깔끔하게 보기 위해 현재 추세 방향의 반대 라인만 표시 합니다. 지표 기능: 시각적 신호 : 브레이크아웃 시 컬러 화살표 표시 자동 알림 : 팝업, 푸시 알림, 이메일 RSI 필터 : 시장의 상대 강도를 기반으로 신호 검증 사용자 맞춤 설정 : 색상, 선 두께, 화살표 코드, RSI 임계값 등 동작 원리 돈치안 채널은 다음을 계산합니다: 상단선 : 최근 N개의 종가 완료 캔들에서 가장 높은 고가 하단선 : 최근 N개의 종가 완료 캔들에서 가장 낮은 저가 중앙선 : 고가와 저가의 평균값 상방 브레이크아웃 은 종가가 상단선을 돌파할 때 발생하며, 하방 브레이크아웃 은 종가가 하단선 아래로 내려갈 때 발생합니다. 이 지표는: 세 개의
FREE
Double TMA with Reversal Zones
Clayton Prickett
4.45 (11)
Note from Developer: This is the lite version of the Double TMA with Bands Indicator. You can find the paid version that comes with alerts and on screen signal arrows built in here . I will also be selling an EA based on this trading system soon once all backtesting and optimization have been completed. Unlock your trading potential with the Double TMA Indicator with Reversal Detection! Designed for swing and reversal trading, this versatile tool integrates two Triangular Moving Averages (
FREE
Follow The Line MT5
Oliver Gideon Amofa Appiah
4.6 (35)
This indicator obeys the popular maxim that: "THE TREND IS YOUR FRIEND" It paints a GREEN line for BUY and also paints a RED line for SELL. (you can change the colors). It gives alarms and alerts of all kinds. IT DOES NOT REPAINT and can be used for all currency pairs and timeframes. Yes, as easy and simple as that. Even a newbie can use it to make great and reliable trades. NB: For best results, get my other premium indicators for more powerful and reliable signals. Get them here: https://www.m
FREE
VisualVol EURUSD
Maxim Kuznetsov
The indicator highlights the points that a professional trader sees in ordinary indicators. VisualVol visually displays different volatility indicators on a single scale and a common align. Highlights the excess of volume indicators in color. At the same time, Tick and Real Volume, Actual range, ATR, candle size and return (open-close difference) can be displayed. Thanks to VisualVol, you will see the market periods and the right time for different trading operations. This version is intended f
FREE
FlatBreakout MT5
Aleksei Vorontsov
3 (1)
FlatBreakout MT5 (Free Version) Flat Range Detector and Breakout Panel for MT5 — GBPUSD Only FlatBreakout MT5   is the free version of the professional FlatBreakoutPro MT5 indicator, specially designed for flat (range) detection and breakout signals on the   GBPUSD   pair only. Perfect for traders who want to experience the unique fractal logic of FlatBreakout MT5 and test breakout signals on a live market without limitations. Who Is This Product For? For traders who prefer to trade breakout of
FREE
Aggression Wave RSJ
JETINVEST
4.57 (7)
This indicator sums up the difference between the sells aggression and the buys aggression that occurred in each Candle, graphically plotting the waves of accumulation of the aggression volumes.   Through these waves an exponential average is calculated that indicates the direction of the business flow. Note: This indicator DOES NOT WORK for Brokers and/or Markets WITHOUT the type of aggression (BUY or SELL).   Be sure to try our Professional version with configurable features and alerts:  Agre
FREE
Haven Key Levels PDH PDL
Maksim Tarutin
4.89 (9)
"Haven Key Levels PDH PDL"   인디케이터는 트레이더가 차트에서 핵심 레벨을 시각화하는 데 도움을 줍니다. 다음 레벨을 자동으로 표시합니다: DO (Daily Open)   — 일일 시가. NYM (New York Midnight)   — 뉴욕 자정 레벨. PDH (Previous Day High)   — 전일 고가. PDL (Previous Day Low)   — 전일 저가. WO (Weekly Open)   — 주간 시가. MO (Monthly Open)   — 월간 시가. PWH (Previous Week High)   — 전주 고가. PWL (Previous Week Low)   — 전주 저가. CMH (Current Month High)   — 당월 고가. CML (Current Month Low)   — 당월 저가. PMH (Previous Month High)   — 전월 고가. PML (Previous Month Low)   — 전월 저가. 다른
FREE
Free automatic Fibonacci is an indicator that automatically plots a Fibonacci retracement based on the number of bars you select on the BarsToScan setting in the indicator. The Fibonacci is automatically updated in real time as new highest and lowest values appears amongst the selected bars. You can select which level values to be displayed in the indicator settings. You can also select the color of the levels thus enabling the trader to be able to attach the indicator several times with differe
FREE
Girassol Sunflower MT5 Indicator
Saullo De Oliveira Pacheco
3.86 (7)
This is the famous Sunflower indicator for Metatrader5. This indicator marks possible tops and bottoms on price charts. The indicator identifies tops and bottoms in the asset's price history, keep in mind that the current sunflower of the last candle repaints, as it is not possible to identify a top until the market reverses and it is also not possible to identify a bottom without the market stop falling and start rising. If you are looking for a professional programmer for Metatrader5, please
FREE
If your strategy requires trading during a certain period of market activity - calm or turbulent, this indicator will help you find such periods of time within a week for each currency pair using statistics. The principle of the indicator is quite simple. The entire trading week, from Monday 00:00 to Friday 23:59, is divided into timeslots, the duration of which corresponds to the current timeframe. For each timeslot, activity is calculated - the average value of the difference between the slow
FREE
Haven Volume Profile
Maksim Tarutin
4.55 (11)
Haven Volume Profile은 거래량 분포를 기반으로 중요한 가격 수준을 식별하는 데 도움이 되는 다기능 볼륨 프로파일 분석 지표입니다. 시장을 더 잘 이해하고 중요한 진입 및 퇴장 지점을 식별하려는 전문 트레이더를 위해 설계되었습니다. 기타 제품 ->  여기 주요 기능: Point of Control (POC) 계산 - 최대 거래 활동 수준으로, 가장 유동성이 높은 수준을 식별하는 데 도움이 됩니다 Value Area 정의 (높은 활동 영역) 및 사용자 지정 가능한 거래량 비율로 거래 범위를 보다 정확하게 평가할 수 있습니다 틱 거래량과 실제 거래량 모두 지원, 다양한 시장 유형과 거래 전략에 적합 계산 기간(일 수)의 유연한 설정으로 모든 시간 프레임에 도구를 적용할 수 있습니다 터미널의 밝은 테마와 어두운 테마에 자동 적응하여 사용자 인터페이스의 시각적 경험을 향상시킵니다 레벨 시각화가 명확하고 스타일과 색상을 사용자 지정할 수 있어 빠른 의사 결정을 돕습니다 이 지표
FREE
Here   our more valuable tools SMC Trend Trading   ,  Easy SMC Trading  ,  Institutional SMC Architect Volume Analysis Tools  ,  Volume flow Profile  ,  Market volume profile  , FVG with Volume  , Liquidity Heatmap Profile  ,  Volume Spread Analysis Automatically detects major swing points not internal noise Generates buy/sell signals at key Fibonacci levels Displays professional GUI panel with real-time analysis Marks major swings with visual indicators Trading Strategy BUY at 38.2%-61.8% Fib
FREE
넥스트 바 카운트다운은 MetaTrader 5용 고정밀 고성능 시간 지표로, 트레이더에게 현재 캔들 마감까지 남은 시간을 표시하도록 특별히 설계되었습니다. 정확한 타이밍은 특히 새 캔들이 열릴 때 즉시 결정을 내려야 하는 경우 많은 거래 전략에 결정적입니다. 주요 기능: 이 지표는 표준 타이머를 뛰어넘는 다양한 기능을 제공합니다: 이중 시간대 표시: 현재 차트 시간대와 두 번째 자유롭게 선택 가능한 시간대(예: H4 또는 일간)의 카운트다운을 동시에 표시할 수 있습니다. 안티 래그 기술: 서버 시간과 로컬 시스템 시간 간의 지능형 동기화를 통해 타이머가 완벽하게 부드럽게 작동합니다. 시장 변동성이 낮거나 주말에 틱이 수신되지 않더라도 초를 건너뛰지 않습니다. 개별 맞춤 설정: 글꼴, 크기 및 차트 상의 위치는 사용자의 차트 설정에 완전히 맞게 조정할 수 있습니다. 시각적 경고 신호: 지표는 캔들 마감 직전 마지막 몇 초 동안 카운트다운 색상을 변경하여 사용자의 주의를 제때 끌 수
FREE
Enhanced Volume Profile: The Ultimate Order Flow & Liquidity Analysis Tool Overview Enhanced Volume Profile is an indicator for MetaTrader 5 that displays the traded volume at specific price levels over a defined period. It separates the total volume into buy and sell components, presenting them as a side-by-side histogram on the chart. This allows users to observe the volume distribution and the proportion of buy and sell volumes at each price level. Graphics Rendering The indicator uses the
FREE
이 제품의 구매자들이 또한 구매함
Neuro Poseidon MT5
Daria Rezueva
4.89 (47)
Neuro Poseidon is a new indicator by Daria Rezueva. It combines precise trading signals with adaptive TP/SL levels - creating best possible trades as a result! Message me and get  Neuro Poseidon Assistant  as a gift to automize your trading process! What makes it stand out? 1. Proven profitability on all assets and timeframes 2. Only confirmed BUY and SELL signals present on the chart 3. Adaptive TP & SL levels generated by the software for each trade 4. Easy to understand - suitable for al
SuperScalp Pro
Van Minh Nguyen
4.68 (28)
SuperScalp Pro – 고급 멀티 필터 스캘핑 지표 시스템 SuperScalp Pro는 클래식 Supertrend와 여러 지능형 확인 필터를 결합한 고급 스캘핑 지표로, 거래 기회를 식별하는 데 도움을 줍니다. M1부터 H4까지 다양한 시간대에서 효율적으로 작동하며, XAUUSD, BTCUSD 및 주요 Forex 통화쌍에 최적화되어 있습니다. 이 지표는 명확한 매수 및 매도 신호를 제공하며, ATR 기반으로 진입가, 손절가, 익절가를 자동 계산하여 보다 효과적인 리스크 관리를 지원합니다. Fibonacci Take Profit 기능은 중요한 가격 구간에서 더 빠르게 포지션을 청산할 수 있도록 하며, 해당 수준 도달 시 알림을 전송합니다. 기본 설정은 Fibonacci Take Profit이 활성화된 상태로 최적화되어 있으며, 보다 안정적이고 일관된 거래 경험에 중점을 둡니다. 차트에 적용하는 것만으로 즉시 사용할 수 있습니다. 고급 사용자를 위해 모든 파라미터는 자유롭게 사용
SMC Intraday Formula
Kareem Abbas
5 (16)
먼저 솔직하게 말하겠습니다. 어떤 인디케이터도 단독으로 당신을 수익성 있게 만들어주지 않습니다. 누군가 그렇게 말한다면, 그는 당신에게 꿈을 파는 것입니다. 완벽한 매수/매도 화살표를 보여주는 모든 인디케이터는 완벽하게 보이도록 만들 수 있습니다 — 단지 올바른 과거 구간을 확대하고 승리한 거래만 캡처하면 됩니다. 우리는 그렇게 하지 않습니다.  SMC Intraday Formula는 도구입니다. 시장 구조를 읽고, 가장 높은 확률의 가격 구간을 표시하며, 현재 스마트 머니의 흐름이 어떻게 보이는지 아주 단순한 언어로 보여줍니다. 최종 결정은 여전히 당신이 합니다. 실행도 당신이 합니다. 하지만 이제는 희망이 아니라 정확성으로 거래하게 됩니다. 우리는 이 인디케이터를 지난 약 3년 동안 골드(XAUUSD) 및 주요 외환 통화쌍의 데이 트레이딩 스캘핑에 사용해 왔습니다. M1, M5, M15, M30에서 우리의 핵심 도구입니다. 이 도구는 미래를 예측하려 하지 않습니다 — 지금 형성
Gold Entry Sniper
Tahir Mehmood
5 (12)
Gold Entry Sniper – 골드 스캘핑 & 스윙 트레이딩을 위한 전문 다중 시간 프레임 ATR 대시보드 Gold Entry Sniper 는 XAUUSD 및 기타 종목에 대해 정확한 매수/매도 신호 를 제공하는 고급 MetaTrader 5 지표입니다. ATR 트레일링 스톱 로직 과 다중 시간 프레임 분석 을 기반으로 설계되어 스캘핑과 스윙 트레이딩 모두에 적합합니다. 주요 기능 및 장점 다중 시간 프레임 분석 – M1, M5, M15 추세를 한눈에 확인. ATR 기반 트레일링 스톱 – 변동성에 따라 자동 조정. 전문 차트 대시보드 – 신호 상태, ATR 레벨, 회귀선, 매매 방향 표시. 명확한 매수/매도 마커 – 자동 화살표와 텍스트 라벨. 종료 알림 & 거래 관리 – 수익 보호를 위한 자동 종료 감지. 완전 사용자 설정 가능 – 대시보드 위치, 색상, ATR/회귀선 파라미터 조정. 골드(XAUUSD) 최적화 – M1~M15 스캘핑에 완벽, 외환/지수/암호화폐에도 적용 가능.
Divergence Bomber
Ihor Otkydach
4.9 (92)
이 지표를 구매하신 분께는 다음과 같은 혜택이 무료로 제공됩니다: 각 거래를 자동으로 관리하고, 손절/익절 수준을 설정하며, 전략 규칙에 따라 거래를 종료하는 전용 도우미 툴 "Bomber Utility" 다양한 자산에 맞게 지표를 설정할 수 있는 셋업 파일(Set Files) "최소 위험", "균형 잡힌 위험", "관망 전략" 모드로 설정 가능한 Bomber Utility의 셋업 파일 이 전략을 빠르게 설치, 설정, 시작할 수 있도록 돕는 단계별 영상 매뉴얼 주의: 위의 모든 보너스를 받기 위해서는 MQL5 개인 메시지 시스템을 통해 판매자에게 연락해 주세요. 독창적인 커스텀 지표인 “Divergence Bomber(다이버전스 봄버)”를 소개합니다. 이 지표는 MACD 다이버전스(괴리) 전략을 기반으로 한 올인원(All-in-One) 거래 시스템입니다. 이 기술 지표의 주요 목적은 가격과 MACD 지표 간의 다이버전스를 감지하고, **향후 가격이 어느 방향으로 움직일지를 알려주는
Entry In The Zone and SMC Multi Timeframe is a real-time 2-in-1 market analysis tool that combines market structure analysis and a No Repaint BUY / SELL signal system into a single indicator, built on Smart Money Concepts (SMC) — a widely adopted framework used by professional traders to understand market structure. This indicator helps you see the market more clearly, make decisions based on structure rather than guesswork, and focus on high-probability zones where price is more likely to react
이 제품은 2026년 시장에 맞게 업데이트되었으며 최신 MT5 빌드에 최적화되었습니다. 가격 업데이트 안내: Smart Trend Trading System은 현재 $99 에 제공됩니다. 다음 30회 구매 후 가격은 $199 로 인상됩니다. 특별 혜택: Smart Trend Trading System 구매 후 저에게 개인 메시지를 보내시면 Smart Universal EA를 무료 로 받을 수 있으며, Smart Trend 신호를 자동 거래로 전환할 수 있습니다. Smart Trend Trading System은 리페인트 없음, 재그리기 없음, 지연 없음의 완전한 트레이딩 시스템으로, 더 깨끗한 신호, 더 나은 추세 방향, 그리고 더 체계적인 시장 거래 방식을 원하는 트레이더를 위해 제작되었습니다. Online course , manual and download presets . 이 시스템은 추세 감지, 반전 구간, Smart Cloud, 트레일링 스톱 로직, 지지와 저항, 캔들 색
Gann Made Easy MT5
Oleg Rodin
5 (6)
Gann Made Easy 는 mr.의 이론을 사용하여 최고의 거래 원칙을 기반으로 하는 전문적이고 사용하기 쉬운 Forex 거래 시스템입니다. W.D. 간. 이 표시기는 Stop Loss 및 Take Profit Levels를 포함하여 정확한 BUY 및 SELL 신호를 제공합니다. PUSH 알림을 사용하여 이동 중에도 거래할 수 있습니다. 구매 후 거래 방법 안내 및 유용한 추가 지표를 무료로 받으시려면 저에게 연락주세요! 아마도 Gann 거래 방법에 대해 이미 여러 번 들었을 것입니다. 일반적으로 Gann의 이론은 초보자 거래자뿐만 아니라 이미 거래 경험이 있는 사람들에게도 매우 복잡한 것입니다. Gann의 거래 방식은 이론적으로 적용하기 쉽지 않기 때문입니다. 나는 그 지식을 연마하고 Forex 지표에 최고의 원칙을 적용하기 위해 몇 년을 보냈습니다. 표시기는 적용하기가 매우 쉽습니다. 차트에 첨부하고 간단한 거래 권장 사항을 따르기만 하면 됩니다. 지표는 지속적으로 시장 분석
PrimeScalping
Temirlan Kdyrkhan
PrimeScalping is a powerful trading companion designed to generate high-probability entry signals with dynamic TP/SL/DP levels based on volatility. Built-in performance tracking shows win/loss stats, PP1/PP2 hits, and success rates — all updated live. Key Features: Buy/Sell signals with adaptive volatility bands Real-time TP/SL/DP levels based on ATR Built-in MA Filter with optional ATR/StdDev volatility Performance stats panel (Success, Profit/Loss, PP1/PP2) Alerts via popup, sound, push, or e
Atomic Analyst MT5
Issam Kassas
4.37 (35)
이 제품은 2026년 시장에 맞게 업데이트되었으며 최신 MT5 빌드에 최적화되었습니다. 가격 업데이트 안내: Atomic Analyst는 현재 $99 에 제공됩니다. 다음 30회 구매 후 가격은 $199 로 인상됩니다. 특별 혜택: Atomic Analyst 구매 후 저에게 개인 메시지를 보내시면 Smart Universal EA를 무료 로 받을 수 있으며, Atomic Analyst 신호를 자동 거래로 전환할 수 있습니다. Atomic Analyst는 리페인트 없음, 재그리기 없음, 지연 없음의 Price Action 거래 인디케이터로, 수동 거래, 신호 명확성, EA 자동화를 위해 설계되었습니다. User manual: settings, inputs and strategy.   &   User Manual PDF . 가격 움직임, 강도, 모멘텀, 다중 시간대 방향 및 고급 필터를 분석하여 트레이더가 노이즈를 줄이고 약한 세팅을 피하며 더 체계적인 거래 결정을 내릴 수 있도록
Power Candles MT5
Daniel Stein
5 (8)
Power Candles V3 - 자체 최적화 강도 지표 파워 캔들 V3는 적용된 모든 차트에서 통화 및 상품의 강세를 실행 가능한 거래 계획으로 전환합니다. 단순히 캔들에 색상을 입히는 대신, 백그라운드에서 실시간 자동 최적화를 수행하여 현재 보고 있는 종목에 대한 최적의 손절매, 익절 및 신호 임계값을 제공합니다. 한 번의 클릭으로 실시간 거래에 적용할 수 있으며, 진입점, 손절매 및 익절 선이 정확한 가격에 맞춰 차트에 표시되고, 방향과 함께 알림이 발령됩니다. 이 도구는 Stein Investments 에코시스템의 일부입니다. 18개 이상의 도구와 함께 당신의 1대1 AI 트레이딩 멘토 Max.  항상 대기 중, 모든 인디케이터를 깊이 있게 이해, 무언가를 차근차근 생각해보고 싶은 순간에 도움을 줍니다.  https://stein.investments 에서 만나보세요 매 종가 바마다 3,000회 이상의 트레이딩 시뮬레이션. 9가지 강도 상태. 2가지 전략을 병렬로 테스트.
Quantum TrendPulse
Bogdan Ion Puscasu
5 (25)
SuperTrend   ,   RSI   ,   Stochastic   의 힘을 하나의 포괄적인 지표로 결합하여 트레이딩 잠재력을 극대화하는 궁극의 트레이딩 도구   인 Quantum TrendPulse를   소개합니다. 정밀성과 효율성을 추구하는 트레이더를 위해 설계된 이 지표는 시장 추세, 모멘텀 변화, 최적의 진입 및 종료 지점을 자신 있게 식별하는 데 도움이 됩니다. 주요 특징: SuperTrend 통합:   주요 시장 추세를 쉽게 따라가고 수익성의 물결을 타세요. RSI 정밀도:   매수 과다 및 매도 과다 수준을 감지하여 시장 반전 시점을 파악하는 데 적합하며 SuperTrend 필터로 사용 가능 확률적 정확도:   변동성이 큰 시장에서 숨겨진 기회를 찾기 위해 확률적 진동   을 활용하고 SuperTrend의 필터로 사용 다중 시간대 분석:   M5부터 H1 또는 H4까지 다양한 시간대에 걸쳐 시장을 최신 상태로 유지하세요. 맞춤형 알림:   맞춤형 거래 조건이 충족되면
The Oracle Pro
Ottaviano De Cicco
The Oracle Pro: Synthetic Multi-Timeframe Bias Engine for MT5 ️ Summer Launch Offer — Get The Oracle Pro for USD 199 (early buyers). Price rises with traction; final price USD 399. The Oracle Pro is a premium multi-timeframe bias engine for MetaTrader 5, built for demanding and professional traders. It answers one question with discipline: what is the directional bias on each timeframe right now, how strong is it, and how much do the timeframes agree? Everything is computed on closed bars only
M1 Quantum MT5
Hamed Dehgani
5 (5)
개발자 공지: 149달러 가격의 라이선스가 9 개만 남아 있습니다. 해당 라이선스가 판매되면 가격은 169달러 로 인상됩니다. M1 Quantum 은 M1 전용 전문 트레이딩 시스템으로, 손절(Stop Loss), 익절(Take Profit), 그리고 스마트 자금 관리 기능이 내장된 빠르고 정확한 거래 신호를 제공합니다. M1 Quantum 은 연속 수익 거래 에 집중하여 계좌를 빠르게 성장시키도록 설계된 전문 자금 관리 시스템을 포함하고 있습니다. M1 Quantum 인디케이터 의 주요 기능 M1 타임프레임 및 모든 주요 통화쌍 용으로 설계됨 모든 거래에 손절과 익절 적용 자금 관리 시스템 이 포함되어 트레이더가 쉽게 거래할 수 있도록 안내 높은 승률 및 높은 연속 수익률 리페인트 없음, 지연 없음 모든 트레이더가 쉽게 이해 가능 M1 Quantum 을 사용하려면 M1 Quantum Assistant 가 필요합니다. 이 강력한 도구는 모든 M1 Quantum 구매자에게 무료로 제
Trend Catcher ind mt5
Ramil Minniakhmetov
5 (6)
트렌드 캐처 인디케이터 트렌드 캐처 인디케이터는 개발자가 자체 개발한 맞춤형 적응형 트렌드 분석 지표들을 조합하여 시장 가격 움직임을 분석합니다. 단기적인 노이즈를 제거하고 근본적인 모멘텀 강도, 변동성 확대, 가격 구조 움직임에 집중하여 진정한 시장 방향을 파악합니다. 또한 이동 평균, RSI, 변동성 필터와 같은 맞춤형 지표들을 활용하여 가격을 평활화하고 트렌드를 필터링합니다. 실제 운영 모니터링 및 기타 제품은 다음 링크에서 확인하실 수 있습니다:   https://www.mql5.com/en/users/mechanic/seller 텔레그램에서는 EA나 설정 파일을 판매하지 않습니다. 사기이니 주의하세요. 모든 설정 파일은 블로그에서 무료로 제공됩니다. 중요! 구매 후 즉시 연락 주시면 사용 방법 및 보너스를 드립니다!
소개       Quantum Breakout PRO   , 브레이크아웃 존 거래 방식을 변화시키는 획기적인 MQL5 지표! 13년 이상의 거래 경험을 가진 숙련된 트레이더 팀이 개발한       퀀텀 브레이크아웃 PRO       혁신적이고 역동적인 브레이크아웃 존 전략으로 거래 여정을 새로운 차원으로 끌어올리도록 설계되었습니다. Quantum Breakout Indicator는 5개의 이익 목표 영역이 있는 브레이크아웃 영역의 신호 화살표와 브레이크아웃 상자를 기반으로 한 손절 제안을 제공합니다. 초보자 거래자와 전문 거래자 모두에게 적합합니다. Quantum EA 채널:       여기를 클릭하세요 중요한! 구매 후 설치 매뉴얼을 받으려면 개인 메시지를 보내주십시오. 추천: 기간: M15 통화쌍: GBPJPY, EURJPY, USDJPY,NZDUSD, XAUUSD 계정 유형: 스프레드가 매우 낮은 ECN, Raw 또는 Razor 브로커 시간: GMT +3 중개인 :
GoldenX Entry MT5
Kareem Abbas
5 (12)
GoldenX Entry는 MT5용 인디케이터로, 적응형 Smart Entry Trend 알고리즘, 신호 스코어링 시스템, 시장 레짐 감지 기능, 그리고 변동성 필터를 포함합니다. 각 신호에는 계산된 진입 레벨, 3개의 익절(TP1, TP2, TP3) 레벨, 그리고 손절(Stop-Loss) 레벨이 포함됩니다. 이 인디케이터는 다양한 시장 환경에 적응하도록 설계된 다중 분석 레이어 구조 위에 구축되어 있으며, 내장 최적화기와 통계 추적 시스템을 결합합니다. 또한 Risk-to-Reward(RR) 지표와 과거 거래 행동 기반의 정량 분석을 제공합니다. 시작은 간단합니다 — 선택한 타임프레임에서 최적화기를 실행한 뒤 차트에서 바로 인디케이터를 사용하면 됩니다. 핵심 기능 GoldenX Entry는 하나의 차트에서 신호 엔진, 트레이드 관리 기능, 그리고 과거 통계 추적을 통합합니다: - 내장 최적화기: 최적화기는 차트에서 원클릭으로 실행됩니다. 200개의 파라미터 조합을 두 단계 탐색
이 제품은 2026년 시장에 맞게 업데이트되었으며 최신 MT5 빌드에 최적화되었습니다. 가격 업데이트 안내: Smart Price Action Concepts는 현재 $200 에 제공됩니다. 다음 30회 구매 후 가격은 $299 로 인상됩니다. 특별 혜택: 구매 후 저에게 개인 메시지를 보내시면 무료 보너스 + 선물 을 받을 수 있습니다. 먼저, 이 트레이딩 도구는 리페인트 없음, 재그리기 없음, 지연 없음의 인디케이터이므로 전문적인 트레이딩에 적합하다는 점을 강조하고 싶습니다. Online course , and manual Smart Price Action Concepts Indicator는 초보자와 경험 많은 트레이더 모두에게 매우 강력한 도구입니다. 20개 이상의 유용한 인디케이터를 하나로 결합하고, Inner Circle Trader Analysis와 Smart Money Concepts Trading Strategies 같은 고급 트레이딩 아이디어를 통합합니다. 이 인디
ARIPoint
Temirlan Kdyrkhan
1 (1)
ARIPoint is a powerful trading companion designed to generate high-probability entry signals with dynamic TP/SL/DP levels based on volatility. Built-in performance tracking shows win/loss stats, PP1/PP2 hits, and success rates all updated live. Key Features: Buy/Sell signals with adaptive volatility bands Real-time TP/SL/DP levels based on ATR Built-in MA Filter with optional ATR/StdDev volatility Performance stats panel (Success, Profit/Loss, PP1/PP2) Alerts via popup, sound, push, or email Cu
Trend Sniper X
Sarvarbek Abduvoxobov
Trend Sniper X — 개요 Trend Sniper X 는 EMA 필터와 결합된 HTF SuperTrend 엔진을 기반으로 하는 MetaTrader 5용 멀티 타임프레임 추세 추종 지표입니다. 상위 타임프레임의 추세 방향에 따라 현재 타임프레임의 캔들 색상을 변경하고 추세 전환 지점을 BUY/SELL 화살표로 표시합니다. 가격 정보: 현재 가격은 프로모션 가격이며 향후 업데이트 및 새로운 기능 출시 시 변경될 수 있습니다. Code2Profit 채널   멀티 타임프레임 분석으로 시장을 마스터하세요!   기술 사양 플랫폼 MetaTrader 5 지표 유형 멀티 타임프레임 추세 캔들 (SuperTrend 기반) 신호 소스 HTF SuperTrend (ATR 기반) + HTF EMA 필터 작동 타임프레임 독립적으로 선택 가능한 상위 타임프레임(M1~MN1)을 지원하는 모든 차트 타임프레임 주요 상품 외환(Forex), 골드(XAUUSD) 및 기타 CFD 권장 계좌 모든 계좌 유형
Murrey Math Classic
Sarvarbek Abduvoxobov
5 (3)
Murrey Math Classic Murrey Math Classic 은 금융 시장의 가격 변동을 수학적 정밀함으로 예측하도록 설계된 전문적이고 역동적인 트레이딩 지표입니다. 이 시스템은 전설적인 가격-시간 기하학을 현대화하여 현대 금융 시장에 적합한 고도로 구조화된 수학적 모델로 변환했습니다. 머레이 수학(Murrey Math)의 핵심 논리는 금융 시장이 무작위로 움직이지 않고 특정 리듬에 따라 움직인다는 것입니다. 음악이 한 옥타브의 8개 음으로 나뉘는 것처럼, 주어진 가격 범위는 0/8부터 8/8까지 8개의 동일한 수학적 레벨로 나뉩니다. 이 선들은 숨겨져 있고 신뢰도가 높은 지지 및 저항 영역으로 작용하여, 가격이 도달하기도 전에 잠재적 반전 지점을 드러내 줍니다. Code2Profit 채널 지표 작동 방식 | 전체 전략 개요 Murrey Math Classic: 이론에서 차트 정밀도까지 왜 Murrey Math Classic이 기존 지표보다 우수한가 지표의 역사
Valtor Edge Pro
Torben Petersen
Valtor Edge Pro – Precision Gold Signal Indicator with 3-Level Take-Profit, Session Filter & Live Stats Dashboard Valtor Edge Pro   is a   non-repaint   MetaTrader 5 indicator built exclusively for   XAUUSD (Gold) . It marks high-probability buy/sell signals directly on your chart — each one with a defined stop-loss and a complete three-level take-profit map (TP1 / TP2 / TP3). Designed for disciplined traders, it pairs a clean trend-following signal engine with a professional sidebar dashboard,
FX Trend MT5 NG
Daniel Stein
5 (6)
FX Trend NG: 차세대 멀티 마켓 트렌드 인텔리전스 개요 FX Trend NG 는 다중 시간 프레임 기반의 전문 트렌드 분석 및 시장 모니터링 도구입니다. 몇 초 만에 전체 시장 구조를 파악할 수 있도록 설계되었습니다. 여러 차트를 일일이 전환할 필요 없이, 어떤 종목이 추세에 있는지, 어디에서 모멘텀이 약화되고 있는지, 그리고 어떤 시간 프레임이 서로 정렬되어 있는지 즉시 확인할 수 있습니다. 출시 기념 특별 혜택 – FX Trend NG 를 $30 (6개월) 또는 $80 평생 라이선스 로 이용할 수 있습니다. 이미 Stein Investments 고객이신가요? -> 메시지를 보내 전용 고객 그룹에 참여하세요. 설정이나 사용 방법이 필요하신가요? -> Stein Investments 공식 페이지 를 방문하세요. 1. FX Trend NG가 특별한 이유 3단계 추세 로직 – 단순한 Buy / Sell이 아닙니다 • 대부분의 지표는 Buy 또는 Sell 두 가지 상태만 제
ScalpPoint
Temirlan Kdyrkhan
ScalpPoint is a powerful trading companion designed to generate high-probability entry signals with dynamic TP/SL/DP levels based on volatility. Built-in performance tracking shows win/loss stats, PP1/PP2 hits, and success rates — all updated live. Key Features: Buy/Sell signals with adaptive volatility bands Real-time TP/SL/DP levels based on ATR Built-in MA Filter with optional ATR/StdDev volatility Performance stats panel (Success, Profit/Loss, PP1/PP2) Alerts via popup, sound, push, or emai
Grabber System MT5
Ihor Otkydach
4.83 (24)
탁월한 기술적 지표인 Grabber를 소개합니다. 이 도구는 즉시 사용 가능한 “올인원(All-Inclusive)” 트레이딩 전략으로 작동합니다. 하나의 코드 안에 강력한 시장 기술 분석 도구, 매매 신호(화살표), 알림 기능, 푸시 알림이 통합되어 있습니다. 이 인디케이터를 구매하신 모든 분들께는 다음의 항목이 무료로 제공됩니다: Grabber 유틸리티: 오픈 포지션을 자동으로 관리하는 도구 단계별 영상 매뉴얼: 설치, 설정, 그리고 실제 거래 방법을 안내 맞춤형 세트 파일: 인디케이터를 빠르게 자동 설정하여 최고의 성과를 낼 수 있도록 도와줍니다 다른 전략은 이제 잊어버리세요! Grabber만이 여러분을 새로운 트레이딩의 정점으로 이끌어 줄 수 있습니다. Grabber 전략의 주요 특징: 거래 시간 프레임: M5부터 H4까지 거래 가능한 자산: 어떤 자산이든 사용 가능하지만, 제가 직접 테스트한 종목들을 추천드립니다 (GBPUSD, GBPCAD, GBPCHF, AUDCAD, AU
안녕하세요, 트레이더 여러분! 많은 개인 투자자들이 느린 웹 스크립트에 의존하고 있습니다. 수익성 있는 거래를 위해서는 체계적인 프레임워크가 필수적입니다. Astro AI 지표는 단순한 차트 오버레이가 아닙니다. 터미널에서 직접 실행되는 두 개의 에이전트로 구성된 정교한 신경망입니다. 시스템 기술 상세 설명: 1. 에이전트 1: 분석가 (그래픽 신경망 – GNN) 시장은 개별 가격 막대로 이루어진 것이 아니라 상호 연결된 데이터 네트워크입니다. 기능: 에이전트 1은 그래픽 신경망을 사용하여 이러한 복잡하고 비선형적인 관계를 파악합니다. 장점: 기존 지표는 과거 이동 평균만을 고려하는 반면, 저희 GNN은 시장의 심층적인 구조적 관계를 실시간으로 처리하여 개별 트레이더의 거래량이 시장에 큰 영향을 미치기 전에 숨겨진 상관관계를 찾아냅니다. 2. 에이전트 2: 실행기 (근접 전략 최적화 – PPO) 패턴 인식은 절반의 성공일 뿐입니다. 현재 시장 변동에 기반하여 올바른
Crystal Heikin Ashi Signals
Muhammad Jawad Shabir
5 (2)
Crystal Heikin Ashi Signals - Professional Trend & Signal Detection Indicator Advanced Heikin Ashi Visualization with Intelligent Signal System for Manual & Automated Trading Final Price: $149 ---------> Price goes up $10 after every 10 sales . Limited slots available — act fast . Overview Crystal Heikin Ashi Signals is a professional-grade MetaTrader 5 indicator that combines pure Heikin Ashi candle visualization with an advanced momentum-shift detection system. Designed for both manual traders
Market Structure Order Block Dashboard MT5는 시장 구조와 주요 가격 반응 구역을 차트에서 직접 읽고자 하는 트레이더를 위해 설계된 MT5 지표입니다. BOS, ChoCH, 오더 블록, Fair Value Gap (FVG), 유동성, Kill Zones, Volume Profile 그리고 빠른 분석을 위한 콤팩트한 대시보드를 결합합니다. 이 지표는 시장 구조, ICT 및 Smart Money 개념을 의사결정 프레임워크로 사용하는 트레이더를 대상으로 합니다. 추세 지속, 가능한 반전, 가격 불균형, 유동성 타겟 및 관심 구역을 보다 체계적으로 식별하는 데 도움을 줄 수 있습니다. 구매자를 위한 포함 리소스 구매 후 MQL5 개인 메시지로 요청하시면 완전한 PDF 사용 설명서와 파라미터 설정 팁을 제공해 드립니다. MQL5 개인 메시지를 통한 직접 기술 지원. 1.20 버전은 두 가지 주요 추가 기능을 제공합니다: Pending BOS / Pending
Azimuth Pro
Ottaviano De Cicco
5 (7)
Azimuth Pro V2: Synthetic Fractal Structure and Confirmed Entries for MT5 Overview Azimuth Pro is a multi-level swing structure indicator by Merkava Labs . Four nested swing layers, swing-anchored VWAP, ABC pattern detection, three-timeframe structural filtering, and closed-bar confirmed entries — one chart, one workflow from micro-swings to macro-cycles. This is not a blind signal product. It is a structure-first workflow for traders who care about location, context, and timing. ️ Summer Sale
RelicusRoad Pro MT5
Relicus LLC
4.96 (24)
RelicusRoad Pro: 퀀트 시장 운영 체제 70% 할인 평생 이용권 (한정 시간) - 2,000명 이상의 트레이더와 함께하세요 왜 대부분의 트레이더는 "완벽한" 지표를 가지고도 실패할까요? 진공 상태에서 단일 개념 만으로 거래하기 때문입니다. 문맥 없는 신호는 도박입니다. 지속적인 승리를 위해서는 컨플루언스(중첩) 가 필요합니다. RelicusRoad Pro는 단순한 화살표 지표가 아닙니다. 완전한 퀀트 시장 생태계 입니다. 독점적인 변동성 모델링을 사용하여 가격이 이동하는 "공정 가치 로드"를 매핑하고, 단순 노이즈와 실제 구조적 돌파를 구분합니다. 추측은 그만두세요. 기관급 로드 로직으로 거래를 시작하세요. 핵심 엔진: "Road" 알고리즘 시스템의 중심에는 시장 상황에 실시간으로 적응하는 동적 변동성 채널인 Road Algo 가 있습니다. 세이프 라인(평형) 과 가격이 수학적으로 반전될 가능성이 높은 확장 레벨 을 투영합니다. Simple Road: 일반적인 시장을 위
제작자의 제품 더 보기
RSI Alarm Osw MT4
William Oswaldo Mayorga Urduy
RSI ALARM (For Metatrader 4) This indicator works like a normal RSI with all its settings (Periodicity, colors, levels, etc), but additionally, alarms can be set in the upper and lower level (Example 70 and 30), with the possibility of adjusting these levels by moving the upper and lower lines found on the indicator. You can also activate and deactivate an additional function that puts an arrow on the chart when the expected upper or lower RSI is met.
Whatch and Candle Alarm Osw MT5
William Oswaldo Mayorga Urduy
Watch Osw: 단순하고 효과적인 캔들 타이머 현재 캔들의 마감까지 남은 시간을 차트에 직접 표시하는 MetaTrader용 경량 지표입니다. 트레이더가 기술 분석에 추가적인 복잡함 없이 항상 새로운 바가 형성될 때까지 남은 시간을 시각화할 수 있도록 설계된 기본적이고 기능적인 도구입니다. 매개변수 가이드 (입력 메뉴) Watch Color: 차트의 타이머 텍스트에 지정된 색상. Text size: 화면에 표시되는 시간 숫자의 글꼴 크기. Text Font: 시간 표시기용 글꼴 유형. Candle End Alarm: 새로운 캔들 알림 활성화 또는 비활성화(True/False). Sound: 주기 변경 시 가청 알림을 위한 사운드 파일(.wav) 이름. 시각적 해석 및 기능 이 지표는 현재 매도 호가(Bid)를 동적으로 따르는 남은 시간 텍스트를 투사합니다. 타이머 형식은 열려 있는 차트의 기간에 따라 자동으로 조정됩니다. 초: 1분(M1) 주기에서 표시됩니다. 분 및 초:
FREE
Whatch and Candle Alarm Osw MT4
William Oswaldo Mayorga Urduy
Watch Osw: 단순하고 효과적인 캔들 타이머 현재 캔들의 마감까지 남은 시간을 차트에 직접 표시하는 MetaTrader용 경량 지표입니다. 트레이더가 기술 분석에 추가적인 복잡함 없이 항상 새로운 바가 형성될 때까지 남은 시간을 시각화할 수 있도록 설계된 기본적이고 기능적인 도구입니다. 매개변수 가이드 (입력 메뉴) Watch Color: 차트의 타이머 텍스트에 지정된 색상. Text size: 화면에 표시되는 시간 숫자의 글꼴 크기. Text Font: 시간 표시기용 글꼴 유형. Candle End Alarm: 새로운 캔들 알림 활성화 또는 비활성화(True/False). Sound: 주기 변경 시 가청 알림을 위한 사운드 파일(.wav) 이름. 시각적 해석 및 기능 이 지표는 현재 매도 호가(Bid)를 동적으로 따르는 남은 시간 텍스트를 투사합니다. 타이머 형식은 열려 있는 차트의 기간에 따라 자동으로 조정됩니다. 초: 1분(M1) 주기에서 표시됩니다. 분 및 초:
FREE
SORS Osw MT4
William Oswaldo Mayorga Urduy
사용자 설명서: SORS 동적 레벨 시스템 SORS 지표는 실시간으로 주요 지지 및 저항 수준을 예측하도록 설계된 고정밀 도구입니다. 이 지표는 표준 편차(내생적 변동성)를 사용하여 주요 시간 주기의 시가를 기반으로 확장 범위를 계산합니다. SORS의 목적은 소진 또는 가속 영역을 식별하여 트레이더가 수학적 로드맵을 기반으로 거래할 수 있도록 하는 것입니다. 매개변수 안내 (입력 메뉴) 이 메뉴를 통해 각 거래 주기의 표시 여부와 모양을 사용자 지정할 수 있습니다. 연간 설정(ANNUAL): 해당 연도의 시가를 기준으로 레벨을 제어합니다. 장기적인 거시경제적 편향을 파악하는 데 이상적입니다. 월간 설정(MONTHLY): 매월 첫째 날을 기준으로 범위를 예측합니다. 이는 포지션 거래의 기초가 됩니다. 주간 설정(WEEKLY): 월요일 시가를 기준으로 레벨을 정의합니다. 단기 및 스윙 트레이딩에 중요합니다. 일간 설정: 현재 세션의 변동성을 표시합니다(시각적 명확성을 위해 기
Divergence Osw Metatrader 4
William Oswaldo Mayorga Urduy
DIVERGENCE OSW  (For Metatrader 4) This indicator works on divergences and has the following functions: Generate an alert when a divergence occurs. Create lines by calculating the Stoploss and Takeprofit according to projection waves of inverse waves. Create an arrow indicating the possible direction of the market. The signals sent by the indicator are given when the candle ends. The Trader must evaluate each divergence to take entries. Settings: Activation and deactivation of alerts. Alert inte
Trading Sesions MT4
William Oswaldo Mayorga Urduy
COMMERCIAL SESSIONS This indicator shows in the selected graph divided by tables each of the sessions ASIA, JAPAN, LONDON, NEW YORK: Allows you to configure: Session Color  ASIA, JAPON, LONDRES, NEW YORK Hide and show each session It works in the lowest timeframes on the market, among which H4, H1, M15, M5 and M1 are recommended. (Don't forget to check out our other indicators)
Automatic Support and Resistance Osw MT4 This Indicator graphs lines at the possible support and resistance points of the selected asset. it works in multiple temporalities. allows you to configure: Color of the lines. Width of the lines. Type of lines. When the indicator begins its operation, it analyzes the supports and resistances of higher levels for the temporality in which it is working.
Round Numbers Osw MT4
William Oswaldo Mayorga Urduy
ROUND NUMBERS (For Metatrader 4) This indicator allows you to add horizontal lines according to the round numbers that the asset contains. Unlike other indicators, this one calculates the closest levels dynamically and automatically as the price moves. works on currency pairs, indices, metals, stocks, etc. Round with 5 digits, 3 digits and integers of 10 100 or 1000. lines can be adjusted in parameters like: Hide the line or round number that you do not want to display. line color. line
사용자 설명서: SRO 지능형 마킹 시스템 1. 소개 SRO 지표는 가격 움직임(Price Action) 및 SMC 트레이더를 위해 설계된 MetaTrader 5용 동적 드로잉 도구입니다. 시각적 명확성이 SRO의 가장 큰 장점입니다. 차트 전체 기록을 가로지르는 선이 생기지 않도록 미래에만 적용되는 중요한 레벨을 그릴 수 있습니다. 또한 각 객체에는 생성된 시간대가 자동으로 표시됩니다. 2. 빠른 실행 명령 이 시스템은 단축키를 사용하여 작동합니다. 원하는 가격 위에 마우스를 놓고 다음 단축키를 누르기만 하면 됩니다. "S" 키(지지): 커서에서 오른쪽으로 수평선을 그립니다. 저점 및 수요 영역을 표시하는 데 이상적입니다. "R" 키(저항): 수평 상단선을 그립니다. 공급 영역 및 고점을 식별하는 데 사용됩니다. "O" 키(주문 블록): 선택한 캔들을 자동으로 프레임에 넣습니다. 고가, 저가, 그리고 손익분기점 또는 기관 투자자의 민감도가 가장 높은 영역을 나타내는 중심선
Alert Up Down MT4
William Oswaldo Mayorga Urduy
METATRADER 5에 대한 경고 위아래 이 표시기는 가격이 UP과 DOWN 라인 사이의 영역을 벗어날 때 경고를 생성합니다. 다음과 같은 다양한 유형의 경고를 생성할 수 있습니다. > 사운드 > 메시지 상자 > 전문가 상자의 메시지 > 메일(이전 구성) > PUSH 알림(이전 구성) 선은 선 속성이 아니라 표시기 속성에서 구성해야 합니다. 선 속성에서 구성하면 피노나치가 영향을 받을 수 있기 때문입니다. 설정 중 색상, 선 스타일 및 너비를 변경할 수 있습니다. 선은 선 속성이 아니라 표시기 속성에서 구성해야 합니다. 선 속성에서 구성하면 피노나치가 영향을 받을 수 있기 때문입니다. 설정 중 색상, 선 스타일 및 너비를 변경할 수 있습니다. 선은 선 속성이 아니라 표시기 속성에서 구성해야 합니다. 선 속성에서 구성하면 피노나치가 영향을 받을 수 있기 때문입니다. 설정 중 색상, 선 스타일 및 너비를 변경할 수 있습니다.
Break Out Signal Osw
William Oswaldo Mayorga Urduy
사용자 매뉴얼: BOS Breakout Signal (OswalTrading) BOS Breakout Signal은 구조 돌파(Break of Structure)를 거래하는 트레이더를 위해 특별히 설계된 MetaTrader용 고정밀 도구입니다. 이 지표는 무작위 신호로 차트를 복잡하게 만들지 않습니다. 대신 최적화된 ZigZag 알고리즘을 사용하여 시장 소음을 필터링하고 돌파를 확인하기 전에 가장 중요한 지지 및 저항 수준만을 식별합니다. 1. 목적 및 작동 방식 이 시스템은 구조 스캐너 역할을 합니다. 시작 시 가격이 명확한 변동을 보여야 하므로 지표에 즉각적인 신호가 표시되지 않을 수 있습니다. 시장이 유효한 반전 패턴을 형성하면 지표는 보이지 않는 '활성화' 수준을 그립니다. 가격이 결단력 있게 이 수준을 돌파하면 진입 신호가 생성됩니다. 2. 파라미터 가이드 (입력 메뉴) ZigZag 알고리즘 설정 Depth (깊이): 움직임의 진폭을 결정합니다. 높은 값은 주요 추세의
Automatic OrderBlocks Osw MT4
William Oswaldo Mayorga Urduy
자동 주문 블록 OSW (메타트레이더 5) 이 표시기는 다음과 같은 사전 설정된 규칙에 따라 주문 블록을 표시하는 역할을 합니다. >이전의 충동을 깨뜨리는 충동이 있다는 것. > 발견되면 형성된 촛대 패턴을 찾아 가장 효율적인 방법으로 장소의 고저를 계산하고 Order Block의 고저를 생성하는 역할을 합니다. > 오더 블록이 생성된 후 인디케이터는 캔들이 오더 블록의 위아래 라인을 교차하는지 지속적으로 확인하여 가능한 신호가 있음을 나타내는 경고 신호를 생성합니다. >지표가 제공하는 신호는 다른 전략과 같이 100% 효과적이지 않으므로 수동 기술 분석을 동반하는 것이 좋습니다. > PC, 모바일 및 이메일의 세 가지 유형의 알림이 생성됩니다. 자동 주문 블록 OSW (메타트레이더 5) 이 표시기는 다음과 같은 사전 설정된 규칙에 따라 주문 블록을 표시하는 역할을 합니다. >이전의 충동을 깨뜨리는 충동이 있다는 것. > 발견되면 형성된 촛대 패턴을 찾아 가장
Signal Indicator to Expert MT4
William Oswaldo Mayorga Urduy
사용자 설명서: 전문가 어드바이저 "범용 지표 커넥터" 이 시스템은 재프로그래밍 없이 모든 사용자 지정 지표(.ex5)의 신호를 실행하도록 설계된 고성능 자동화 브리지입니다. 이 전문가 어드바이저는 지능형 주문 관리자 역할을 하여, 기존에는 시각적인 전략에만 의존했던 방식에 청산 규칙, 자금 위험 관리, 시간 제어 등을 적용할 수 있도록 지원합니다. 1. 지표 링크 구성 전문가 어드바이저를 사용하려면 외부 지표를 다음과 같이 정확하게 "매핑"해야 합니다. IndicatorName: Indicators 폴더에 있는 파일의 정확한 이름입니다. Signal Type: Intra-bar: 신호가 나타나는 즉시 주문을 실행합니다. Finished_bar: 캔들이 마감될 때까지 기다렸다가 신호를 확인하고 "리페인팅"을 방지합니다. NBuffer Buy/Sell: 지표가 화살표를 생성하는 데이터 채널(0, 1 등)을 지정합니다. Operations Type: 매수만, 매도만 또는
Local Copy Trading Osw MT4
William Oswaldo Mayorga Urduy
사용자 설명서: 멀티 커넥트 트레이드 카피어(MT4/MT5) 이 시스템은 MetaTrader 터미널 간 거래를 자동으로 복제하여, 최소한의 지연 시간으로 포트폴리오를 동기화하는 통신 브리지 역할을 합니다. 1. 소개 및 목적 멀티 커넥트 트레이드 카피어는 미러 계정 관리를 위한 인프라 도구입니다. 마스터 계정에서 신호를 추출하여 슬레이브 계정에서 실행함으로써 MT4와 MT5 간 거래, 독립적인 위험 조정, 사용자 지정 자산 매핑을 가능하게 합니다. 2. 설정 안내(입력 메뉴) 주요 설정 계정 유형: 터미널이 신호를 송신(마스터)할지 수신(슬레이브)할지 정의합니다. 속도(밀리초): 스캔 빈도(예: 500ms). 값이 낮을수록 복사 속도가 빨라집니다. 복사 채널: 통신 채널 이름입니다. 두 터미널에서 동일한 채널 이름을 사용해야 합니다. 자산 매핑(심볼) 마스터 접두사/접미사 제거/추가: 자산 이름에서 텍스트를 제거하거나 추가합니다(예: "EURUSD.pro"를 "EURUSD
Martingale Osw MT4
William Oswaldo Mayorga Urduy
사용자 설명서: 고급 마틴게일 관리 및 위험 제어 시스템 본 전문 설명서는 MetaTrader에서 포지션 복구 및 위험 관리를 자동화하도록 설계된 고급 마틴게일 주문 관리 시스템의 작동 방식, 설정 방법 및 사용자 인터페이스에 대해 설명합니다. 1. 소개 및 목적 이 도구는 비용 평균화를 핵심 논리로 하는 고정밀 주문 관리 시스템입니다. 초기 방향과 반대로 움직이는 거래를 보호하고 복구하기 위해, 평균 청산 가격을 높이는 미결 주문 네트워크를 구축하는 것을 목표로 합니다. 기본 시스템과 달리, 이 소프트웨어는 동적 손익분기점 및 트레일링 스톱 알고리즘과 신속한 수동 개입을 위한 화면 제어 인터페이스를 통합하여 자본 관리를 최우선으로 고려합니다. 2. 매개변수 안내 (입력 메뉴) 마틴게일 설정 및 거리 마틴게일 개수: 초기 거래 후 시스템에서 허용하는 최대 헤징 주문 개수를 정의합니다. 거리 유형: 포인트 단위의 고정 거리 또는 ATR(평균 실제 범위) 지표 기반의 동적 거리
Telegram Sender Osw MT4
William Oswaldo Mayorga Urduy
사용자 설명서: Telegram Sender Osw Telegram Sender Osw는 MetaTrader에서 Telegram으로 거래 신호를 자동으로 전송하도록 설계된 Expert Assistant(EA)입니다. 신호 제공자 및 계정 관리자에게 이상적이며, 가격, 손절매, 이익실현, 거래량과 같은 주요 데이터를 즉시 전문적으로 전송합니다. 1. 매개변수 설정 일반 및 연결 EA 활성화: 시스템을 활성화(true)하거나 비활성화(false)합니다. 봇 토큰: @BotFather에서 발급받은 영숫자 코드입니다. 채팅 ID: 대상 채널, 그룹 또는 개인 채팅의 식별자입니다. 하위 그룹/스레드 ID 전송: Telegram 그룹에서 "주제" 기능을 사용하는 경우에만 이 옵션을 활성화하십시오. 전송 로직(전송 유형) 자동: 새로운 포지션 또는 명령이 감지되는 즉시 전송합니다. 버튼: 차트에서 "Telegram 전송" 버튼을 수동으로 눌렀을 때만 전송합니다. 사용자 지정 (텔레
Market Profile Osw MT4
William Oswaldo Mayorga Urduy
사용자 매뉴얼: Market Profile Osw Market Profile Osw는 특정 기간 동안의 거래량 및 가격 분포를 시각화할 수 있는 고급 경매 분석 도구입니다. 기존의 캔들 차트와 달리, 이 시스템은 가장 활발한 거래가 발생한 위치를 보여주어 실제 시장 참여를 기반으로 한 심리적 지지 및 저항 영역을 식별할 수 있게 해줍니다. 1. 매개변수 가이드 (입력 메뉴) 일반 설정 Show Market Profile: 차트에서 프로필 표시를 활성화 또는 비활성화합니다. Volume Type: 가격 변동 횟수(Tick) 또는 실제 거래량(특정 브로커 및 자산에서 사용 가능) 중 활동 측정 방법을 선택할 수 있습니다. Look Back Bars: 지표가 현재 프로필을 생성하기 위해 소급할 캔들 개수를 정의합니다. Profile Right Side: 프로필을 가격축 옆(오른쪽)에 그릴지 아니면 분석 기간의 시작점(왼쪽)에 그릴지 결정합니다. Seconds Refresh: 지표가 데
VWap Osw MT4
William Oswaldo Mayorga Urduy
VWAP Institutional Pro: 실제 가치 지도 VWAP Institutional Pro는 시장의 공정 가격을 식별하기 위한 최적의 도구로, 대형 투자 펀드 및 고주파 알고리즘과 동일한 기준을 사용하여 거래할 수 있게 해줍니다. 이 지표는 실시간으로 거래량 가중 평균 가격을 계산하여 기관의 주문 흐름이 정밀하게 반응하는 보이지 않는 동적 지지 및 저항 수준을 드러냅니다. 설정 매개변수 가이드 MetaTrader 패널에 표시된 것과 동일한 이름을 사용하여 전략을 조정하십시오: TimeFrame VWap: 지표가 거래량 및 가격 계산을 재설정하는 고정 기간(일간, 주간 등)을 정의합니다. Show Line STD 1 a 5: 사용 가능한 5개 변동성 밴드를 각각 활성화하거나 비활성화하는 시각적 스위치입니다. STD 1 a 5: 표준 편차 밴드에 대한 사용자 정의 배수이며, 기관의 과매수 및 과매도 영역을 확장하거나 축소할 수 있습니다. 시각 및 운영 해석 시스템은 중앙
Fibo Alerts MT4
William Oswaldo Mayorga Urduy
전문 피보나치 알림 인디케이터 정확한 되돌림 알림으로 트레이딩의 효율을 높이세요 이 고급 인디케이터는 차트에 그려진 모든 피보나치 되돌림 도구에서 정확한 가격 교차를 감지하여 주요 레벨 모니터링을 자동화합니다. 황금 비율을 사용하는 까다로운 트레이더를 위해 설계되었으며, 반전 또는 지속 가능성이 높은 구역에서 진입 기회를 다시는 놓치지 않도록 터미널, 모바일 또는 이메일로 즉각적인 알림을 보냅니다. 매개변수 가이드 (입력 메뉴) Activate: 차트에서 인디케이터를 제거할 필요 없이 모니터링 기능을 빠르게 활성화 또는 비활성화합니다. BarCross: 가격 교차에 대한 검증 기준을 정의합니다. 현재 캔들의 실시간 움직임 중에 알림을 받도록 설정하거나, 캔들이 마감될 때만 알림이 발행되도록 설정할 수 있습니다(확정적인 돌파나 거부를 확인하는 데 이상적). Fibonacci Levels for Alert: 동시에 감시하려는 정확한 퍼센트 레벨을 사용자 정의할 수 있습니다. 기본적으
FVG Indicator Osw MT4
William Oswaldo Mayorga Urduy
FVG Pro 기관용 스캐너 스마트 머니(Smart Money) 트레이더를 위한 고급 페어 밸류 갭(FVG) 탐지기입니다. 차트의 임계 유동성 불균형을 자동으로 스캔하고 강조하여 가격 반응 예측, 고확률 지속 거래 및 기관 진입 정밀화를 가능하게 합니다. 파라미터 가이드 CandlesScan: 플랫폼 성능 최적화를 위해 분석되는 과거 캔들 수 제한. FVGPointsMin: 노이즈와 미세한 시장 움직임을 필터링하기 위해 요구되는 최소 갭 크기(포인트). FVGTimeCandles: 감지된 구역이 시각적으로 투영되는 미래 캔들 수. Candle1OnDir: 패턴의 가장 최근 캔들이 주요 불균형 방향으로 마감되어야 함을 요구. Candle2OnDir: 중심 생성 캔들이 모멘텀 방향으로 강하게 마감되어야 함을 조건으로 함. Candle3OnDir: 형성의 기원 캔들이 동일한 추세 방향을 공유하는지 확인. ColorUP: 상승 갭(지지 구역)에 사용되는 블록 색상 정의. ColorDN:
Multi Indicators Osw MT4
William Oswaldo Mayorga Urduy
Multi Indicators Osw 상업적 설명 Multi Indicators Osw는 MetaTrader 5를 위한 단일 도구에 8가지 가장 강력한 클래식 트레이딩 전략을 통합한 궁극적인 기술 워크스테이션입니다. 시각적 분석을 단순화하도록 설계된 이 지표는 차트를 복잡하게 만들지 않으면서 RSI, MACD, 이동 평균선, 볼린저 밴드, 스토캐스틱, CCI, 파라볼릭 SAR 및 엔벨로프의 합류(confluence)를 필터링하고 시각화할 수 있게 해줍니다. 각 전략에 대해 전문적이고 독립적인 알림 시스템을 갖추고 정확한 기술적 확인을 원하는 트레이더에게 이상적인 솔루션입니다. 매개변수 가이드 (입력 항목) 전략 및 지표 설정 Enable [Indicator Name]: 선택한 지표의 신호 표시 및 계산을 활성화 또는 비활성화합니다. Period / Fast EMA / Slow EMA: 단기 또는 장기 시장 사이클을 포착하기 위해 시간 민감도를 조정합니다. Method / Pric
SORS Osw
William Oswaldo Mayorga Urduy
사용자 설명서: SORS 동적 레벨 시스템 SORS 지표는 실시간으로 주요 지지 및 저항 수준을 예측하도록 설계된 고정밀 도구입니다. 이 지표는 표준 편차(내생적 변동성)를 사용하여 주요 시간 주기의 시가를 기반으로 확장 범위를 계산합니다. SORS의 목적은 소진 또는 가속 영역을 식별하여 트레이더가 수학적 로드맵을 기반으로 거래할 수 있도록 하는 것입니다. 매개변수 안내 (입력 메뉴) 이 메뉴를 통해 각 거래 주기의 표시 여부와 모양을 사용자 지정할 수 있습니다. 연간 설정(ANNUAL): 해당 연도의 시가를 기준으로 레벨을 제어합니다. 장기적인 거시경제적 편향을 파악하는 데 이상적입니다. 월간 설정(MONTHLY): 매월 첫째 날을 기준으로 범위를 예측합니다. 이는 포지션 거래의 기초가 됩니다. 주간 설정(WEEKLY): 월요일 시가를 기준으로 레벨을 정의합니다. 단기 및 스윙 트레이딩에 중요합니다. 일간 설정: 현재 세션의 변동성을 표시합니다(시각적 명확성을 위해 기
RSI Alarm Osw
William Oswaldo Mayorga Urduy
RSI ALARM (For Metatrader 5) This indicator works like a normal RSI with all its settings (Periodicity, colors, levels, etc), but additionally, alarms can be set at the upper and lower level (Example 70 and 30), with the possibility of adjusting these levels by moving the blue and red lines to establish the upper and lower levels. You can also turn on and off an additional function that creates an arrow on the chart when the expected upper or lower RSI is met.
Automatic Support and Resistance Osw MT5 This Indicator graphs lines at the possible support and resistance points of the selected asset. it works in multiple temporalities. allows you to configure: Color of the lines. Width of the lines. Type of lines. When the indicator begins its operation, it analyzes the supports and resistances of higher levels for the temporality in which it is working.
Round Number Osw MT5
William Oswaldo Mayorga Urduy
ROUND NUMBERS (For Metatrader 5) This indicator allows you to add horizontal lines according to the round numbers that the asset contains. Unlike other indicators, this one calculates the closest levels dynamically and automatically as the price moves. works on currency pairs, indices, metals, stocks, etc. Round with 5 digits, 3 digits and integers of 10 100 or 1000. lines can be adjusted in parameters like: Hide the line or round number that you do not want to display. line color. line
사용자 설명서: SRO 지능형 마킹 시스템 1. 소개 SRO 지표는 가격 움직임(Price Action) 및 SMC 트레이더를 위해 설계된 MetaTrader 5용 동적 드로잉 도구입니다. 시각적 명확성이 SRO의 가장 큰 장점입니다. 차트 전체 기록을 가로지르는 선이 생기지 않도록 미래에만 적용되는 중요한 레벨을 그릴 수 있습니다. 또한 각 객체에는 생성된 시간대가 자동으로 표시됩니다. 2. 빠른 실행 명령 이 시스템은 단축키를 사용하여 작동합니다. 원하는 가격 위에 마우스를 놓고 다음 단축키를 누르기만 하면 됩니다. "S" 키(지지): 커서에서 오른쪽으로 수평선을 그립니다. 저점 및 수요 영역을 표시하는 데 이상적입니다. "R" 키(저항): 수평 상단선을 그립니다. 공급 영역 및 고점을 식별하는 데 사용됩니다. "O" 키(주문 블록): 선택한 캔들을 자동으로 프레임에 넣습니다. 고가, 저가, 그리고 손익분기점 또는 기관 투자자의 민감도가 가장 높은 영역을 나타내는 중심선
Multi Temporalities Osw MT5
William Oswaldo Mayorga Urduy
MULTI-TIMES FOR METATRADER 5 This indicator, in a lower window, shows the current chart in different timeframes, this can help you better decipher the market, taking into account the higher timeframes. Among the settings that you can modify are: view of prices in charts view of the temporalities in the graphs enable each of the graphics in the different temporalities (M1, M5, M15, H1, H4, D1, W1, MN1).
Alert Up Down MT5
William Oswaldo Mayorga Urduy
METATRADER 5에 대한 경고 위아래 이 표시기는 가격이 UP과 DOWN 라인 사이의 영역을 벗어날 때 경고를 생성합니다. 다음과 같은 다양한 유형의 경고를 생성할 수 있습니다. > 사운드 > 메시지 상자 > 전문가 상자의 메시지 > 메일(이전 구성) > PUSH 알림(이전 구성) 선은 선 속성이 아니라 표시기 속성에서 구성해야 합니다. 선 속성에서 구성하면 피노나치가 영향을 받을 수 있기 때문입니다. 설정 중 색상, 선 스타일 및 너비를 변경할 수 있습니다. 선은 선 속성이 아니라 표시기 속성에서 구성해야 합니다. 선 속성에서 구성하면 피노나치가 영향을 받을 수 있기 때문입니다. 설정 중 색상, 선 스타일 및 너비를 변경할 수 있습니다. 선은 선 속성이 아니라 표시기 속성에서 구성해야 합니다. 선 속성에서 구성하면 피노나치가 영향을 받을 수 있기 때문입니다. 설정 중 색상, 선 스타일 및 너비를 변경할 수 있습니다.
Master Calendar Osw
William Oswaldo Mayorga Urduy
전문가용 사용자 설명서: Master Calendar OSW 본 설명서는 Master Calendar OSW의 작동 방식을 완벽하게 이해할 수 있도록 제작되었습니다. Master Calendar OSW는 경제 캘린더를 MetaTrader 플랫폼에 직접 통합한 고성능 펀더멘털 분석 콘솔입니다. 이 시스템은 데이터 표시뿐 아니라 통화 건전성 및 기관 유동성 주기 분석까지 제공합니다. 1. 소개 및 시스템 목적 Master Calendar OSW는 시장 상황 분석 도구입니다. 거시 경제 이벤트에 대한 맹목적인 거래를 방지하고 주요 금융 시장 개장 시 발생하는 확장 움직임을 활용할 수 있도록 지원합니다. 다른 지표와 달리, 이 시스템은 고급 차트 엔진을 사용하여 기술적 가격 분석을 방해하지 않고 정보를 이동, 축소 및 관리할 수 있습니다. 2. 매개변수 안내 (입력 메뉴) 지표를 로드하면 거래 환경을 사용자 지정할 수 있는 다음과 같은 옵션이 표시됩니다. 표시 및 이벤트 설정 Ini
Volumes Direction MT5
William Oswaldo Mayorga Urduy
볼륨 방향 MT5 일반적으로 현재 볼륨이 이전 볼륨보다 높을 때 볼륨 표시기의 기본 색상 변경이 있습니다. 중요하지만 그다지 유용하지는 않습니다. 이러한 이유로 이 지표는 정상적인 볼륨 외에도 양초가 강세 또는 약세일 때 다른 색상으로 칠하도록 만들어졌습니다. 기본적으로 강세는 파란색이고 약세는 빨간색이지만 이러한 색상은 사용자 정의할 수 있습니다. 상인의 취향. 귀하의 거래를 개선하는 데 도움이 될 다른 지표를 확인하는 것을 잊지 마십시오. 볼륨 방향 MT5 일반적으로 현재 볼륨이 이전 볼륨보다 높을 때 볼륨 표시기의 기본 색상 변경이 있습니다. 중요하지만 그다지 유용하지는 않습니다. 이러한 이유로 이 지표는 정상적인 볼륨 외에도 양초가 강세 또는 약세일 때 다른 색상으로 칠하도록 만들어졌습니다. 기본적으로 강세는 파란색이고 약세는 빨간색이지만 이러한 색상은 사용자 정의할 수 있습니다. 상인의 취향. 귀하의 거래를 개선하는 데 도움이 될 다른 지표를 확인하는 것
필터:
리뷰 없음
리뷰 답변