Supports and Resistances and Order Blocks Osw MT4
- Indicators
-
William Oswaldo Mayorga Urduy
 MQL4 and MQL5 trader and developer since February 2019, delivering projects in under one day and providing post-delivery technical support.
Optimized code, advanced logic, and high-quality code. - Version: 1.1
- Updated: 20 July 2023
- Activations: 5
User Manual: SRO Intelligent Marking System
1. Introduction
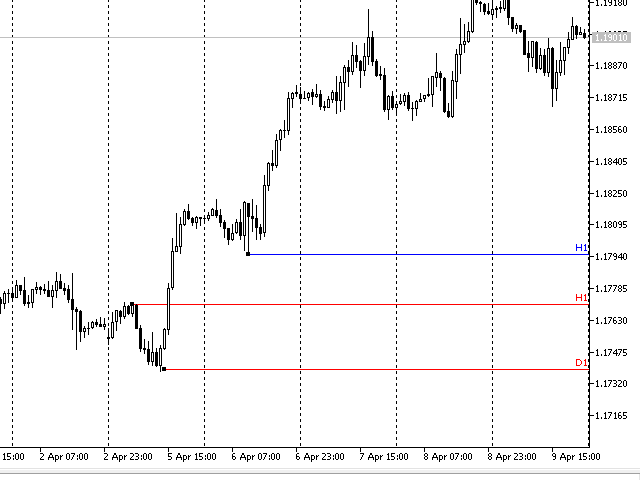
The SRO indicator is a dynamic drawing tool for MetaTrader 5 designed for Price Action and SMC traders. Its competitive advantage is its visual clarity: it allows you to draw critical levels that project only into the future, preventing lines from crossing the entire chart history. It also automatically labels each object with the timeframe in which it was created.
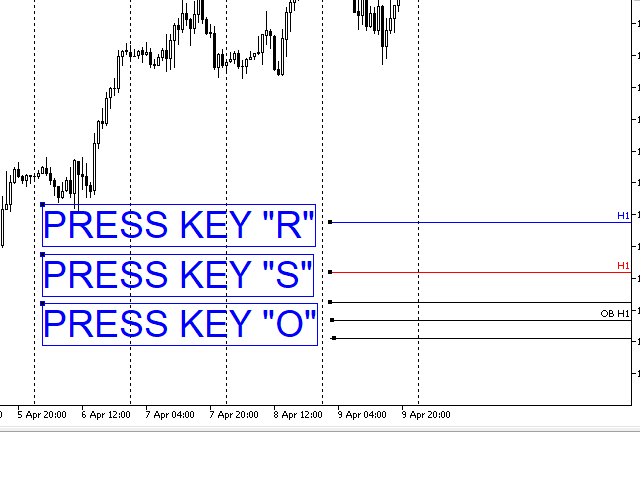
2. Quick Execution Commands
The system operates using hotkeys. Simply position the mouse over the desired price and press:
"S" key (Support): Creates a horizontal line from the cursor to the right. Ideal for marking bottoms and demand zones.
"R" key (Resistance): Creates a horizontal ceiling line. Used to identify supply zones and highs.
"O" key (Order Block): Automatically frames the selected candle. Draws the high, the low, and a center line (50%) that represents the breakeven point or area of greatest institutional sensitivity.
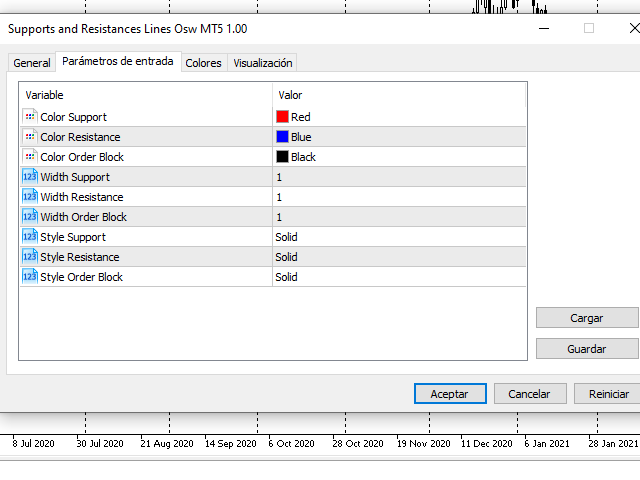
3. Parameter Settings
In the input menu, you can customize the appearance without touching the code:
Lines (Support/Resistance):
Color: Visually differentiate your zones (e.g., red for support, blue for resistance).
Width: Adjust the thickness to highlight higher timeframe levels (H4, D1).
Style: Choose between solid, dotted, or dashed lines.
Order Blocks:
Color/Width/Style: Customize the box that delimits the high-reaction zone.
4. Trading Guide and Recommendations
Hierarchy: Mark your levels on the H4 or Daily timeframe. When you zoom in to M15, the labels will remind you which levels are strongest.
Accuracy: Use the center line of the Order Block (50%) to place your limit orders, as this is usually the point of greatest reaction.
Confluence: The best entries occur when a support/resistance level on a higher timeframe coincides with a block of orders on a lower timeframe.
This system guarantees a professional, clean, and hierarchical chart for quick decision-making.