• Overview
  • Reviews
  • Comments (3)
  • What's new

DALA Forecast

About the indicator:

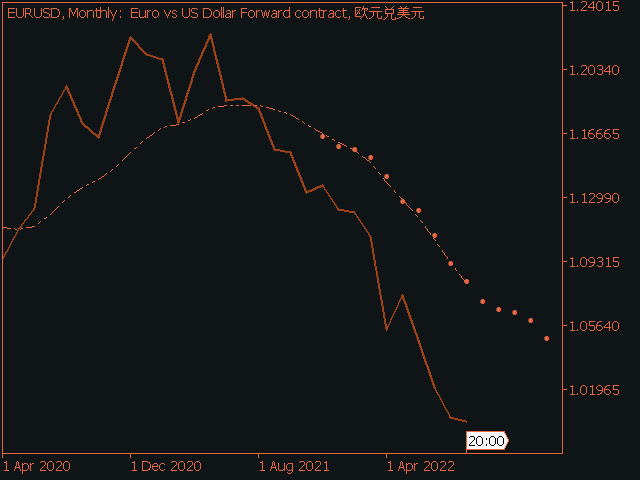
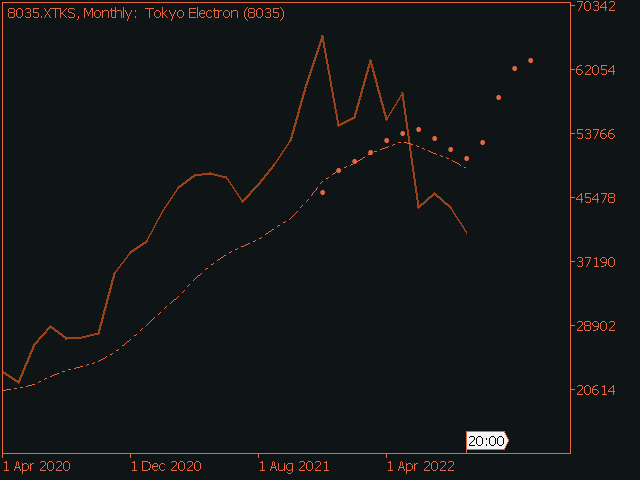
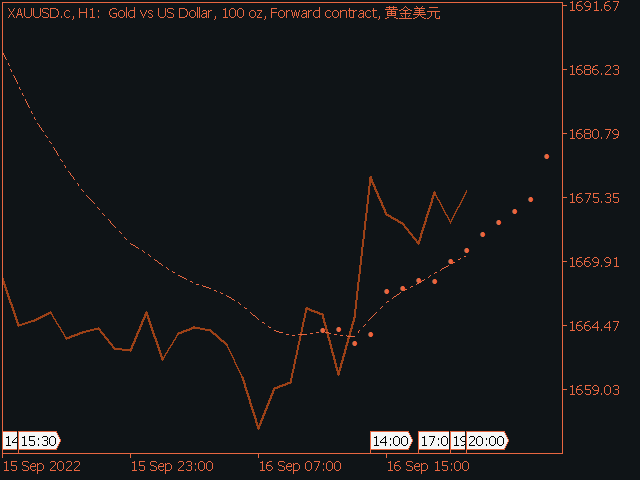
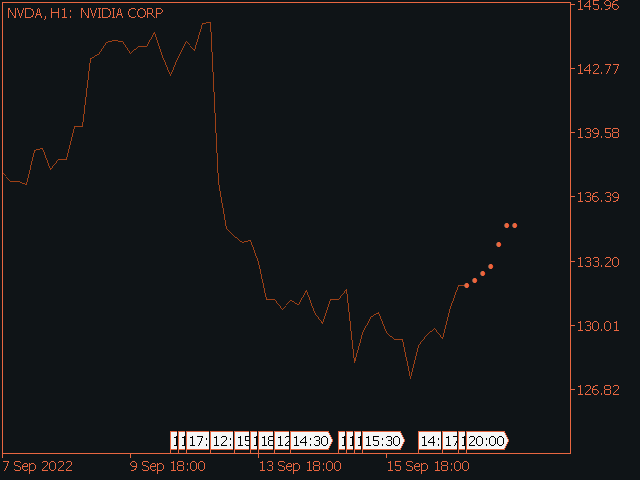
DALA Forecast is a universal tool for predicting the dynamics of time series of any nature. For prediction, modified methods of nonlinear dynamics analysis are used, on the basis of which a predictive model is built using machine learning methods. 

To get the trial version of the indicator, you can contact me in private messages.


How to use the indicator:

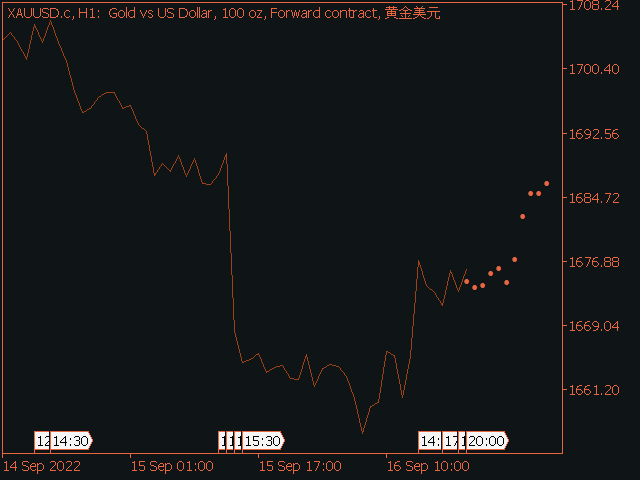
Apply the indicator to your chosen financial instrument or indicator with the settings you need.
The prediction will be displayed on the selected chart.
It is not recommended to apply the indicator directly to the chart of a financial instrument! The indicator should be applied to smoothed time series using moving average, decomposition, SSA or other "smoothing methods".

Indicator Parameters:

The correct choice of parameters significantly affects the accuracy of predictions!
The parameters of the indicator suggest changing the style and display parameters of the predicted values, as well as the parameters of the model used for training and forecasting:
  • Model settings:
1) Size of lag is an internal parameter of the model that determines the dimension of the lag space.

2) Number of neighbors - an internal parameter of the model that determines the number of neighbors to build a predictive model.

3) Size of timeseria used for model learning - the number of bars to train the model (0 - all bars).

4) Ignore last bar - whether to use the data of the last bar to build a prediction.

5) Use direct method - whether to use the direct method of making a forecast.

  • Plot settings:
1) Forecast horizon - the number of bars for which the system builds a prediction.

2) Start bar - indent in bars to start the forecast.
  • Lock code:
1) Code for unlocking high values - used to block the possibility of setting high values of model parameters for validation. To remove the restrictions, use the code: 111.
For my clients, I offer to pick up the parameters of the model for the financial instrument or indicator they are interested in for free.

Afterword:

Any of your questions and suggestions are welcome and can be sent in private messages.

Thank you in advance to all those interested, good luck in conquering the market!


Recommended products
Statistical Arbitrage Spread Generator for Cointegration [MT5] What is Pair Trading? Pair trading is a market-neutral strategy that looks to exploit the relative price movement between two correlated assets — instead of betting on the direction of the market. The idea? When two assets that usually move together diverge beyond a statistically significant threshold, one is likely mispriced. You sell the expensive one, buy the cheap one , and profit when they converge again. It’s a statistica
FREE
Follow The Line MT5
Oliver Gideon Amofa Appiah
4.52 (29)
This indicator obeys the popular maxim that: "THE TREND IS YOUR FRIEND" It paints a GREEN line for BUY and also paints a RED line for SELL. (you can change the colors). It gives alarms and alerts of all kinds. IT DOES NOT REPAINT and can be used for all currency pairs and timeframes. Yes, as easy and simple as that. Even a newbie can use it to make great and reliable trades. NB: For best results, get my other premium indicators for more powerful and reliable signals. Get them here: https://www.m
FREE
Free automatic Fibonacci is an indicator that automatically plots a Fibonacci retracement based on the number of bars you select on the BarsToScan setting in the indicator. The Fibonacci is automatically updated in real time as new highest and lowest values appears amongst the selected bars. You can select which level values to be displayed in the indicator settings. You can also select the color of the levels thus enabling the trader to be able to attach the indicator several times with differe
FREE
PZ Penta O MT5
PZ TRADING SLU
3.5 (4)
The Penta-O is a 6-point retracement harmonacci pattern which usually precedes big market movements. Penta-O patterns can expand and repaint quite a bit. To make things easier this indicator implements a twist: it waits for a donchian breakout in the right direction before signaling the trade. The end result is an otherwise repainting indicator with a very reliable trading signal. The donchian breakout period is entered as an input. [ Installation Guide | Update Guide | Troubleshooting | FAQ | A
FREE
The indicator highlights the points that a professional trader sees in ordinary indicators. VisualVol visually displays different volatility indicators on a single scale and a common align. Highlights the excess of volume indicators in color. At the same time, Tick and Real Volume, Actual range, ATR, candle size and return (open-close difference) can be displayed. Thanks to VisualVol, you will see the market periods and the right time for different trading operations. This version is intended f
FREE
Haven FVG Indicator
Maksim Tarutin
5 (3)
The   Haven FVG   indicator is a market analysis tool that highlights inefficiency areas (Fair Value Gaps, FVG) on the chart, providing traders with key levels for price analysis and decision-making. Other products ->  HERE Main Features: Customizable color settings: Color for Bullish FVG   (Bullish FVG Color). Color for Bearish FVG   (Bearish FVG Color). Flexible FVG visualization: Maximum number of candles for FVG detection. Additional extension of FVG zones by a specified number of bars. Opt
FREE
Are you tired of drawing trendlines every time you're analyzing charts? Or perhaps you would like more consistency in your technical analysis. Then this is for you. This indicator will draw trend lines automatically when dropped on a chart. How it works Works similar to standard deviation channel found on mt4 and mt5. It has 2 parameters: 1. Starting Bar 2. Number of bars for calculation The   starting bar   is the bar which drawing of the trend lines will begin, while the   number of bars for c
FREE
High Low Open Close
Alexandre Borela
4.98 (40)
If you like this project, leave a 5 star review. This indicator draws the open, high, low and closing prices for the specified period and it can be adjusted for a specific timezone. These are important levels looked by many institutional and professional traders and can be useful for you to know the places where they might be more active. The available periods are: Previous Day. Previous Week. Previous Month. Previous Quarter. Previous year. Or: Current Day. Current Week. Current Month. Current
FREE
Value Chart Candlesticks
Flavio Javier Jarabeck
4.75 (12)
The idea of a Value Chart indicator was presented in the very good book I read back in 2020 , " Dynamic Trading Indicators: Winning with Value Charts and Price Action Profile ", from the authors Mark Helweg and David Stendahl. The idea is simple and the result is pure genius: Present candlestick Price analysis in a detrended way! HOW TO READ THIS INDICATOR Look for Overbought and Oversold levels. Of course, you will need to test the settings a lot to find the "correct" one for your approach. It
FREE
The   "Haven Key Levels PDH PDL"   indicator helps traders visualize key levels on the chart. It automatically marks the following levels: DO (Daily Open)   — the daily open level. NYM (New York Midnight)   — the New York midnight level. PDH (Previous Day High)   — the previous day's high. PDL (Previous Day Low)   — the previous day's low. WO (Weekly Open)   — the weekly open level. MO (Monthly Open)   — the monthly open level. PWH (Previous Week High)   — the previous week's high. PWL (Previou
FREE
Indicator and Expert Adviser  EA Available in the comments section of this product. Download with Indicator must have indicator installed for EA to work. Mt5 indicator alerts for bollinger band and envelope extremes occurring at the same time. Buy signal alerts occur when A bullish candle has formed below both the lower bollinger band and the lower envelope  Bar must open and close below both these indicators. Sell signal occur when A bear bar is formed above the upper bollinger band and upper
FREE
The Trend Catcher: The Trend Catcher Strategy with Alert Indicator is a versatile technical analysis tool that aids traders in identifying market trends and potential entry and exit points. It features a dynamic Trend Catcher Strategy , adapting to market conditions for a clear visual representation of trend direction. Traders can customize parameters to align with their preferences and risk tolerance. The indicator assists in trend identification, signals potential reversals, serves as a trail
FREE
Important Lines
Terence Gronowski
4.86 (21)
This indicator displays Pivot-Lines, preday high and low, preday close and the minimum and maximum of the previous hour. You just have to put this single indicator to the chart to have all these important lines, no need to setup many single indicators. Why certain lines are important Preday high and low : These are watched by traders who trade in a daily chart. Very often, if price climbs over or falls under a preday low/high there is an acceleration in buying/selling. It is a breakout out of a
FREE
LT Donchian Channel
Thiago Duarte
4.83 (6)
Donchian Channel is an indicator created by Richard Donchian. It is formed by taking the highest high and the lowest low of the last specified period in candles. The area between high and low is the channel for the chosen period. Its configuration is simple. It is possible to have the average between the upper and lower lines, plus you have alerts when price hits one side. If you have any questions or find any bugs, please contact me. Enjoy!
FREE
ZP Day Trading Indicator in MT5 The ZP Day Trading Indicator is one of the tools developed based on Price Action trading style concepts in MetaTrader 5. This indicator uses color-coded boxes to identify Trading Ranges on the chart. A trading range forms when the price moves within a specific range between a resistance level (ceiling) and a support level (floor) over a period of time. In such scenarios, buyers and sellers reach equilibrium within the defined range. «Indicator Installation & User
FREE
Enhance your trading analysis with the Haiken Ashi MT5 indicator. This powerful tool transforms standard price data into smoother, trend-following candlesticks, making it easier to identify market trends and potential reversal points.    Key Features: Clear Trend Identification: Visually distinguish between uptrends and downtrends with distinct candle colors. Reduced Noise: Filter out price fluctuations, providing a clearer view of underlying market movements. Early Trend Detection: Anticipate
FREE
Mitimom
Danil Poletavkin
The indicator is based on Robert Miner's methodology described in his book "High probability trading strategies" and displays signals along with momentum of 2 timeframes. A Stochastic oscillator is used as a momentum indicator. The settings speak for themselves period_1 is the current timeframe, 'current' period_2 is indicated - the senior timeframe is 4 or 5 times larger than the current one. For example, if the current one is 5 minutes, then the older one will be 20 minutes The rest of the s
FREE
PZ Pivot Points MT5
PZ TRADING SLU
4.95 (21)
This indicator displays pivot points in the chart, including historical vales, and supports many calculation modes for Pivot Points and S/R levels. [ Installation Guide | Update Guide | Troubleshooting | FAQ | All Products ] It plots historical levels for backtesting purposes It allows you to select the reference timeframe It implements different Pivot Point calculation modes It implements different SR calculation modes It implements customizable colors and sizes Calculation Modes The indicato
FREE
Coral Indi
Dinh Duong Luong
Coral trend is   a trend-following indicator that is widely popular among FOREX traders . It is usually used as a confluence with other indicators. It uses combinations of moving averages with complex smoothing formulas! It has two configurable parameters: Coefficient   - smoothing ratio (*) Applied price Calculation: Coral = (-0.064) * B6 + 0.672 * B5 - 2.352 * B4 + 2.744 * B3
FREE
RSI abcd
Francisco Gomes Da Silva
3 (1)
RSI ABCD Pattern Finder: Technical Strategy 1. How the Indicator Works Combines the classic RSI with automatic detection of ABCD harmonic patterns . Key Components Standard RSI (adjustable period) Peak and Trough Markers (arrows) ABCD Patterns (green/red lines) Overbought (70) and Oversold (30) Filters 2. MT5 Setup period = 14 ; // RSI period size = 4 ; // Maximum pattern size OverBought = 70 ; // Overbought level OverSold = 30 ; // Oversold level Filter = USE_FILTER_ YES ; // Confirmation filte
FREE
Donchian Channel DC is the indicator of Donchian Channels, that plots maximum and minimum values of a specific period, besides mean value line. It´s possible to configure simple period for analysis and the indicator will plot all three values. You can trade with this indicator as trend or reversal, according to each strategy. Do not let to test others indicators as soon as others expert advisors.
Expansoes M
Marcus Vinicius Da Silva Miranda
The M Extensions are variations of the Golden Ratio (Fibonacci Sequence). It is the World's first technique developed for Candle Projections. Advantages: Easy to plot. Candle anchoring; High and accurate precision as support and resistance; Excellent Risk x Return ratio; Works in any timeframe; Works in any asset / market.   The M Extensions are classified into: M0: Zero point (starting candle) RC: Initial candle control region M1: Extension region 1 M2: Extension region 2 M3: Extension regi
FREE
TradeQL
Abdiel Aviles Jimenez
The TradeQL Indicator is a customizable tool that highlights specific trading patterns on candlestick charts. Users can define patterns through TradeQL queries, which the indicator then applies to the chart, visually representing matches and captured groups. Ideal for identifying complex trade setups in real-time. TradeQL queries are specified using the TradeQL Language. See https://github.com/abdielou/tradeql for more details. This language is expressed as a regular expression. The language al
FREE
Cumulative Delta MT5
Evgeny Shevtsov
4.53 (57)
The indicator analyzes the volume scale and splits it into two components - seller volumes and buyer volumes, and also calculates the delta and cumulative delta. The indicator does not flicker or redraw, its calculation and plotting are performed fairly quickly, while using the data from the smaller (relative to the current) periods. The indicator operation modes can be switched using the Mode input variable: Buy - display only the buyer volumes. Sell - display only the seller volumes. BuySell -
FREE
Waves Sizer
Flavio Javier Jarabeck
3.67 (6)
Wyckoff fans, enjoy! Ideally to be used with the Weis Waves indicator, but it can be easily used alone, the Waves Sizer puts the range (in resulting Price movement) done by the Price on its market swings. You can control how accurate or loose will be the swings. This tool is very helpful for visually know how much the Price has traveled in your Timeframe. This way you can confront this level of effort with the resulting Volume, etc... Weis Waves indicator: https://www.mql5.com/en/market/produc
FREE
The indicator identifies when a divergence occurs between price and an indicator or oscillator. It identifies both regular and hidden divergences. Combined with your own rules and techniques, this indicator will allow you to create (or enhance) your own powerful system. For higher probability setups I can recommend you to use my Supply Demand indicator and trade only if the divergence occurs inside a zone. Supply zone for bearish div and demand zone for bullish div. The optimal scenario is if it
FREE
Weis Waves
Flavio Javier Jarabeck
2.83 (18)
The original author is David Weis, an expert in the Wyckoff Method. The Weis Wave is a modern adaptation of the 1930's Wyckoff Method, another expert in Tape Reading techniques and Chart Analysis. Weis Waves takes market volume and stacks it into waves according to price conditions giving the trader valuable insights about the market conditions. If you want to learn more about this subject you can find tons of videos in YouTube. Just look for "The Wickoff Method", "Weis Wave" and "Volume Spread
FREE
Introduction This indicator detects volume spread patterns for buy and sell opportunity. The patterns include demand and supply patterns. You might use each pattern for trading. However, these patterns are best used to detect the demand zone (=accumulation area) and supply zone (=distribution area). Demand pattern indicates generally potential buying opportunity. Supply pattern indicates generally potential selling opportunity. These are the underlying patterns rather than direct price action. T
FREE
This indicator is especially for the binary trading. Time frame is 1 minutes and exp time 5 or 3 minutes only. You must be use martingale 3 step. So you must put lots size is 10 % at most. You should use Mt2 trading platform to connect with my indicator to get more signal without human working. This indicator wining rate is over 80% but you may get 100% of profit by using martingale 3 step. You should use MT2 Trading Platform to connect meta trader platform and binary platform . You can get mt2
FREE
This indicator is an automated version of the Fibonacci retracement (Fib) indicator. Deciding the best areas to use when drawing the fib can be tricky and this  indicator was made with that in mind. When you drop it on the chart it will automatically choose the best points to draw the fib with, but in case you aren't satisfied with those regions, you can adjust it as you wish.
FREE
Buyers of this product also purchase
Divergence Bomber
Ihor Otkydach
5 (38)
Each buyer of this indicator also receives the following for free: The custom utility "Bomber Utility", which automatically manages every trade, sets Stop Loss and Take Profit levels, and closes trades according to the rules of this strategy Set files for configuring the indicator for various assets Set files for configuring Bomber Utility in the following modes: "Minimum Risk", "Balanced Risk", and "Wait-and-See Strategy" A step-by-step video manual to help you quickly install, configure, and s
Algo Pumping
Ihor Otkydach
4.83 (18)
PUMPING STATION – Your Personal All-inclusive strategy Introducing PUMPING STATION — a revolutionary Forex indicator that will transform your trading into an exciting and effective activity! This indicator is not just an assistant but a full-fledged trading system with powerful algorithms that will help you start trading more stable! When you purchase this product, you also get FOR FREE: Exclusive Set Files: For automatic setup and maximum performance. Step-by-step video manual: Learn how to tr
Trend Screener Pro MT5
STE S.S.COMPANY
4.86 (86)
Unlock the Power of Trends Trading with the Trend Screener Indicator: Your Ultimate Trend Trading Solution powered by Fuzzy Logic and Multi-Currencies System! Elevate your trading game with the Trend Screener, the revolutionary trend indicator designed to transform your Metatrader into a powerful Trend Analyzer. This comprehensive tool leverages fuzzy logic and integrates over 13 premium features and three trading strategies, offering unmatched precision and versatility. LIMITED TIME OFFER : Tre
Grabber System MT5
Ihor Otkydach
5 (10)
Let me introduce you to an excellent technical indicator – Grabber, which works as a ready-to-use "All-Inclusive" trading strategy. Within a single code, it integrates powerful tools for technical market analysis, trading signals (arrows), alert functions, and push notifications. Every buyer of this indicator also receives the following for free: Grabber Utility for automatic management of open orders Step-by-step video guide: how to install, configure, and trade with the indicator Custom set fi
***  Entry In The Zone and SMC Multi Timeframe is a real-time market analysis tool developed based on the Smart Money Concepts (SMC) framework. It automatically analyzes reversal points and key zones across multiple timeframes, with a focus on providing no repaint signals and highlighting Points of Interest (POI). Additionally, it features an Auto Fibonacci Level system that automatically draws Fibonacci lines to help detect pullback and reversal points. This tool empowers traders to plan and m
How many times have you bought a trading indicator with great back-tests, live account performance proof with fantastic numbers and stats all over the place but after using it, you end up blowing your account? You shouldn't trust a signal by itself, you need to know why it appeared in the first place, and that's what RelicusRoad Pro does best! User Manual + Strategies + Training Videos + Private Group with VIP Access + Mobile Version Available A New Way To Look At The Market RelicusRoad is the
Gold Stuff mt5
Vasiliy Strukov
4.93 (187)
Gold Stuff mt5 is a trend indicator designed specifically for gold and can also be used on any financial instrument. The indicator does not redraw and does not lag. Recommended time frame H1. Contact me immediately after the purchase to get   personal bonus!  You can get a free copy of our Strong Support and Trend Scanner indicator, please pm. me! Settings  and manual   here  Please note that I do not sell my EA's or special sets on telegram, it is only available on Mql5 and my set files are on
FX Power MT5 NG
Daniel Stein
5 (17)
FX Power: Analyze Currency Strength for Smarter Trading Decisions Overview FX Power is your go-to tool for understanding the real strength of currencies and Gold in any market condition. By identifying strong currencies to buy and weak ones to sell, FX Power simplifies trading decisions and uncovers high-probability opportunities. Whether you’re looking to follow trends or anticipate reversals using extreme delta values, this tool adapts seamlessly to your trading style. Don’t just trade—trade
Support And Resistance Screener Breakthrough unique Solution With All Important levels analyzer and Markets Structures Feature Built Inside One Tool ! Our indicator has been developed by traders for traders and with one Indicator you will find all Imporant market levels with one click. LIMITED TIME OFFER : Support and Resistance Screener Indicator is available for only 50 $ and lifetime. ( Original price 125$ ) (offer extended) The available tools ( Features ) in our Indicator are :  1. HH-LL S
FX Volume MT5
Daniel Stein
4.84 (19)
FX Volume: Experience Genuine Market Sentiment from a Broker’s Perspective Quick Overview Looking to elevate your trading approach? FX Volume provides real-time insights into how retail traders and brokers are positioned—long before delayed reports like the COT. Whether you’re aiming for consistent gains or simply want a deeper edge in the markets, FX Volume helps you spot major imbalances, confirm breakouts, and refine your risk management. Get started now and see how genuine volume data can
Matrix Arrow Indicator MT5
Juvenille Emperor Limited
5 (14)
Matrix Arrow Indicator MT5  is a unique 10 in 1 trend following   100% non-repainting  multi-timeframe indicator that can be used on all symbols/instruments:   forex,   commodities,   cryptocurrencies,   indices,   stocks .  Matrix Arrow Indicator MT5  will determine the current trend at its early stages, gathering information and data from up to 10 standard indicators, which are: Average Directional Movement Index (ADX) Commodity Channel Index (CCI) Classic Heiken Ashi candles Moving Average
FX Levels MT5
Daniel Stein
5 (5)
FX Levels: Exceptionally Accurate Support & Resistance for All Markets Quick Overview Looking for a reliable way to pinpoint support and resistance levels across any market—currencies, indices, stocks, or commodities? FX Levels merges our traditional “Lighthouse” method with a forward-thinking dynamic approach, offering near-universal accuracy. By drawing from real-world broker experience and automated daily plus real-time updates, FX Levels helps you identify reversal points, set profit targe
MonetTrend — Премиум-индикатор для торговли по тренду (M30, H1, H4) MonetTrend — это мощный и визуально понятный трендовый индикатор, созданный для торговли на таймфреймах M30, H1 и H4. Он идеально подходит для работы с волатильными инструментами, такими как: • Золото (XAUUSD) • Криптовалюты (BTCUSD) • Валютные пары (EURUSD, USDJPY и др.) Ключевые особенности MonetTrend: • Автоматическое отображение Take Profit 1 (TP1) и Stop Loss (SL): После появления сигнала индикатор сразу показывает: • TP
The indicator highlights zones where interests are being declared then shows their accumulation zone. It works like an order book in big scale. This is the indicator for the biggest money. It's performance is exceptional. Whatever interest there is in the market you will see it. ( This is a fully rewritten, automated version—manual analysis is no longer required.)  The Transaction Speed is a new concept indicator that shows where and when large orders accumulates on the market and benefits o
Top indicator for MT5   providing accurate signals to enter a trade without repainting! It can be applied to any financial assets:   forex, cryptocurrencies, metals, stocks, indices .  Watch  the video  (6:22) with an example of processing only one signal that paid off the indicator! MT4 version is here It will provide pretty accurate trading signals and tell you when it's best to open a trade and close it. Most traders improve their trading results during the first trading week with the help of
IX Power MT5
Daniel Stein
4.88 (8)
IX Power: Unlock Market Insights for Indices, Commodities, Cryptos, and Forex Overview IX Power is a versatile tool designed to analyze the strength of indices, commodities, cryptocurrencies, and forex symbols. While FX Power offers the highest precision for forex pairs by leveraging all available currency pair data, IX Power focuses exclusively on the underlying symbol’s market data. This makes IX Power an excellent choice for non-forex markets and a reliable option for forex charts when deta
Black Dragon indicator mt5
Ramil Minniakhmetov
4.84 (62)
The trend detection indicator will compliment any strategy and can also be used as an independent tool. Be careful i not sell EA or sets at telegram it scam. All settings free here at   blog .  IMPORTANT! Contact me immediately after the purchase to get instructions and a bonus!  Benefits  Easy to use; does not overload the graphic wih unnecessary information. The ability to use as filter for any strategy. Contains bult -in dynamic levels of cupport and resistange,  which can be used both, for p
Enigmera MT5
Ivan Stefanov
3.67 (3)
ENIGMERA: The core of the market Introduction This indicator and trading system is a remarkable approach to the   financial markets . ENIGMERA uses the fractal cycles to accurately calculate support and resistance levels.   It shows the authentic accumulation phase and gives direction and targets.    A system that works whether we are in a trend or a correction.   How It Works Most of the indicator’s functionality is controlled through buttons on the left side of the chart, allowing rapid res
Quantum TrendPulse
Bogdan Ion Puscasu
5 (14)
Introducing Quantum TrendPulse , the ultimate trading tool that combines the power of SuperTrend , RSI , and Stochastic into one comprehensive indicator to maximize your trading potential. Designed for traders who seek precision and efficiency, this indicator helps you identify market trends, momentum shifts, and optimal entry and exit points with confidence. Key Features: SuperTrend Integration: Easily follow the prevailing market trend and ride the wave of profitability. RSI Precision: Detect
ACB Breakout Arrows MT5
KEENBASE SOFTWARE SOLUTIONS
5 (1)
The ACB Breakout Arrows indicator provides a crucial entry signal in the market by detecting a special breakout pattern. The indicator constantly scans the chart for a settling momentum in one direction and provide the accurate entry signal right before the major move. Get multi-symbol and multi-timeframe scanner from here - Scanner for ACB Breakout Arrows MT 5 Key features Stoploss   and Take Profit levels are provided by the indicator. Comes with a MTF Scanner dashboard which tracks the brea
IQ Gold Gann Levels a non-repainting, precision tool designed exclusively for XAUUSD/Gold intraday trading. It uses W.D. Gann’s square root method to plot real-time support and resistance levels, helping traders spot high-probability entries with confidence and clarity. William Delbert Gann (W.D. Gann) was an exceptional market analyst, whose trading technique was based on a complex blend of mathematics, geometry, astrology, and ancient mathematics which proved to be extremely accurate. Download
Bill Williams Advanced
Siarhei Vashchylka
5 (10)
Bill Williams Advanced is designed for automatic chart analysis using Bill Williams' "Profitunity" system. The indicator analyzes four timeframes at once. Manual (Be sure to read before purchasing) Advantages 1. Automatically analyzes the chart using the "Profitunity" system of Bill Williams. The found signals are placed in a table in the corner of the screen. 2. Equipped with a trend filter based on the Alligator indicator. Most of the system signals are recommended to be used only according t
Gartley Hunter Multi
Siarhei Vashchylka
5 (10)
Gartley Hunter Multi - An indicator for searching for harmonic patterns simultaneously on dozens of trading instruments and on all possible timeframes. Manual (Be sure to read before purchasing) | Version for MT4 Advantages 1. Patterns: Gartley, Butterfly, Shark, Crab. Bat, Alternate Bat, Deep Crab, Cypher 2. Simultaneous search for patterns on dozens of trading instruments and on all possible timeframes 3. Search for patterns of all possible sizes. From the smallest to the largest 4. All fou
Multi Currency Multi Time Market Scan Signals It is an Advanced multi-utility dashboard which works with full customization of signal settings and graphical interface. It works with Multi Symbols and Multi-Time frames from 1 SINGLE CHART TEMPLATE. It will automatically open the charts where the latest signals had formed- showing the important levels (Entry, Targets, Stop Loss) Many types of sorting methods for the scanner. A robust ENTRY based on  TREND OF MULTI-TIME FRAMES ( Complex Signals
FX Dynamic MT5
Daniel Stein
5 (1)
FX Dynamic: Track Volatility and Trends with Customized ATR Analysis Overview FX Dynamic is a powerful tool that leverages Average True Range (ATR) calculations to give traders unparalleled insights into daily and intraday volatility. By setting up clear volatility thresholds—such as 80%, 100%, and 130%—you can quickly identify potential profit opportunities or warnings when markets exceed typical ranges. FX Dynamic adapts to your broker’s time zone, helps you maintain a consistent measure of
TPSpro RFI Levels MT5
Roman Podpora
4.55 (20)
Reversal zones / Peak volumes / Active zones of a major player =  TS TPSPROSYSTEM INSTRUCTIONS RUS  /  INSTRUCTIONS   ENG          /       Version MT4 Every buyer of this indicator additionally receives FREE: 3 months of access to trading signals from the RFI SIGNALS service - ready-made entry points according to the TPSproSYSTEM algorithm. Training materials with regular updates - immerse yourself in strategy and grow your professional level. 24/5 support on weekdays and access to a closed tra
Easy Buy Sell is a market indicator for opening and closing positions. It becomes easy to track market entries with alerts. It indicates trend reversal points when a price reaches extreme values ​​and the most favorable time to enter the market. it is as effective as a Fibonacci to find a level but it uses different tools such as an algorithm based on ATR indicators and Stochastic Oscillator. You can modify these two parameters as you wish to adapt the settings to the desired period. It cannot
Trend Forecaster
Alexey Minkov
5 (7)
The Trend Forecaster indicator utilizes a unique proprietary algorithm to determine entry points for a breakout trading strategy. The indicator identifies price clusters, analyzes price movement near levels, and provides a signal when the price breaks through a level. The Trend Forecaster indicator is suitable for all financial assets, including currencies (Forex), metals, stocks, indices, and cryptocurrencies. You can also adjust the indicator to work on any time frames, although it is recommen
TPSproTREND PrO MT5
Roman Podpora
4.72 (18)
Entry points at the bar close,  without redrawing .  Trend scanner  across all assets,  MTF - mode  and much more in one tool. We recommend using it together with   RFI LEVELS. ИНСТРУКЦИЯ RUS   /   INSTRUCTIONS  ENG         /         VERSION MT4   Main functions: Accurate entry signals WITHOUT REPAINTING! Once a signal appears, it remains valid! This is a significant distinction from repainting indicators that might provide a signal and then alter it, potentially leading to deposit losses. Now,
Kecia Footprint Orderflow
Niccolo Filippo Palombi
5 (2)
if you want to test it : private message me ( MT5 demo testing doesn't work ) Designed to help traders gain a deeper understanding of the market’s true order flow dynamics . By visualizing the “ footprints ” left by candles, this indicator reveals how the delta ( the difference between buying and selling pressure ) changes during the candle formation, as well as how volume fluctuates at different price levels. These insights are essential for traders seeking to identify reversals, breakouts, and
More from author
SRL Edson Gould
Grigorii Matsnev
5 (3)
Speed resistance lines are a powerful tool for determining trend and resistance lines. The indicator builds lines using chart extremes and special mathematical formulas. The indicator can be used to determine the trend direction and pivot points. <----------------------------> Indicator Parameters: "Depth of search" - depth (in bars) of the search for chart extremes "Back step of search" - minimum distance (in bars) between extremes "Deviation of price" - permissible price difference between
FREE
Correction Breakthrough
Grigorii Matsnev
5 (1)
Correction Breakthrough is a powerful tool for detecting possible breakout points from a correction or trading corridor, based on the analysis of price formations and the inertia of price movements. _________________________________ How to use the indicator signals: The indicator generates a signal during the current price bar. It is recommended to use the generated signal after closing the signal bar above/below the signal arrow.  The indicator does not redraw its signals. ________________
FREE
Acceleration Points is a powerful tool for detecting critical points of price movement, based on the idea of calculating the acceleration of price fluctuations.  _________________________________ How to use the indicator signals: The indicator generates a signal after a new price bar appears. It is recommended to use the generated signal after the price breaks through the critical point in the specified direction. The indicator does not redraw its signals. _________________________________
FREE
Momentum Reversal
Grigorii Matsnev
4.5 (2)
Momentum Reversal is a powerful tool for detecting possible reversal points and the beginning of correction, based on the analysis of the intensity of price movements and bar formations. _________________________________ How to use the indicator signals: The indicator generates a signal after a new price bar appears. It is recommended to use the generated signal after the price breaks through the critical point in the specified direction. The indicator does not redraw its signals. _________
FREE
Market Palette
Grigorii Matsnev
Market Palette is a powerful tool for filtering trading decisions based on inertia and acceleration of price fluctuations. _________________________________ How to use the indicator signals: The indicator generates histogram signals in three different colors. In the standard color scheme, when blue columns appear, it is recommended to keep only long positions, when red columns appear, only short ones, and when gray columns appear, refrain from trading actions. The appearance of higher column
FREE
Speed resistance lines are a powerful tool for determining trend and resistance lines. The indicator builds lines using chart extremes and special mathematical formulas. The indicator can be used to determine the trend direction and pivot points. <----------------------------> Indicator Parameters: "Depth of search" - depth (in bars) of the search for chart extremes "Back step of search" - minimum distance (in bars) between extremes "Deviation of price" - permissible price difference between
FREE
Points of Inertia is a powerful tool for detecting critical points of price movement, based on the idea of calculating the inertia of price fluctuations.  _________________________________ How to use the indicator signals: The indicator generates a signal after a new price bar appears. It is recommended to use the generated signal after the price breaks through the critical point in the specified direction. The indicator does not redraw its signals. _________________________________ The in
FREE
Filter:
No reviews
Reply to review
Version 1.1 2022.09.23
1) Added indirect forecasting mode
2) Optimized standard indicator settings
3) Improved performance