Master Calendar Osw
- Indicators
-
William Oswaldo Mayorga Urduy
 MQL4 and MQL5 trader and developer since February 2019, delivering projects in under one day and providing post-delivery technical support.
Optimized code, advanced logic, and high-quality code. - Version: 2.1
- Updated: 9 November 2024
- Activations: 5
Professional User Manual: Master Calendar OSW
This manual is designed to help you fully understand how Master Calendar OSW works. It's a high-performance fundamental analysis console that integrates the economic calendar directly into your MetaTrader platform. The system not only displays data but also interprets currency health and institutional liquidity cycles.
1. Introduction and System Purpose
Master Calendar OSW is a market context tool. Its purpose is to prevent you from trading blindly in the face of macroeconomic events and to help you capitalize on expansionary movements that occur during the opening of major financial markets.
Unlike other indicators, this system uses an advanced charting engine that allows you to move, minimize, and manage information without hindering your technical price analysis.
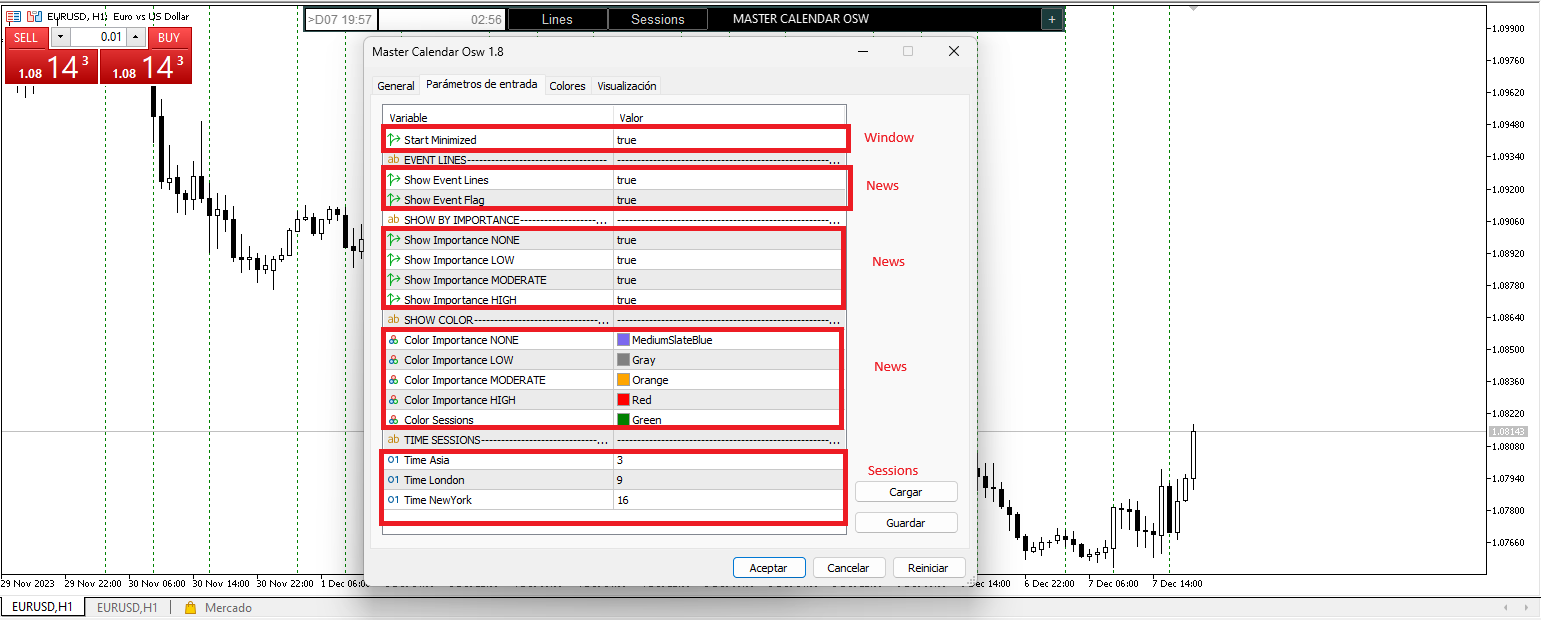
2. Parameter Guide (Entry Menu)
When you load the indicator, you'll find the following options to customize your trading environment:
Display and Event Settings
InitMIN (Start Minimized): Defines whether the panel appears collapsed upon startup. Ideal for keeping the chart clean from the very first second.
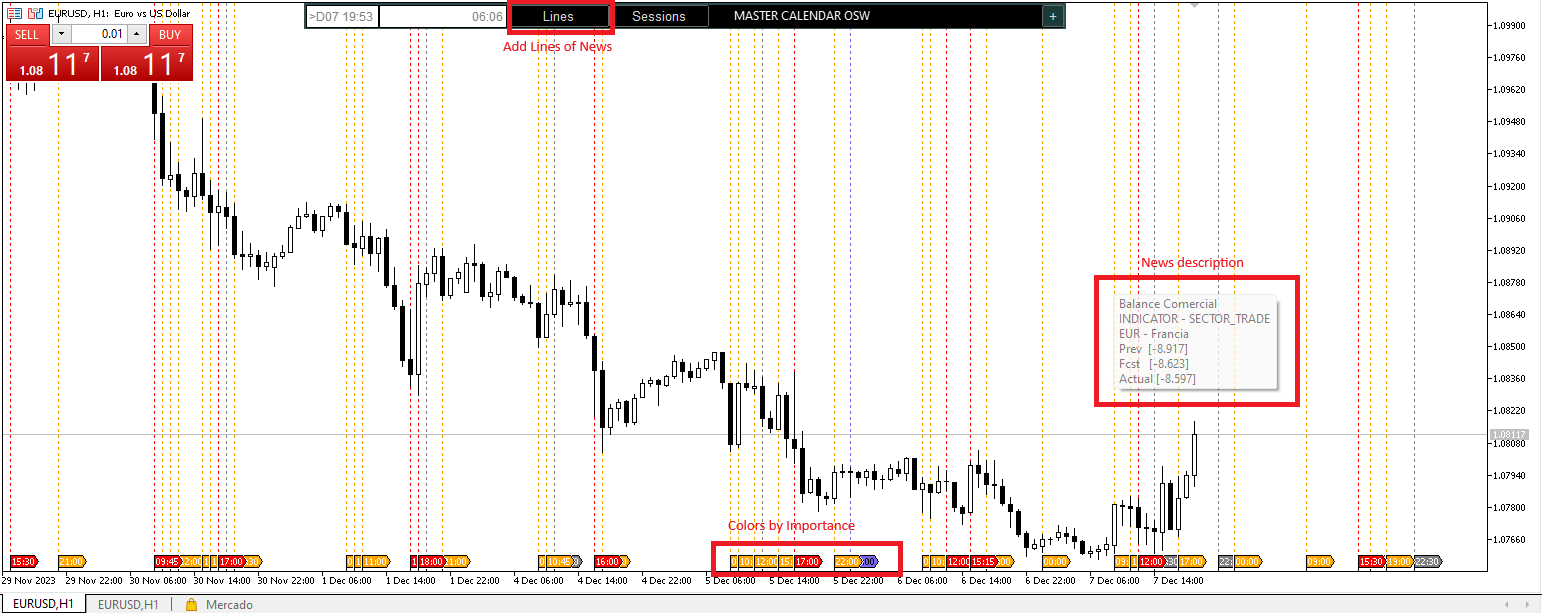
Show Event Lines: Activates automatic vertical lines that mark the exact moment of an economic release.
Show Flag Event: Displays informative icons or "flags" at the bottom of the chart.
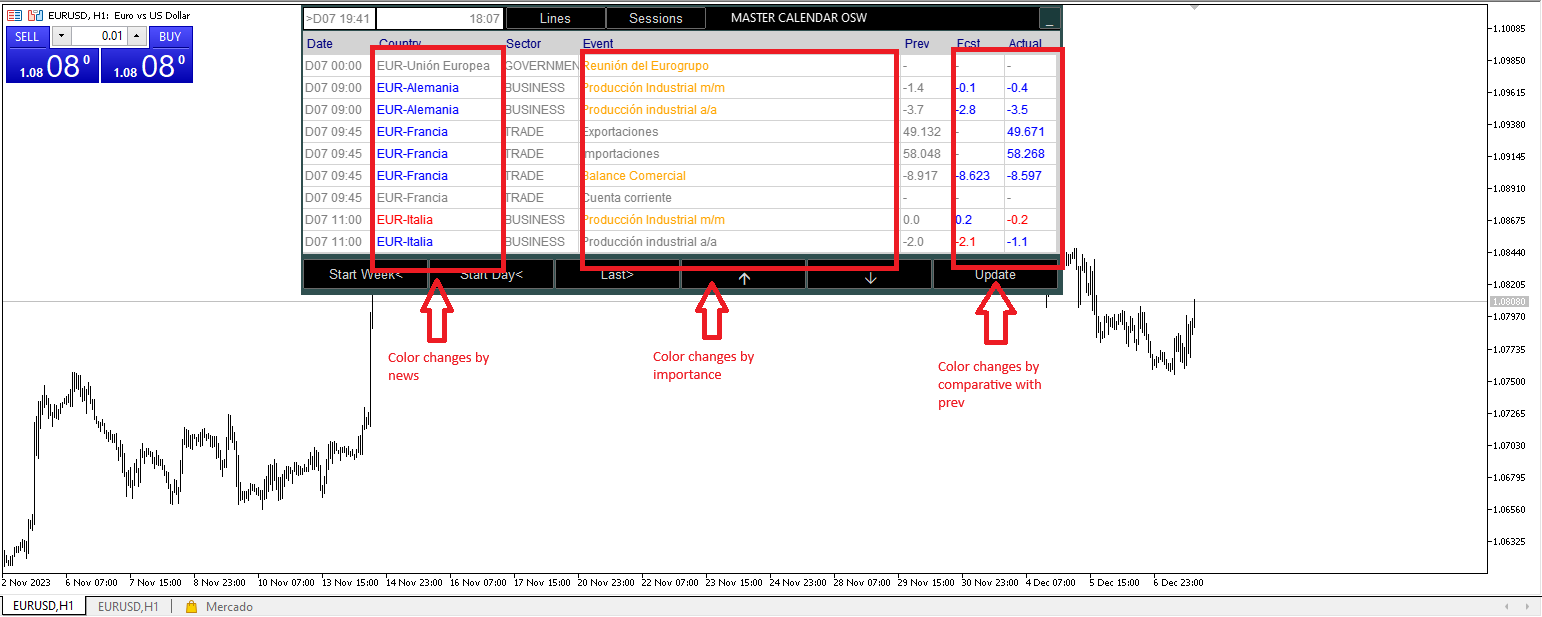
Importance and Color Filters
You can filter which news to see based on its expected impact (NONE, LOW, MODERATE, HIGH).
Color Importance: Customize the colors for each impact level. By default, Red (High) indicates events of maximum volatility (such as interest rate decisions or employment data).
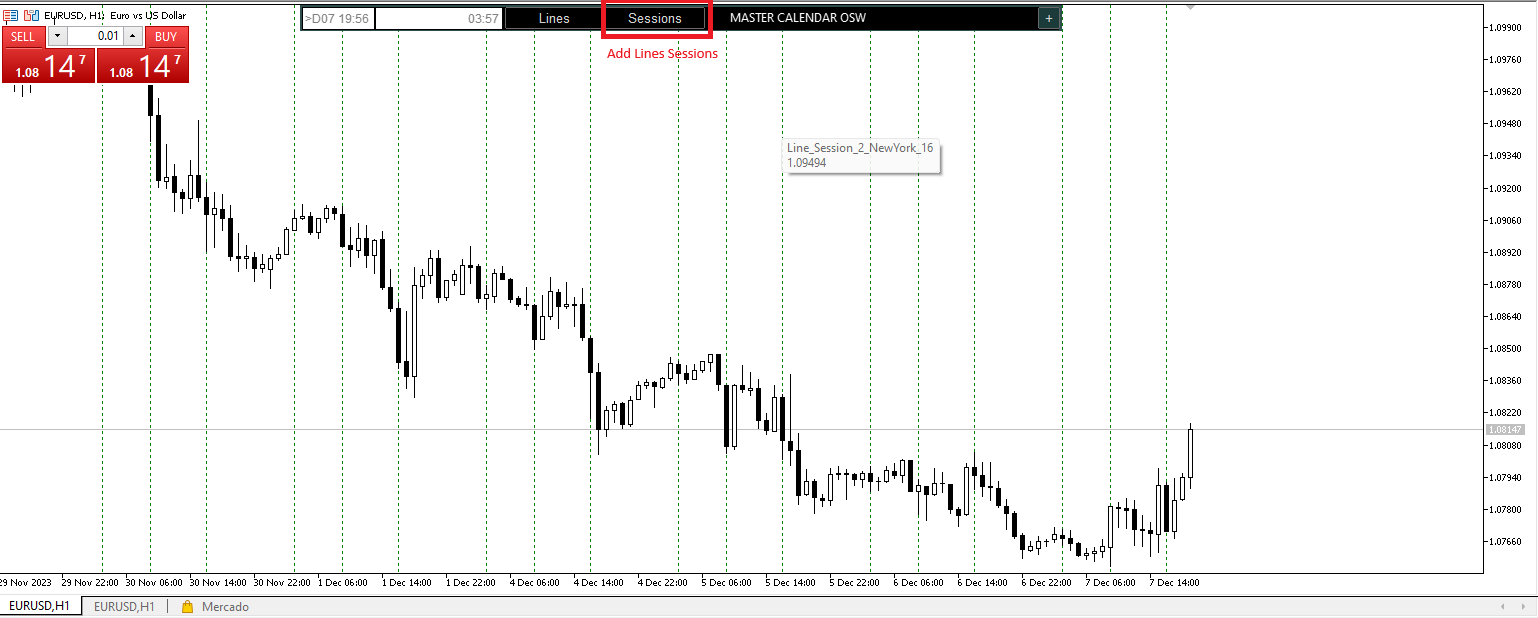
Color Sessions: Define the color of the lines that delimit trading days.
Time Session Management
Time Asia / London / New York: Configure the start time of each session according to your broker's clock (Market Watch). This is vital for identifying "turning points" and professional volume entry.
3. Graphical Interface and Control Panel
The panel features dynamic rendering technology that allows for smooth interaction:
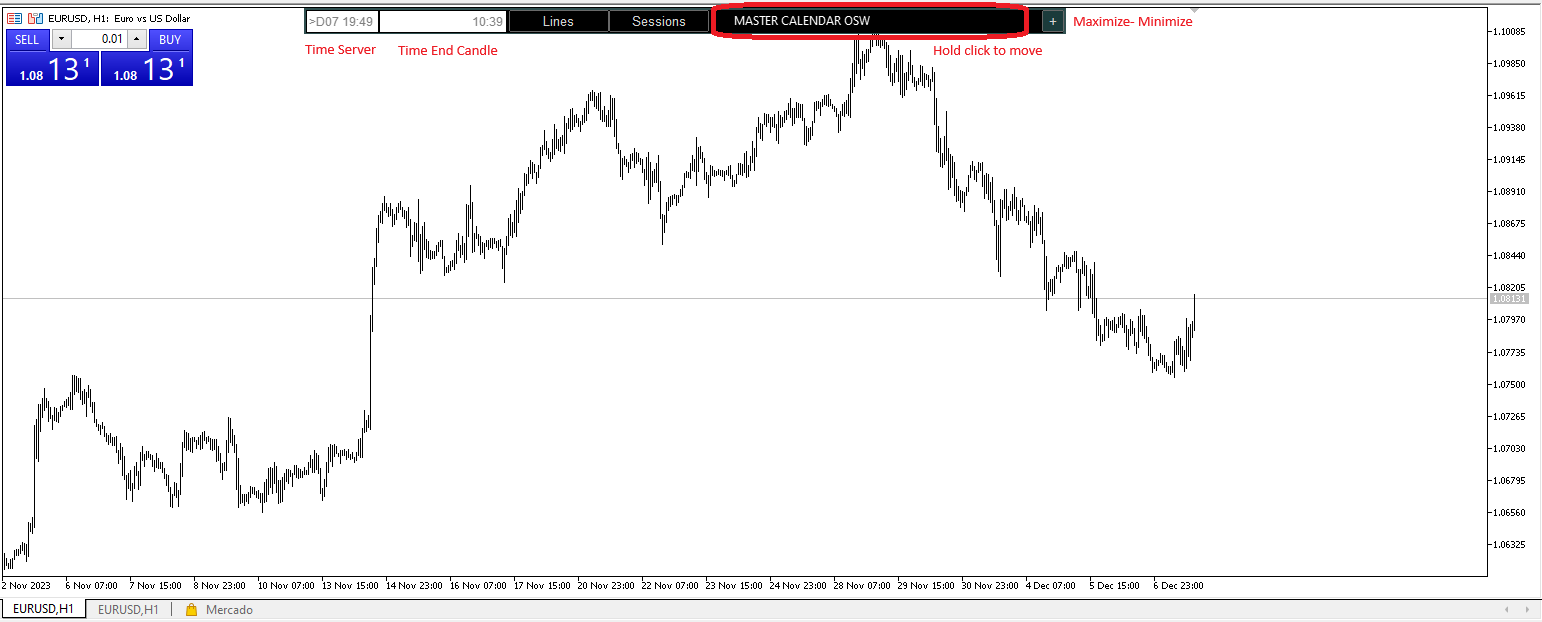
Title Bar and Window Management
Free Movement: Click and drag the top bar ("MASTER CALENDAR OSW") to position the panel anywhere on the screen.
Minimize (-): Collapses the panel, showing only the title bar and clocks.
Close (X): Removes the indicator and all its graphical objects from the current chart.
Clocks and Timekeeping
Located in the upper left corner, the panel displays:
Server Date: The exact date of your trading platform.
Candle Clock: Shows the time remaining until the current candle closes (essential for confirming entries on timeframes such as M15 or H1).
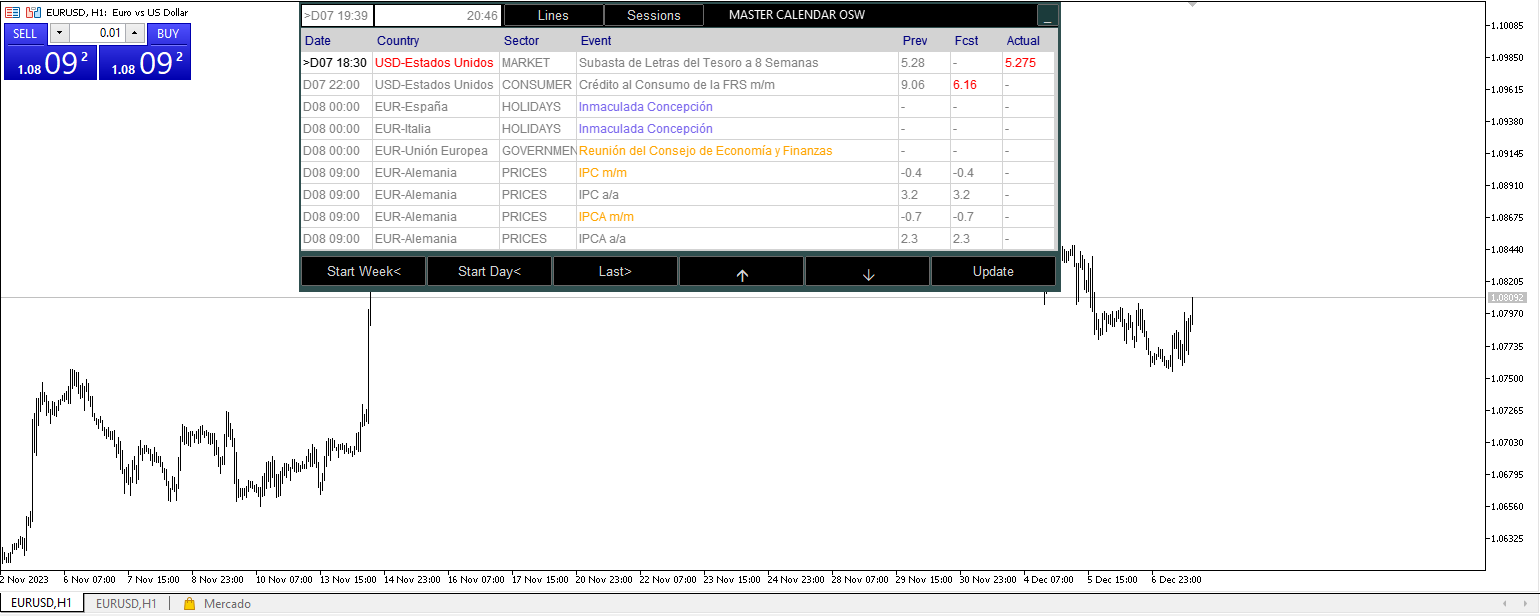
4. Table Interpretation and Color Logic
The heart of the indicator is its ability to provide instant visual analysis through automatic color changes:
Economic Data Logic (Prev/Fcst/Actual)
The system compares the current result with the previous data to measure the currency's health:
Blue (Favorable): The current value is higher than the previous value. This indicates potential strengthening.
Red (Unfavorable): The current value is lower than the previous value. This indicates potential weakness.
Gray (Neutral): There are no significant changes, or the data matches the previous value.
Currency and Country Identification
If news strengthens a currency, the country and currency names will turn blue. If it weakens it, they will turn red. This allows you to know, without reading the news item's name, what impact it is having on the pair you are trading.
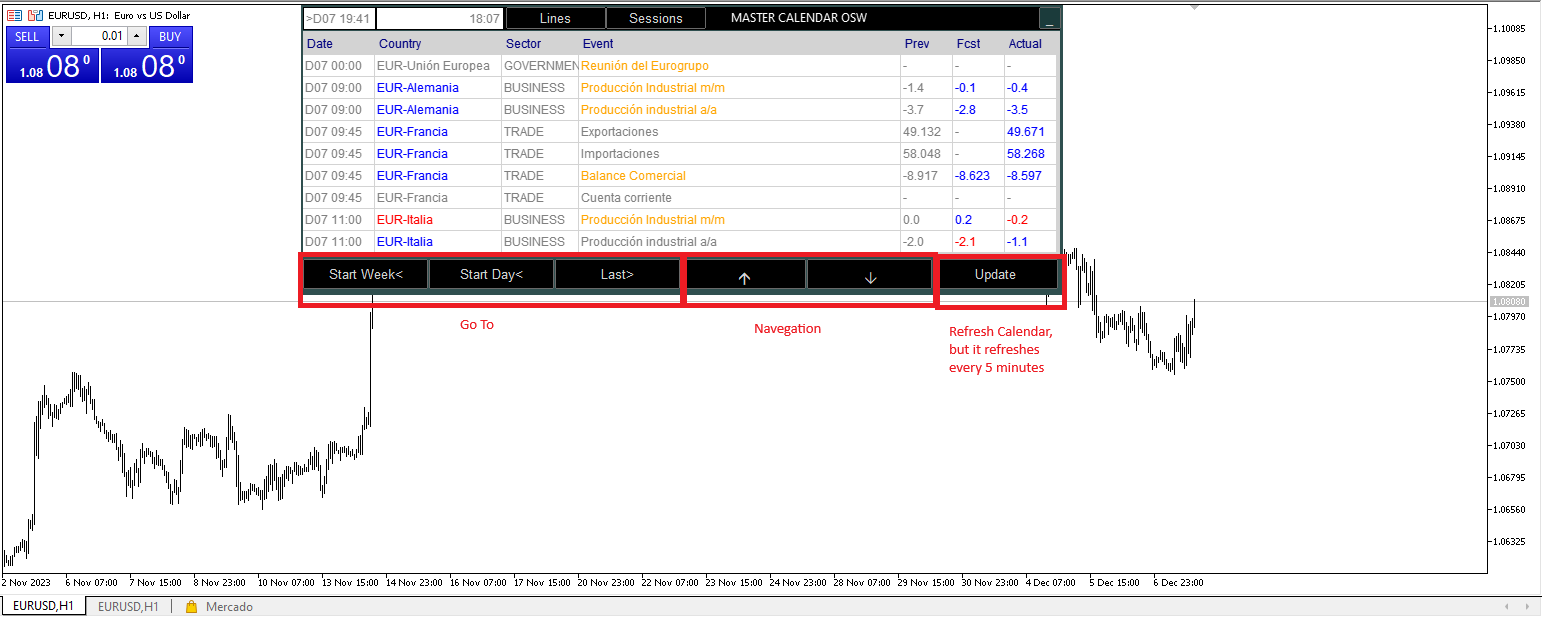
5. Button and Operation Guide
The panel includes a bottom button bar for navigating the market history and future data:
Lines: Activates/Deactivates the vertical news lines on the chart. Hovering over them will display a tooltip with all the event details.
Sessions: Shows or hides the opening lines for Asia, London, and New York.
Arrows: Activates visual price signals. If the data is very positive, you will see a buy arrow; if it is very negative, a sell arrow.
Start Week / Start Day: Automatically jumps to the first event of the week or the current day.
Last: Takes you to the most recent news item.
Up / Down: Allows you to scroll row by row to study past or future events.
Update: Forces a manual data update from the server (the system updates automatically every 5 minutes by default).
6. Trading Recommendations
Session Confluence: Look to trade High Impact news (Red) that occurs during the London or New York opening. These are the times with the highest probability of success.
Using Pop-Up Help: If you have questions about a news item, hover your mouse over the vertical line on the chart. The system will show you the country, its importance, and the values (Prev/Fcst/Actual) in a pop-up window.
Tem