SORS Osw
- Indicators
-
William Oswaldo Mayorga Urduy
 MQL4 and MQL5 trader and developer since February 2019, delivering projects in under one day and providing post-delivery technical support.
Optimized code, advanced logic, and high-quality code. - Version: 2.7
- Updated: 28 July 2024
- Activations: 5
User Manual: SORS Dynamic Levels System
The SORS Indicator is a high-precision tool designed to project key support and resistance levels in real time. It uses Standard Deviation (Endogenous Volatility) to calculate expansion ranges based on the opening price of critical time cycles. Its objective is to identify areas of exhaustion or acceleration, allowing the trader to operate with a mathematical roadmap.
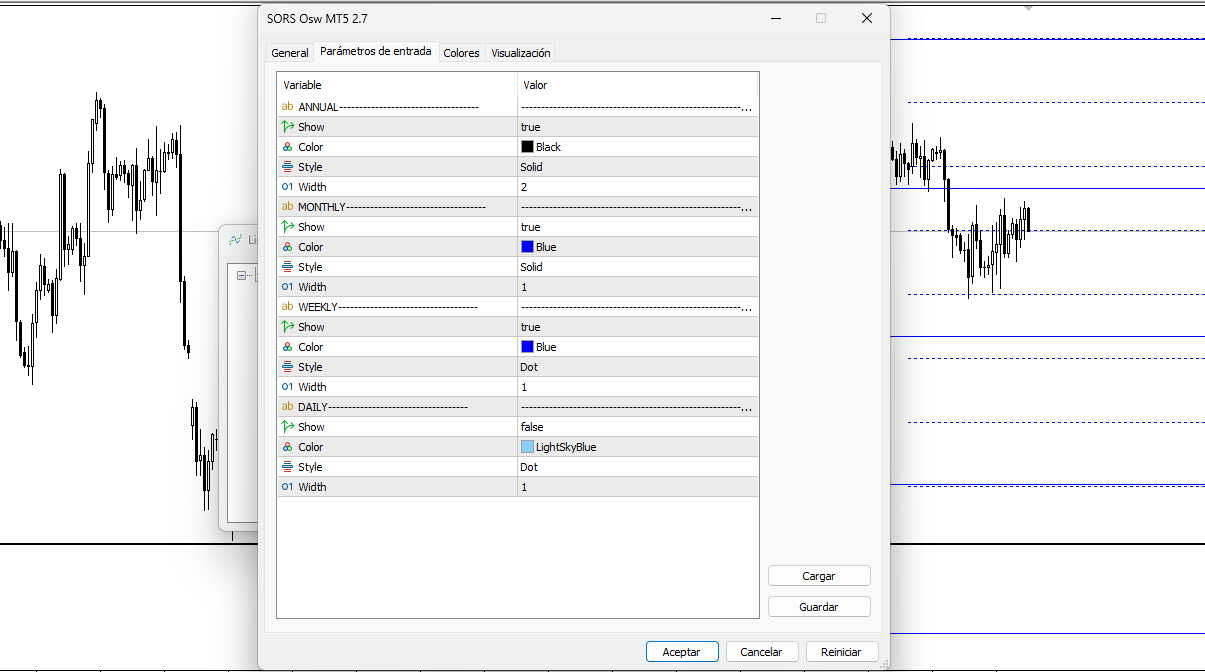
Parameter Guide (Entry Menu)
The menu allows you to customize the visibility and appearance of each trading cycle:
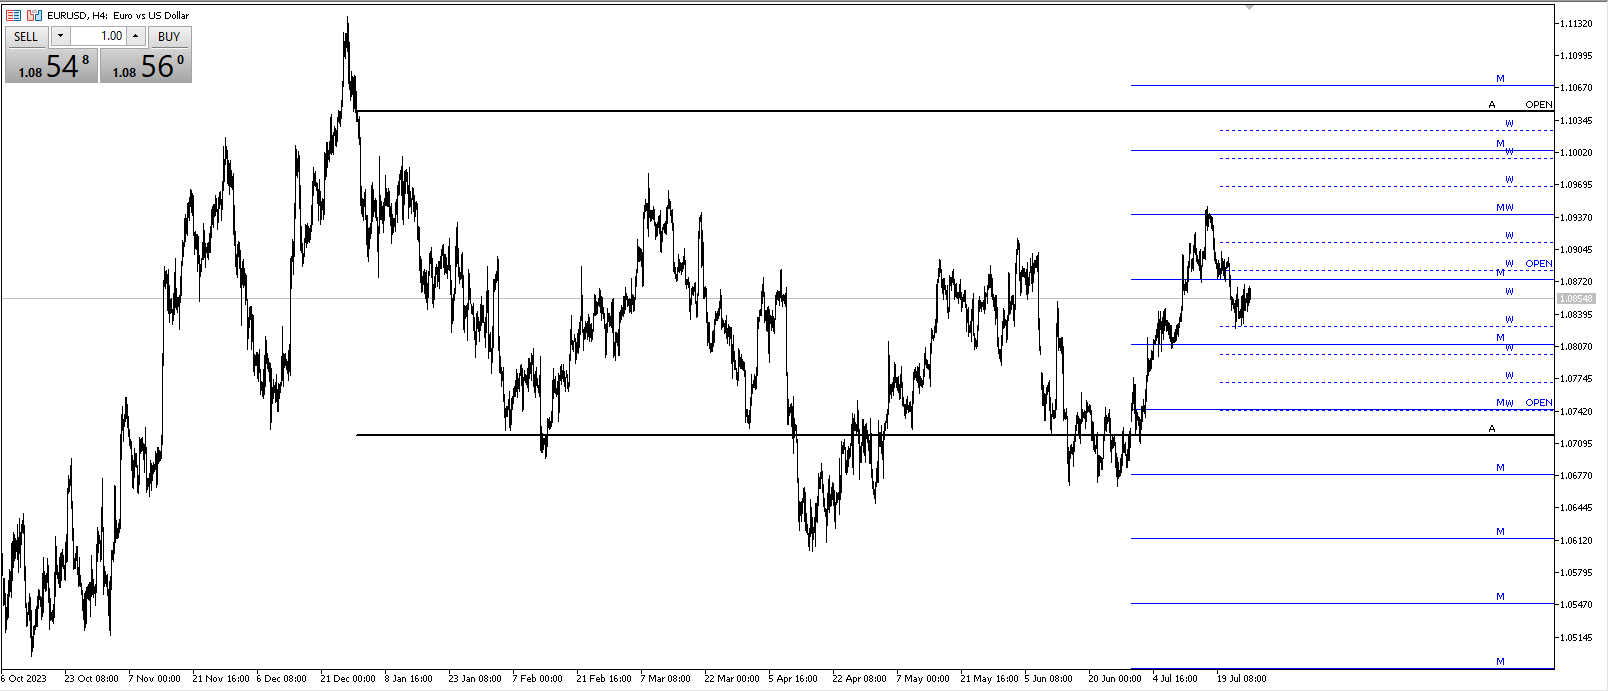
Annual Setting (ANNUAL): Controls levels based on the year's opening price. Ideal for identifying long-term macroeconomic bias.
Monthly Setting (MONTHLY): Projects ranges from the first day of the month. This is the basis for position trading.
Weekly Setting (WEEKLY): Defines levels from Monday's opening price. Crucial for intraday and swing trading.
Daily Settings: Displays the volatility of the current session (disabled by default for visual clarity).
For each cycle, the user can adjust:
Show: Enable/Disable the level.
Color / Style / Width: Customize the tone, line type, and thickness to differentiate time hierarchies.
Visual and Operational Interpretation
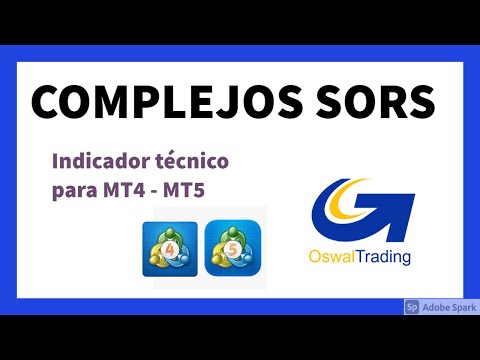
When SORS is installed, you will see horizontal levels projected from the beginning of each period:
OPEN Level: This is the equilibrium price for the period. If the price trades above it, the bias is bullish; below it, it is bearish.
Expansion Levels: These are overbought (above) and oversold (below) zones calculated based on volatility.
Reversal Zones: The extreme levels (levels 3 to 5) typically act as barriers where the price tends to correct towards the OPEN level.
Continuation Zones: A solid breakout from levels 1 or 2 indicates a strong trend toward the next range.
Usage Recommendations
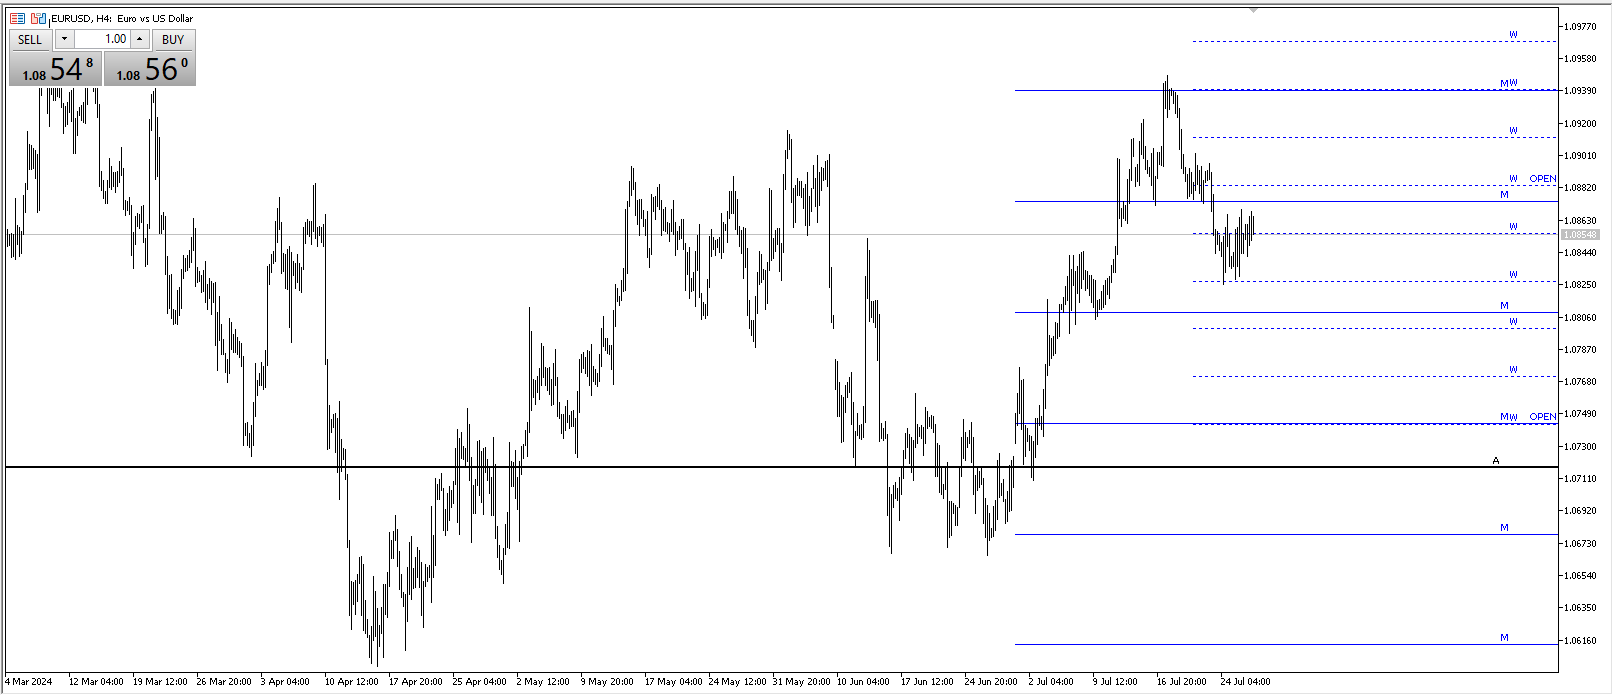
Confluence: The strongest signal occurs when a weekly level coincides with a monthly or yearly level. These "double barrier" zones offer high-probability entries.
Assets: Optimized for Forex (Major Pairs), Gold (XAUUSD), and Indices.
Timeframes: Perform analysis on the H4 chart to see the big picture and execute trades on the M15 or H1 chart using the levels as take-profit targets or entry zones.