Levels of Timeframes

5
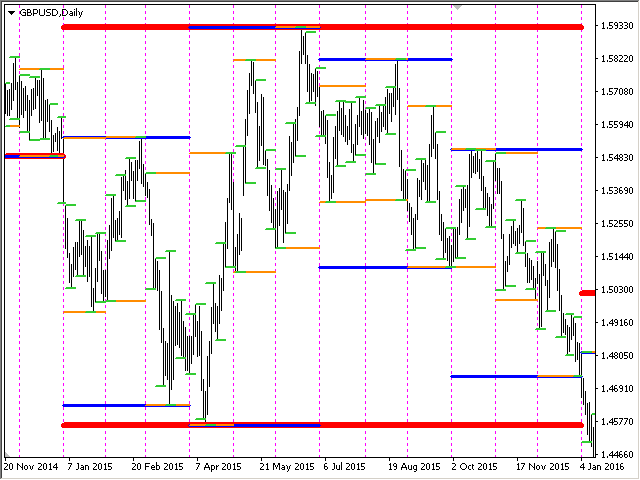
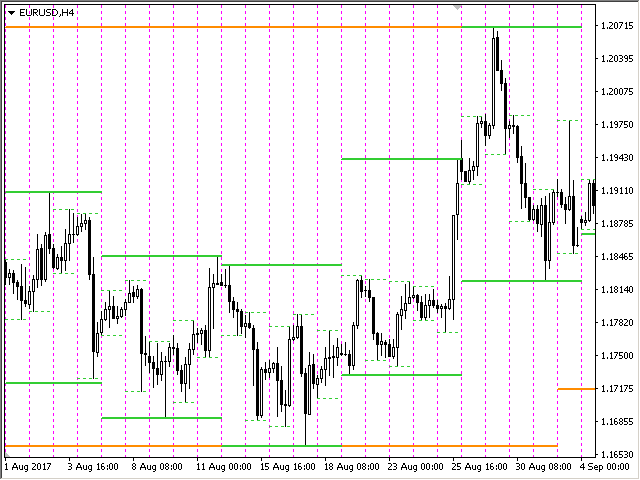
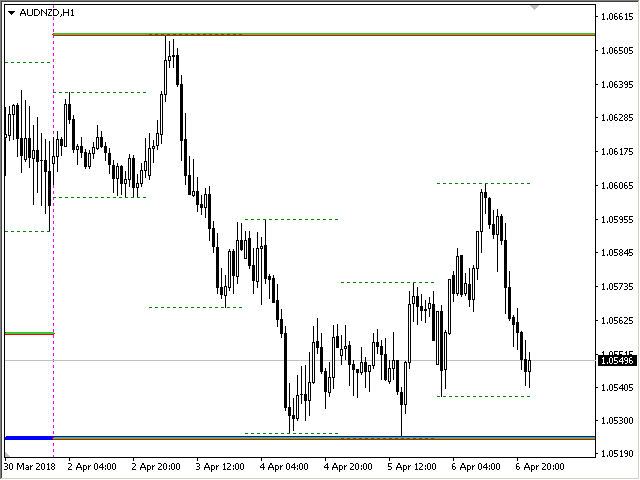
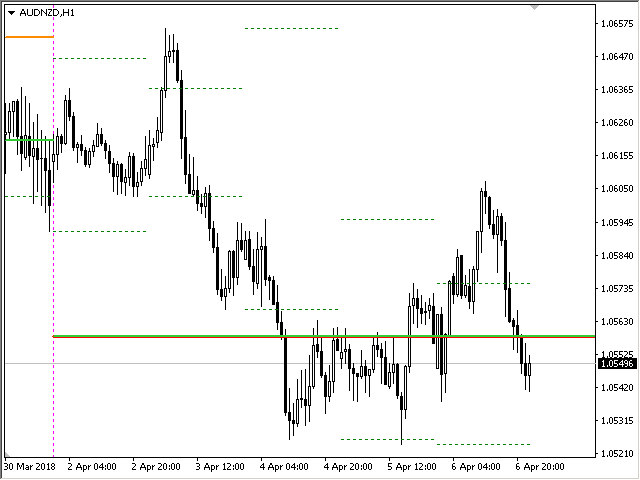
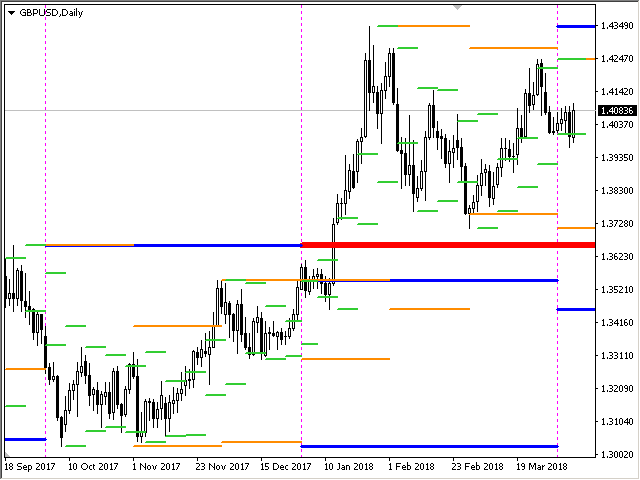
L'indicateur affiche les niveaux haut/bas/ouverture/fermeture à partir d'autres périodes (et non standard) : année, 6 mois, 4 mois, 3 mois, 2 mois, mois, semaine, jour, heures H3-H6-H8-H12. . Vous pouvez également définir le décalage d'ouverture des bougies et créer des bougies virtuelles.
Des « séparateurs de périodes » pour l'une de ces périodes sont disponibles sous forme de lignes verticales. Des alertes peuvent être configurées pour les cassures des niveaux actuels ou précédents (rupture de la ligne HIgh/Low hier/dernière semaine, etc.).
Vous pouvez également décaler tous les niveaux d’un point vers la droite. Autrement dit, le haut/bas de la période précédente sera affiché sur la période actuelle


Paramètres

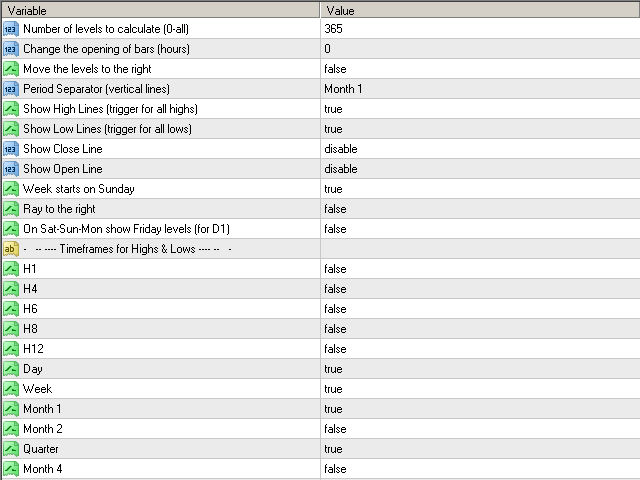
Number of levels to calculate (0-all) — combien de barres seront affichées à l'écran.
Change the opening of bars (hours) — décalez l'ouverture des bougies de n heures. L'indicateur dessinera des barres virtuelles en tenant compte de la nouvelle heure d'ouverture. Les périodes supérieures à MN1 ne changent pas.
Move the levels to the right — déplace tous les niveaux d'une barre vers la droite. Vous verrez les niveaux précédents sur la bougie actuelle.
Period Separator (vertical lines) — affiche une ligne verticale, séparateur de points.
Show High Lines (trigger for all highs) — désactive ou active le dessin des niveaux élevés.
Show Low Lines (trigger for all lows) — désactive ou active le dessin des niveaux bas.
Show Open Line — période pendant laquelle la ligne de prix ouverte sera tracée. Vous pouvez sélectionner « All TF for Highs & Lows » et les niveaux seront dessinés en fonction des périodes spécifiées pour le High-Low.
Draw Open Line immediately when a new bar appears.
Show Close Line — période pour laquelle la ligne de prix de clôture sera tracée. Vous pouvez sélectionner « All TF for Highs & Lows » et les niveaux seront dessinés en fonction des périodes spécifiées pour le High-Low.
Week starts on Sunday — dans le terminal, par défaut, les bougies W1 commencent le dimanche. Si la valeur est « false », la semaine commencera le lundi.

Show levels (Afficher les niveaux)
from H1 to Year — affiche les niveaux les plus bas des périodes sélectionnées. Année, 6 mois, 4 mois, 3 mois, 2 mois, mois, semaine, jour, 4-6-8-12 heures
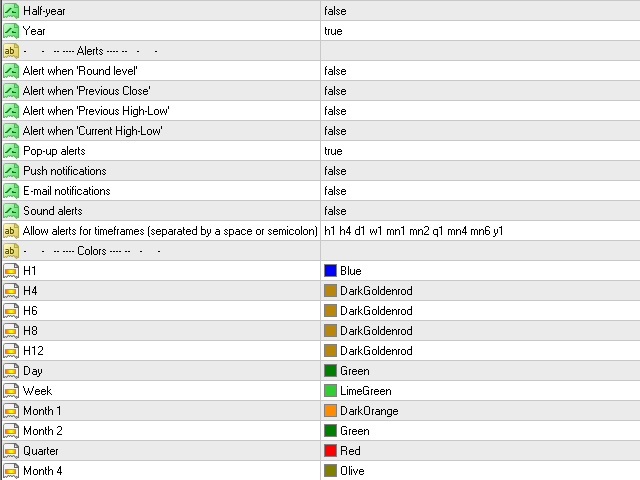
Alerts (Alertes)
Alert when 'Round level' — envoie une alerte lorsque le prix atteint un niveau rond.
Alert when 'Current Highs-Lows' — envoient une alerte lorsque le prix atteint les niveaux actuels.
Alert when 'Previous High-Low' — envoie une alerte lorsque le prix atteint les niveaux précédents.
Pop-up alerts — Alertes contextuelles.
Push notifications — Notifications push.
E-mail notifications — Notifications par email.
Sound alerts — Alertes sonores.
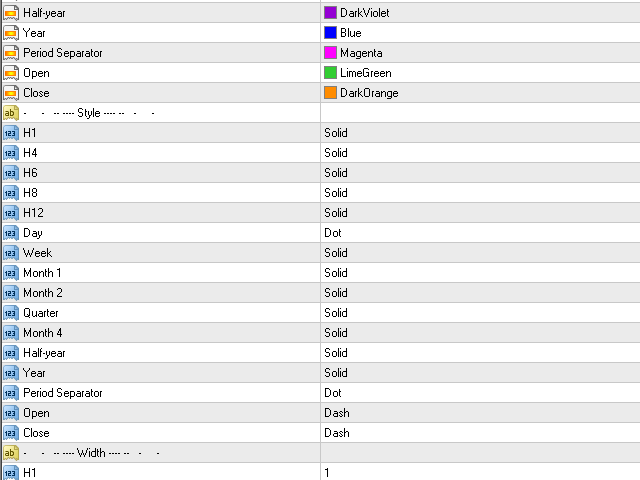
Colors (Couleurs)
from M45/M90 to Year — ajustement des couleurs pour les lignes de période.
Period Separator — couleur des lignes de séparation des périodes.

Line style (Style de ligne)
from M45 to Year — style de ligne de période.
Period Separator — style des lignes de séparation des périodes.

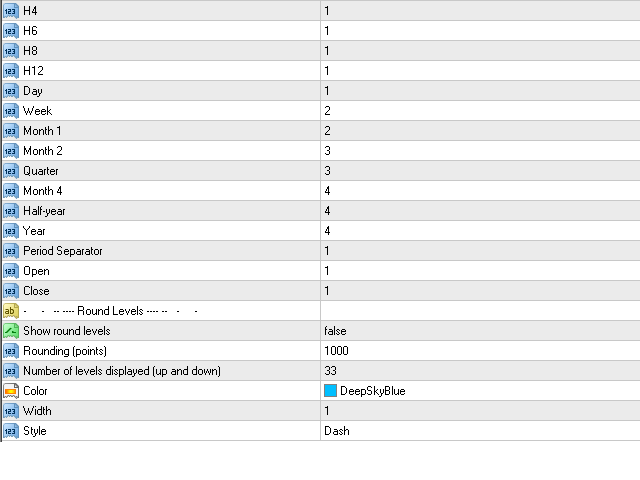
Line width (Largeur de ligne)
from M45 to Year — largeur de ligne de période.
Period Separator — largeur des lignes de séparation des périodes.

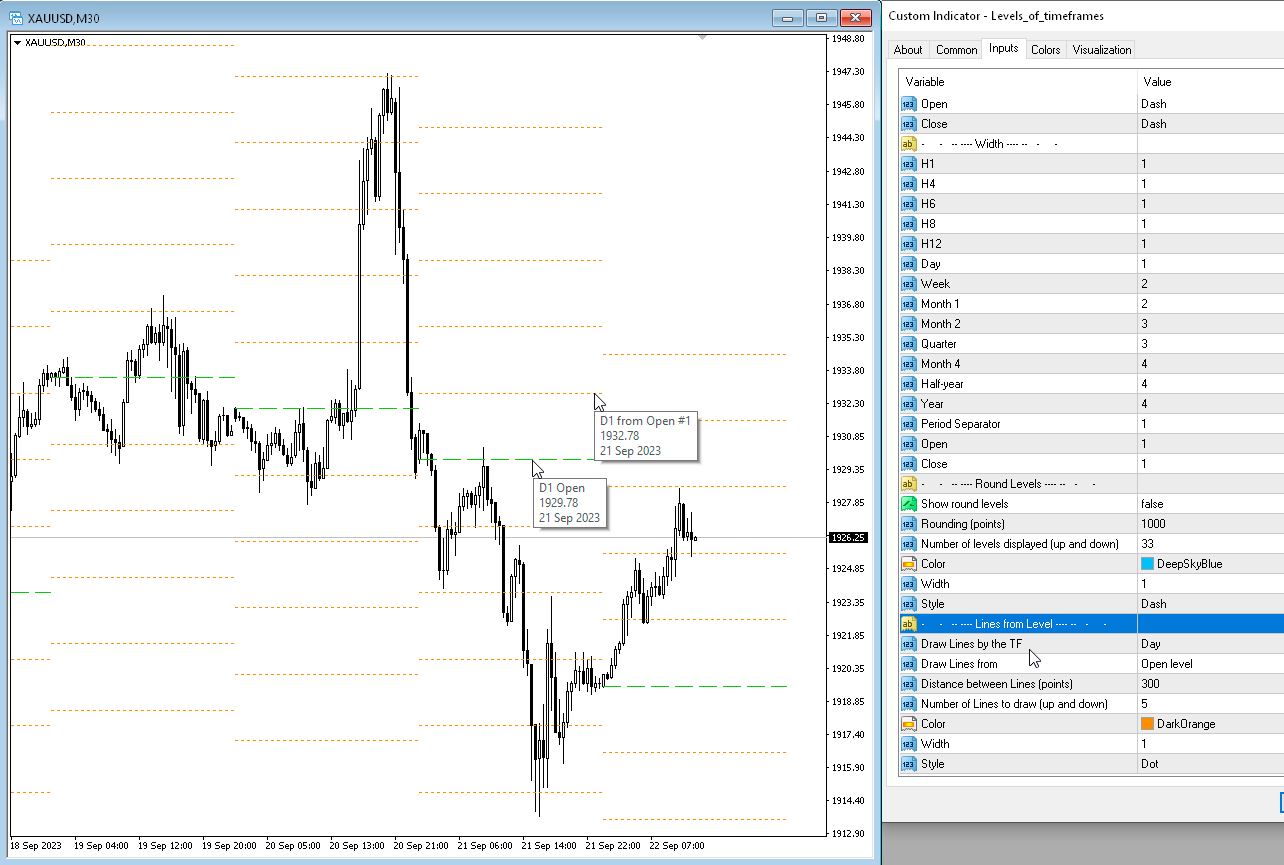
Round Levels (Niveaux ronds)
Show round levels — Afficher les niveaux ronds.
Rounding (points) — Arrondi (points).
Number of levels displayed (up and down) — le nombre de niveaux à afficher, de haut en bas par rapport au niveau actuel.
Color — Couleur.
Width — Largeur.

Style — Style.

L'indicateur affiche l'OHLC (HLOC) des délais spécifiés (barres personnalisées ou bougies personnalisées).

Avis 3
Steve davies
31
Steve davies 2023.04.06 15:37 
 

great indicator, worth every penny.

TradeTheMoney
75
TradeTheMoney 2024.12.19 19:02 
 

Building my whole strategy with it, its perfect if you want to use NY time or other custom times. With this indicator you can adjust the daily open but also trade a specific session only. VERY helpfull. The only issue is: MQL is deleating this indicator if you are not using your MT4 for a few days. So backingup every setting is advised. Really frustrating but the developer cant do anything about it,

Produits recommandés
This product is a part of  ON Trade Waves Patterns Harmonic Elliot Wolfe you can test free version on EURJPY from this link  Wolf Waves Indicator Découvrez les Vagues de Loup - Votre Outil de Trading Ultime ! Êtes-vous à la recherche d'un outil puissant pour repérer facilement les Vagues de Loup sur n'importe quel intervalle de temps ? Ne cherchez plus ! Notre indicateur de Vagues de Loup fait le travail sans effort. Voici pourquoi il est parfait pour vous : Caractéristiques principales : Déte
Monster Harmonic Indicator
Paul Geirnaerdt
4.59 (29)
Monster Harmonics Indicator is a harmonic pattern indicator. It recognizes Gartley, Bat, Crab, Butterfly, Cypher, White Swan, Black Swan, Shark and several other patterns. Projected patterns that are not yet completed are recognized, too. Monster even shows the PRZ (Potential Reversal Zone). Users can add their own user defined patterns to Monster. Besides the current pattern, Monster also shows all patterns in the symbols history. Monster will provide alerts for developing patterns. Introduced
Daily Candle Predictor est un indicateur qui prédit le cours de clôture d'une bougie. L'indicateur est principalement destiné à être utilisé sur les graphiques D1. Cet indicateur convient à la fois au trading forex traditionnel et au trading d'options binaires. L'indicateur peut être utilisé comme un système de trading autonome, ou il peut servir de complément à votre système de trading existant. Cet indicateur analyse la bougie actuelle, calcule certains facteurs de force à l'intérieur du corps
All Symbols   AND  All Time frames Scan                                                                                                                 Document Introduction   The ABCD is a basic harmonic pattern. The ABCD pattern is a visual, geometric chart pattern comprised of three consecutive price swings. It looks like a diagonal lightning bolt and can indicate an upcoming trading opportu
PZ Harmonacci Patterns
PZ TRADING SLU
3.17 (6)
Trade smarter, not harder: Empower your trading with Harmonacci Patterns This is arguably the most complete harmonic price formation auto-recognition indicator you can find for the MetaTrader Platform. It detects 19 different patterns, takes fibonacci projections as seriously as you do, displays the Potential Reversal Zone (PRZ) and finds suitable stop-loss and take-profit levels. [ Installation Guide | Update Guide | Troubleshooting | FAQ | All Products ] It detects 19 different harmonic pric
Awesome Oscillator by Bill Williams with the ability to fine-tune and replace the averaging algorithms of the indicator, which significantly expands the possibilities of using this oscillator in algorithmic trading and brings it closer in its properties to such an indicator as the MACD. To reduce price noise, the final indicator is processed with an additional Smooth averaging. The indicator has the ability to give alerts, send mail messages and push signals when the direction of movement of th
Royal Dutch Skunk
Sayan Vandenhout
ROYAL DUTCH SKUNK USES THE TREND WAVE INDICATOR AND IT CAN IDENTIFY THE BEGINNING AND THE END OF A NEW WAVE TREND MOVEMENT. AS AN OSCILLATOR, THE INDICATOR IDENTIFIES THE OVERBOUGHT AND OVERSOLD ZONES. IT WORKS GREAT TO CATCH THE SHORT TERM PRICE REVERSALS AND USES A MARTINGALE STRATEGY TO CLOSE ALL TRADES IN PROFIT. USE DEFAULT SETTINGS ON H1 OR HIGHER TIME FRAME ON ANY PAIR FOR MORE ACCURATE TRADES WHY THIS EA : Smart entries calculated by 6 great strategies The EA can be run on even a $20000
L'indicateur SMC Venom Model BPR est un outil professionnel pour les traders travaillant dans le concept Smart Money (SMC). Il identifie automatiquement deux modèles clés sur le graphique des prix: FVG   (Fair Value Gap) est une combinaison de trois bougies, dans laquelle il y a un écart entre la première et la troisième bougie. Forme une zone entre les niveaux où il n'y a pas de support de volume, ce qui conduit souvent à une correction des prix. BPR   (Balanced Price Range) est une combinaiso
TWO PAIRS SQUARE HEDGE METER INDICATOR Try this brilliant 2 pairs square indicator It draws a square wave of the relation between your two inputs symbols when square wave indicates -1 then it is very great opportunity to SELL pair1 and BUY Pair2 when square wave indicates +1 then it is very great opportunity to BUY pair1 and SELL Pair2 the inputs are : 2 pairs of symbols         then index value : i use 20 for M30 charts ( you can try other values : 40/50 for M15 , : 30 for M30 , : 10 for H1 ,
KT Renko Patterns MT4
KEENBASE SOFTWARE SOLUTIONS
2.33 (3)
KT Renko Patterns analyse le graphique Renko brique par brique afin de détecter des figures techniques bien connues, fréquemment utilisées par les traders sur divers marchés financiers. Par rapport aux graphiques basés sur le temps, les Renko offrent une vue épurée, rendant les figures plus faciles à reconnaître et à exploiter. KT Renko Patterns comprend plusieurs figures Renko, dont la majorité sont expliquées en détail dans le livre “Profitable Trading with Renko Charts” de Prashant Shah. Un
Noize Absorption Index MT4
Ekaterina Saltykova
5 (1)
Noize Absorption Index - is the manual trading system that measures the difference of pressure between bears forces and bulls forces. Green line - is a noize free index that showing curent situation. Zero value of index shows totally choppy/flat market.Values above zero level shows how powerfull bullish wave is and values below zero measures bearish forces.Up arrow appears on bearish market when it's ready to reverse, dn arrow appears on weak bullish market, as a result of reverse expectation. S
Forex Gump
Andrey Kozak
2.4 (5)
Forex Gump is a fully finished semi-automatic trading system. In the form of arrows, signals are displayed on the screen for opening and closing deals. All you need is to follow the instructions of the indicator. When the indicator shows a blue arrow, you need to open a buy order. When the indicator shows a red arrow, you need to open a sell order. Close orders when the indicator draws a yellow cross. In order to get the most effective result, we recommend using the timeframes H1, H4, D1. There
Quantum Heiken Ashi PRO MT4
Bogdan Ion Puscasu
4.33 (6)
Présentation de la       Cartes   Quantum Heiken Ashi PRO Conçues pour fournir des informations claires sur les tendances du marché, les bougies Heiken Ashi sont réputées pour leur capacité à filtrer le bruit et à éliminer les faux signaux. Dites adieu aux fluctuations de prix déroutantes et bonjour à une représentation graphique plus fluide et plus fiable. Ce qui rend le Quantum Heiken Ashi PRO vraiment unique, c'est sa formule innovante, qui transforme les données traditionnelles des chandelie
Infinity Trend Pro
Yaroslav Varankin
1 (1)
This is a trend indicator without redrawing Developed instead of the binary options strategy (by the color of the Martingale candlestick) Also works well in forex trading When to open trades (binary options) A signal will appear in the place with a candle signaling the current candle It is recommended to open a deal for one candle of the current timeframe M1 and M5 When a blue dot appears, open a deal up When a red dot appears, open a trade down. How to open trades on Forex. When a signal is rec
Indicateur Crypto_Forex « Morning Star » pour MT4. - L'indicateur « Morning Star » est un indicateur très performant pour le trading Price Action : sans refonte, sans délai. - L'indicateur détecte les figures haussières Morning Star sur le graphique : signal de flèche bleue (voir images). - Alertes PC, mobile et e-mail. - Son homologue baissier « Evening Star » est également disponible (suivez le lien ci-dessous). - L'indicateur « Morning Star » est idéal pour combiner les niveaux de support e
RTrends
Nikolay Likhovid
The RTrends indicator does two things: first, it automatically draws the layout of the price chart by plotting trend lines and, secondly, it produces bearish and bullish signals. The layout reflects the fractal nature of the market. Trends from different time horizons are applied simultaneously on the chart. Thus, from a single chart a trader can see trend lines of higher timeframes. The lines, depending on the horizon, differ in color and width: the older the horizon, the thicker the line is. T
Super Reversal Pattern
Parfait Mujinga Ndalika
Super Reversal Pattern Indicator Unlock the power of advanced pattern recognition with our Super Reversal Pattern Indicator. Designed for traders seeking precision and reliability, this indicator identifies one of the most effective reversal patterns in technical analysis, offering a significant edge in your trading strategy. Key Features: Non-Repainting Accuracy: Enjoy the confidence of non-repainting technology. Once a Super Reversal Pattern is detected, it remains static, providing consiste
RSI Speed mp
DMITRII GRIDASOV
Indicateur Crypto_Forex « RSI SPEED » pour MT4 : excellent outil prédictif, sans retouche. - Le calcul de cet indicateur est basé sur des équations physiques. Le RSI SPEED est la dérivée première du RSI lui-même. - Le RSI SPEED est idéal pour scalper les entrées dans la direction de la tendance principale. - Utilisez-le en combinaison avec un indicateur de tendance approprié, par exemple HTF MA (comme sur les images). - L'indicateur RSI SPEED indique la vitesse à laquelle le RSI change de dire
Trade with Gann on your side!! MASTER CIRCLE 360 CIRCLE CHART, originally created by Gann admitted that this is “The Mother of all charts”. It is one of the last studies that this great trader left for us. The numeric tab le is apparently quite simple like all the tables and is based on square numbers, the SQUARE OF 12 and is by evolution, one of the most important square numbers. Here we can find CYCLE, PRICE AND TIME thanks to angles and grades, to show past and future support and resistance.
VR Cub
Vladimir Pastushak
VR Cub est un indicateur permettant d'obtenir des points d'entrée de haute qualité. L'indicateur a été développé pour faciliter les calculs mathématiques et simplifier la recherche de points d'entrée dans un poste. La stratégie de trading pour laquelle l'indicateur a été rédigé prouve son efficacité depuis de nombreuses années. La simplicité de la stratégie de trading est son grand avantage, qui permet même aux traders débutants de négocier avec succès avec elle. VR Cub calcule les points d'ouve
Trace automatiquement les niveaux de Fibonacci, basés sur les prix Haut et Bas de la période spécifiée Plusieurs barres   peuvent être combinées : par exemple, vous pouvez obtenir un Fibonacci basé sur les plus hauts et plus bas sur 10 jours Mon   #1   Outil : 66+ fonctionnalités, dont cet indicateur  |   Contactez-moi  pour toute question  |    Version MT5 Aide à identifier les niveaux de retournement potentiels ; Les motifs formés aux niveaux de Fibonacci sont souvent plus forts ; Réduit   con
Trend Oscillator - est un indicateur Crypto_Forex personnalisé avancé, un outil de trading efficace ! - Une nouvelle méthode de calcul avancée est utilisée - 20 options pour le paramètre « Prix pour le calcul ». - L'oscillateur le plus fluide jamais développé. - Couleur verte pour les tendances à la hausse, couleur rouge pour les tendances à la baisse. - Valeurs de survente : inférieures à 5, Valeurs de surachat : supérieures à 95. - Il existe de nombreuses possibilités de mettre à niveau même
For this set of indicators 1. General information     - Calculates with high performance mathematical algorithms.     - Calculated from the price of candles     - The entry point of this order is filtered by the train EMA and the oscillator.     - Calculate the integrity of the candle 2. How does it work?     - You can see two types of order entry points: the notification on the monitor and the arrow.     - You can trust 75-95 percent of this entry point. 3. Settings     - Retracement is retr
Fibonacci retracement and extension line drawing tool Fibonacci retracement and extended line drawing tool for MT4 platform is suitable for traders who use  golden section trading Advantages: There is no extra line, no too long line, and it is easy to observe and find trading opportunities Trial version: https://www.mql5.com/zh/market/product/35884 Main functions: 1. Multiple groups of Fibonacci turns can be drawn directly, and the relationship between important turning points can be seen
Overview Harmonic Patterns MT4 is a technical analysis indicator designed for the MetaTrader 5 platform. It identifies and displays harmonic price patterns, such as Butterfly, Cypher, Crab, Bat, Shark, and Gartley, in both bullish and bearish directions. The indicator calculates key price levels, including entry, stop loss, and three take-profit levels, to assist traders in analyzing market movements. Visual elements and customizable alerts enhance usability on the chart. Features Detects six ha
Gold Bricks FX USES THE TREND WAVE INDICATOR AND IT CAN IDENTIFY THE BEGINNING AND THE END OF A NEW WAVE TREND MOVEMENT. AS AN OSCILLATOR, THE INDICATOR IDENTIFIES THE OVERBOUGHT AND OVERSOLD ZONES. IT WORKS GREAT TO CATCH THE SHORT TERM PRICE REVERSALS AND USES A MARTINGALE STRATEGY TO CLOSE ALL TRADES IN PROFIT. USE DEFAULT SETTINGS ON H1 OR HIGHER TIME FRAME ON ANY PAIR FOR MORE ACCURATE TRADES WHY THIS EA : Smart entries calculated by 4 great strategies The EA can be run on even a $300
EZZ Zig Zag MT4
Paulo Rocha
5 (1)
EZZ Elite Zig Zag is an indicator for the MetaTrader 4 terminal. This indicator traces the peak of the trend based on the market reversal, thus showing various opportunities in the financial market. EZZ Elite Zig Zag is a visual tool, intuitive, and easy to understand and use.  Test it Yourself by Downloading it for Free. Author Paulo Rocha all rights reserved
Unlock hidden profits: accurate divergence trading for all markets Tricky to find and scarce in frequency, divergences are one of the most reliable trading scenarios. This indicator finds and scans for regular and hidden divergences automatically using your favourite oscillator. [ Installation Guide | Update Guide | Troubleshooting | FAQ | All Products ] Easy to trade Finds regular and hidden divergences Supports many well known oscillators Implements trading signals based on breakouts Display
Promotion $66 lifetime for you. The principle of this indicator is very simple: detecting the trend with Moving Average, then monitoring the return point of graph by using the crossing of Stochastic Oscillator and finally predicting BUY and SELL signal with arrows, alerts and notifications. The parameters are fixed and automatically calculated on each time frame. Example: If you install indicator on EURUSD, timeframe M5: the indicator will detect the main trend with the Moving Average on this
GJ Options
Sayan Vandenhout
GJ OPTIONS USES THE TREND WAVE INDICATOR AND IT CAN IDENTIFY THE BEGINNING AND THE END OF A NEW WAVE TREND MOVEMENT. AS AN OSCILLATOR, THE INDICATOR IDENTIFIES THE OVERBOUGHT AND OVERSOLD ZONES. IT WORKS GREAT TO CATCH THE SHORT TERM PRICE REVERSALS AND USES A MARTINGALE STRATEGY TO CLOSE ALL TRADES IN PROFIT. USE DEFAULT SETTINGS ON H1 OR HIGHER TIME FRAME ON ANY PAIR FOR MORE ACCURATE TRADES WHY THIS EA : Smart entries calculated by 5 great strategies The EA can be run on even a $20000 account
Les acheteurs de ce produit ont également acheté
Gann Made Easy
Oleg Rodin
4.83 (152)
Gann Made Easy est un système de trading Forex professionnel et facile à utiliser qui est basé sur les meilleurs principes de trading en utilisant la théorie de mr. WD Gann. L'indicateur fournit des signaux d'ACHAT et de VENTE précis, y compris les niveaux Stop Loss et Take Profit. Vous pouvez échanger même en déplacement en utilisant les notifications PUSH. VEUILLEZ ME CONTACTER APRÈS L'ACHAT POUR OBTENIR DES CONSEILS DE TRADING, DES BONUS ET L'ASSISTANT EA GANN MADE EASY GRATUITEMENT! Vous ave
Pulse Scalping Line - an indicator for identifying potential pivot points. Based on this indicator, you can build an effective Martingale system. According to our statistics, the indicator gives a maximum of 4 erroneous pivot points in a series. On average, these are 2 pivot points. That is, the indicator shows a reversal, it is erroneous. This means that the second signal of the indicator will be highly accurate. Based on this information, you can build a trading system based on the Martingale
Gold Signal Pro
Mohamed Hassan
5 (1)
First 25 copies at $80, after that price becomes $149 (4 copies left) Gold Signal Pro is a powerful MT4 indicator designed to help traders spot strong price reactions in the market. It focuses on clear wick rejections , showing when price strongly rejects a level and often continues in the same direction. Gold Signal Pro is mainly built for scalping gold (XAUUSD) and works best on lower timeframes like M5 and M15 , where timing matters most. That said, it can also be used on any forex pair, a
Smc Blast Signal
Mohit Dhariwal
5 (3)
NEW YEAR 2026 SALE OFFER PRICE AT JUST 75 DOLLARS FEW COPIES ONLY AT This price From 28th Jan -31th Jan MIDNIGHT Final offer GRAB YOUR COPY ON THIS New Year EVE last offer GRAB IT! Prices will be increased to 150 after the offer period ends Full Fledged EA and Alert plus for alerts will also be provided in this offer along with the purchase of Indicator. Limited copies only at this price and Ea too. Grab your copy soon Alert plus for indicator with set file is kept in comment section with the im
Apollo SR Master est un indicateur de support/résistance doté de fonctionnalités spéciales qui simplifient et fiabilisent le trading basé sur les zones de support/résistance. Cet indicateur calcule ces zones en temps réel, sans aucun décalage, en détectant les sommets et les creux locaux des prix. Pour confirmer la nouvelle zone de support/résistance, il affiche un signal spécifique indiquant que cette zone peut être prise en compte et utilisée comme un véritable signal d'achat ou de vente. Dans
Trend indicator AI
Ramil Minniakhmetov
4.9 (77)
L'indicateur Trend Ai est un excellent outil qui améliorera l'analyse du marché d'un trader en combinant l'identification des tendances avec des points d'entrée exploitables et des alertes d'inversion. Cet indicateur permet aux utilisateurs de naviguer dans les complexités du marché forex avec confiance et précision Au-delà des signaux primaires, l'indicateur Trend Ai identifie les points d'entrée secondaires qui surviennent lors des retraits ou des retracements, permettant aux traders de capit
M1 Sniper
Oleg Rodin
4.89 (18)
M1 SNIPER est un système d'indicateurs de trading facile à utiliser. Il s'agit d'un indicateur à flèche conçu pour l'unité de temps M1. Cet indicateur peut être utilisé seul pour le scalping sur l'unité de temps M1 ou intégré à votre système de trading existant. Bien que conçu spécifiquement pour le trading sur l'unité de temps M1, ce système peut également être utilisé avec d'autres unités de temps. Initialement, j'avais conçu cette méthode pour le trading du XAUUSD et du BTCUSD. Cependant, je
Actuellement 20% de réduction ! La meilleure solution pour tout débutant ou trader expert ! Ce logiciel de tableau de bord fonctionne sur 28 paires de devises. Il est basé sur 2 de nos principaux indicateurs (Advanced Currency Strength 28 et Advanced Currency Impulse). Il donne un excellent aperçu de l'ensemble du marché Forex. Il montre les valeurs de l'Advanced Currency Strength, la vitesse de mouvement des devises et les signaux pour 28 paires de devises dans tous les (9) délais. Imaginez
Atomic Analyst
Issam Kassas
5 (3)
Tout d'abord, il convient de souligner que cet indicateur de trading n'est ni repainting, ni redrawing et ne présente aucun délai, ce qui le rend idéal à la fois pour le trading manuel et automatisé. Manuel de l'utilisateur : réglages, entrées et stratégie. L'Analyste Atomique est un indicateur d'action sur les prix PA qui utilise la force et le momentum du prix pour trouver un meilleur avantage sur le marché. Équipé de filtres avancés qui aident à éliminer les bruits et les faux signaux, et à
Game Changer Indicator
Vasiliy Strukov
3.89 (18)
Game Changer est un indicateur de tendance révolutionnaire, conçu pour être utilisé sur tout instrument financier et transformer votre MetaTrader en un puissant analyseur de tendances. L'indicateur ne se redessine pas et est sans latence. Il fonctionne sur n'importe quelle unité de temps et facilite l'identification des tendances, signale les retournements potentiels, agit comme un stop suiveur et fournit des alertes en temps réel pour une réaction rapide du marché. Que vous soyez un trader expé
Volatility Trend System - un système de trading qui donne des signaux pour les entrées. Le système de volatilité donne des signaux linéaires et ponctuels dans le sens de la tendance, ainsi que des signaux pour en sortir, sans redessiner ni retarder. L'indicateur de tendance surveille la direction de la tendance à moyen terme, montre la direction et son changement. L'indicateur de signal est basé sur les changements de volatilité et montre les entrées sur le marché. L'indicateur est équipé de pl
Scalper Inside PRO
Alexey Minkov
4.74 (69)
An exclusive indicator that utilizes an innovative algorithm to swiftly and accurately determine the market trend. The indicator automatically calculates opening, closing, and profit levels, providing detailed trading statistics. With these features, you can choose the most appropriate trading instrument for the current market conditions. Additionally, you can easily integrate your own arrow indicators into Scalper Inside Pro to quickly evaluate their statistics and profitability. Scalper Inside
Indicateur Miraculous – Outil Forex et Binaire 100% Non-Repaint Basé sur le Carré de Neuf de Gann Cette vidéo présente l' Indicateur Miraculous , un outil de trading très précis et puissant, spécifiquement développé pour les traders du Forex et des Options Binaires . Ce qui rend cet indicateur unique est sa fondation sur le légendaire Carré de Neuf de Gann et la Loi de Vibration de Gann , en faisant l'un des outils de prévision les plus précis disponibles dans le trading moderne. L'Indicateur Mi
Si vous achetez cet indicateur, vous recevrez mon Gestionnaire de Trading Professionnel   + EA  GRATUITEMENT. Tout d'abord, il convient de souligner que ce système de trading est un indicateur non repeint, non redessiné et non retardé, ce qui le rend idéal pour le trading manuel et automatisé. Cours en ligne, manuel et téléchargement de préréglages. Le "Système de Trading Smart Trend MT5" est une solution de trading complète conçue pour les traders débutants et expérimentés. Il combine plus de
Presenting one-of-a-kind Gann Indicator for XAUUSD IQ Gold Gann Levels is a non-repainting, precision tool designed exclusively for XAUUSD/Gold intraday trading. It uses W.D. Gann’s square root method to plot real-time support and resistance levels, helping traders spot high-probability entries with confidence and clarity. William Delbert Gann (W.D. Gann) was an exceptional market analyst whose trading technique was based on a complex blend of mathematics, geometry, astrology, and ancient calcul
Advanced Supply Demand
Bernhard Schweigert
4.91 (296)
New Year Trading Special – 50% OFF Best Solution for any Newbie or Expert Trader! This indicator is a unique, high quality and affordable trading tool because we have incorporated a number of proprietary features and a new formula. With this update, you will be able to show double timeframe zones. You will not only be able to show a higher TF but to show both, the chart TF, PLUS the higher TF: SHOWING NESTED ZONES. All Supply Demand traders will love it. :) Important Information Revealed Maximiz
Ce tableau de bord affiche les derniers modèles harmoniques disponibles pour les symboles sélectionnés, ce qui vous permettra de gagner du temps et d'être plus efficace / version MT5 . Indicateur gratuit: Basic Harmonic Pattern Colonnes de l'indicateur Symbol : les symboles sélectionnés apparaissent Trend : haussière ou baissière Pattern : type de motif (gartley, papillon, chauve-souris, crabe, requin, cypher ou ABCD) Entry: prix d'entrée SL: prix du stop loss TP1: 1er prix de prise de profi
Currency Strength Wizard est un indicateur très puissant qui vous offre une solution tout-en-un pour un trading réussi. L'indicateur calcule la puissance de telle ou telle paire de devises en utilisant les données de toutes les devises sur plusieurs périodes. Ces données sont représentées sous la forme d'un indice de devise facile à utiliser et de lignes électriques de devise que vous pouvez utiliser pour voir la puissance de telle ou telle devise. Tout ce dont vous avez besoin est d'attacher l'
Dynamic Forex28 Navigator
Bernhard Schweigert
4.43 (7)
Dynamic Forex28 Navigator - L'outil de trading Forex de nouvelle génération. ACTUELLEMENT 49 % DE RÉDUCTION. Dynamic Forex28 Navigator est l'évolution de nos indicateurs populaires de longue date, combinant la puissance de trois en un : Advanced Currency Strength28 Indicator (695 avis) + Advanced Currency IMPULSE avec ALERT (520 avis) + CS28 Combo Signals (Bonus). Détails sur l'indicateur https://www.mql5.com/en/blogs/post/758844 Qu'offre l'indicateur de force de nouvelle génération ? Tout
ACTUELLEMENT 26% DE RÉDUCTION ! !! Cet indicateur est une super combinaison de nos deux indicateurs principaux ( Advanced Currency Strength 28   &  Advanced Currency IMPULSE with ALERT ). Il montre les valeurs de force de la devise pour les TICK-UNITS et les signaux d'alerte pour 28 paires Forex. 11 unités de tic-tac différentes peuvent être utilisées. Ce sont 1, 2, 3, 4, 5, 6, 10, 12, 15, 20 et 30 secondes. La barre de Tick-Unit dans la sous-fenêtre sera affichée et déplacée vers la gauche lo
Easy Breakout
Mohamed Hassan
4.71 (14)
After your purchase, feel free to contact me for more details on how to receive a bonus indicator called VFI, which pairs perfectly with Easy Breakout for enhanced confluence!    Easy Breakout is a powerful price action trading system built on one of the most popular and widely trusted strategies among traders: the Breakout strategy ! This indicator delivers crystal-clear Buy and Sell signals based on breakouts from key support and resistance zones. Unlike typical breakout indicators, it levera
GOLD Impulse with Alert
Bernhard Schweigert
4.64 (11)
Cet indicateur est une super combinaison de nos 2 produits Advanced Currency IMPULSE with ALERT  +   Currency Strength Exotics . Il fonctionne pour tous les cadres temporels et montre graphiquement l'impulsion de force ou de faiblesse pour les 8 principales devises plus un symbole ! Cet indicateur est spécialisé pour montrer l'accélération de la force des devises pour tout symbole comme l'or, les paires exotiques, les matières premières, les indices ou les contrats à terme. C'est le premier
Day Trader Master est un système de trading complet pour les day traders. Le système se compose de deux indicateurs. Un indicateur est un signal fléché pour acheter et vendre. C'est l'indicateur de flèche que vous obtenez. Je vous fournirai le deuxième indicateur gratuitement. Le deuxième indicateur est un indicateur de tendance spécialement conçu pour être utilisé conjointement avec ces flèches. LES INDICATEURS NE RÉPÉTENT PAS ET NE TARDENT PAS! L'utilisation de ce système est très simple. Il v
Découvrez l'Indicateur d'Avion F-16, un outil de pointe pour MT4 conçu pour révolutionner votre expérience de trading. Inspiré par la vitesse et la précision inégalées de l'avion de chasse F-16, cet indicateur combine des algorithmes avancés et une technologie de pointe pour offrir des performances inégalées sur les marchés financiers. Avec l'Indicateur d'Avion F-16, vous surplomberez la concurrence car il fournit une analyse en temps réel et génère des signaux de trading hautement précis. Ses f
FX Volume
Daniel Stein
4.63 (38)
FX Volume : Découvrez le Sentiment du Marché tel que perçu par un Courtier Présentation Rapide Vous souhaitez faire passer votre approche de trading au niveau supérieur ? FX Volume vous fournit, en temps réel, des informations sur la manière dont les traders particuliers et les courtiers sont positionnés—bien avant la publication de rapports retardés comme le COT. Que vous visiez des gains réguliers ou recherchiez simplement un avantage plus solide sur les marchés, FX Volume vous aide à repére
FX Power MT4 NG
Daniel Stein
4.95 (20)
FX Power : Analysez la force des devises pour des décisions de trading plus intelligentes Aperçu FX Power est l'outil essentiel pour comprendre la force réelle des principales devises et de l'or, quelles que soient les conditions du marché. En identifiant les devises fortes à acheter et les faibles à vendre, FX Power simplifie vos décisions de trading et révèle des opportunités à forte probabilité. Que vous suiviez les tendances ou anticipiez les retournements à l'aide de valeurs extrêmes de D
ACTUELLEMENT 31% DE RÉDUCTION ! ! La meilleure solution pour tout débutant ou Expert Trader ! Cet indicateur est un outil de trading unique, de haute qualité et abordable car nous avons incorporé un certain nombre de caractéristiques exclusives et une formule secrète. Avec seulement UN graphique, il donne des alertes pour les 28 paires de devises. Imaginez comment votre trading s'améliorera parce que vous serez capable de repérer le point de déclenchement exact d'une nouvelle tendance ou d'un
Trend Screener
STE S.S.COMPANY
4.79 (95)
Indicateur de tendance, solution unique révolutionnaire pour le trading et le filtrage des tendances avec toutes les fonctionnalités de tendance importantes intégrées dans un seul outil ! Il s'agit d'un indicateur multi-période et multi-devises 100 % non repeint qui peut être utilisé sur tous les symboles/instruments : forex, matières premières, crypto-monnaies, indices et actions. OFFRE À DURÉE LIMITÉE : L'indicateur Support and Resistance Screener est disponible pour seulement 50 $ et à vie. (
Le détecteur de séisme de marché  sismographique. Description in English : https://www.mql5.com/en/market/product/113869?source=Site+Market+Product+Page#description How to use the Seismograph : https://www.mql5.com/en/market/product/113869#!tab=comments&page=2&comment=52806941 Create an EA : https://www.mql5.com/en/market/product/113869#!tab=comments&page=3&comment=52816509 Quelle que soit la façon dont vous tradez, vous voulez absolument éviter d'entrer sur le marché à faible liquidité.-
Stop Trading Random Signals. Start Trading with Real Confluence Are you tired of indicators that repaint, give conflicting signals, and leave you more confused than confident? The Quantum Regime Indicator is a professional, standalone trading tool designed for serious traders who demand a systematic edge. It solves the biggest problem in technical analysis— false signals —by using a powerful multi-engine framework. Every signal is confirmed by a confluence of market conditions , ensuring you onl
Plus de l'auteur
Easy Grider
Taras Slobodyanik
4.5 (2)
The EA creates an order grid using labels. Opening and closing of the grid is done either automatically by the system signals or manually. In the same grid can be both Limit and Stop orders. It is possible to reverse the grid on specified condition. You can enter the breakdown/rebound from established levels. All types of Sell limit, Buy limit, Buy stop, Sell stop orders are supported. The grid is rebuilt with a single click. The stop loss and take profit lines can be easily modified. You are fr
Modification multidevises et multitemporelles de l'oscillateur stochastique. Vous pouvez spécifier les devises et les délais souhaités dans les paramètres. Le panneau affiche les valeurs actuelles et les intersections des lignes — Signal et Principal (croisement stochastique). En outre, l'indicateur peut envoyer des notifications lors du franchissement des niveaux de surachat et de survente. En cliquant sur une cellule avec un point, ce symbole et ce point seront ouverts. Il s'agit du scanner M
Modification multidevises et multitemporelles de l’indicateur Relative Strength Index (RSI). Vous pouvez spécifier les devises et les délais souhaités dans les paramètres. En outre, le panneau peut envoyer des notifications lors du franchissement des niveaux de surachat et de survente. En cliquant sur une cellule avec un point, ce symbole et ce point seront ouverts. Il s'agit du scanner MTF. La clé pour masquer le tableau de bord du graphique est "D" par défaut. Semblable au Currency Strength
The indicator has three main tools: Magnifier (Zoom chart), Ruler  ( Time and Price scales ),   and Crosshair. You can move it all around with your mouse and customize different formats for  displaying , customize   size and color of each element. The Magnifier (zoom chart) allows you to display candles from any time frame and at different scales. Hotkeys: 'Q' - higher timeframe, 'A' - lower timeframe, 'W' - decrease candle size, 'S' - increase candle size, 'Z' - show/hide zoom chart You can
Time Scale for MT5
Taras Slobodyanik
4.75 (28)
The indicator draws the time scale on the chart. You can specify the time offset, adjust the size and font to display on the chart ( it is displaying your local time on your chart instead of MT time ). You can also select the desired format for displaying the date and time. You may be interested in my other product , which contains a more advanced version of the Time Scale . You can also find my other products here Parameters Hours (time shift) — time shift (hours); Minutes (time shift) — time
FREE
Lines Profit Loss MT5
Taras Slobodyanik
4.62 (13)
L'indicateur affiche le profit (la perte) sur le symbole actuel. Vous pouvez librement faire glisser et déposer la ligne pour afficher le profit ou la perte actuel. Vous pouvez retrouver mes produits   ici Paramètres Calculation in money or in points — calculez le profit/la perte en points ou en argent. Add pending orders to calculate — prenez en compte les commandes en attente dans les calculs. Magic Number (0 - all orders on symbol) — nombre magique, s'il est nécessaire d'évaluer des comma
FREE
News Dashboard MT4
Taras Slobodyanik
4.5 (8)
This dashboard displaying current news from ForexFactory.com (calendar FFC) and from the Investing.com website . You can sort news by impact and by country, and display them on the chart with one click. By holding down the 'Ctrl' key, you can select several different 'currencies' or 'impacts' to sort. Also, this utility shows not only the forecast, but also the actual values ​​after they appear on the site. You can set a separate notification for each news. You can read the news using your EA
ADX Dashboard MT5
Taras Slobodyanik
5 (4)
L'indicateur ADX est utilisé pour déterminer la tendance et sa force. La direction du prix est indiquée par les valeurs +DI et -DI, ​​et la valeur ADX montre la force de la tendance. Si +DI est supérieur à -DI, ​​alors le marché est dans une tendance haussière, si au contraire, c'est une tendance baissière. Si l’ADX est inférieur à 20, il n’y a pas de direction définie. Dès que l'indicateur dépasse ce niveau, une tendance de force moyenne commence. Les valeurs supérieures à 40 indiquent une ten
The Gann Box (or Gann Square) is a market analysis method based on the "Mathematical formula for market predictions" article by W.D. Gann. This indicator can plot three models of Squares: 90, 52(104), 144. There are six variants of grids and two variants of arcs. You can plot multiple squares on one chart simultaneously. Parameters Square — selection of a Gann square model: 90 — square of 90 (or square of nine); 52 (104) — square of 52 (or 104); 144 — universal square of 144; 144 (full) — "fu
ADX Dashboard
Taras Slobodyanik
5 (5)
L'indicateur ADX est utilisé pour déterminer la tendance et sa force. La direction du prix est indiquée par les valeurs +DI et -DI, ​​et la valeur ADX montre la force de la tendance. Si +DI est supérieur à -DI, ​​alors le marché est dans une tendance haussière, si au contraire, c'est une tendance baissière. Si l’ADX est inférieur à 20, il n’y a pas de direction définie. Dès que l'indicateur dépasse ce niveau, une tendance de force moyenne commence. Les valeurs supérieures à 40 indiquent une ten
Multicurrency and multitimeframe modification of the indicator Bollinger Bands. On the dashboard you can see breakouts and touches of the Bollinger Bands. In the parameters you can specify any desired currencies and timeframes. The indicator can also send notifications when the price touches the Bollinger Bands, when the current volatility changes (expands or falls), and when the price touches all the bands. By clicking on a cell with a period, this symbol and period will be opened. This is MTF
ZigZag Lines MTF for MT5
Taras Slobodyanik
5 (11)
Multi timeframe ZigZag indicator. It displays the support/resistance horizontal lines and their breakouts, as well as draws the current targets of the market. It can also display lines of the Fractals indicator and candles from other periods (up to Quarterly). So, you can actually see the supply and demand levels. Indicator – connects key lows and highs to show trend lines. You can also use it as indicator for the Break of Structure(BOS) & Market Structure Shift(MSS). The indicator redraws the
Lines Profit Loss
Taras Slobodyanik
4.63 (16)
L'indicateur affiche le profit (la perte) sur le symbole actuel. Vous pouvez librement faire glisser et déposer la ligne pour afficher le profit ou la perte actuel. Vous pouvez retrouver mes produits ici Paramètres Calculation in money or in points — calculez le profit/la perte en points ou en argent. Add pending orders to calculate — prenez en compte les commandes en attente dans les calculs. Magic Number (0 - all orders on symbol) — nombre magique, s'il est nécessaire d'évaluer des commande
FREE
Pro Sessions MT5
Taras Slobodyanik
5 (1)
This is an indicator of trading sessions  that can display all levels (Open-High-Low-Close) for four sessions . The indicator can also predict session levels. Sessions can be drawn with lines or rectangles (empty or filled), lines can be extended to the next session. You can easily hide/show each session by pressing hotkeys (by default '1', '2', '3', '4'). You can see ASR (Average Session Range) lines  (default hotkey 'A'). This is similar to the ADR calculation, only it is calculated based on
ZigZag Lines MTF
Taras Slobodyanik
4.38 (13)
Multi timeframe ZigZag indicator. It displays the support/resistance horizontal lines and their breakouts, as well as draws the current targets of the market. It can also display lines of the Fractals indicator and candles from other periods (up to Quarterly). So, you can actually see the supply and demand levels. Indicator – connects key lows and highs to show trend lines. You can also use it as indicator for the Break of Structure(BOS) & Market Structure Shift(MSS). The indicator redraws the
Modification multidevises et multitemporelles de l'oscillateur stochastique. Vous pouvez spécifier les devises et les délais souhaités dans les paramètres. Le panneau affiche les valeurs actuelles et les intersections des lignes — Signal et Principal (croisement stochastique). En outre, l'indicateur peut envoyer des notifications lors du franchissement des niveaux de surachat et de survente. En cliquant sur une cellule avec un point, ce symbole et ce point seront ouverts. Il s'agit du scanner M
Time Scale
Taras Slobodyanik
4.87 (15)
The indicator draws the time scale on the chart. You can specify the time offset, adjust the size and font to display on the chart (it is displaying your local time on your chart instead of MT time). You can also select the desired format for displaying the date and time. While holding down the middle mouse button, and moving the cursor, a slider will appear on the scale. You may be interested in my other product , which contains a more advanced version of the Time Scale. You can also find my o
FREE
ZigZag Dashboard for MT4
Taras Slobodyanik
4.8 (5)
Multicurrency and multitimeframe modification of the ZigZag indicator. Displays the current direction of the market, the height of the last movement, the number of bars in this movement and the breaking of the previous point of the ZigZag (horizontal line). This is MTF Scanner, you can actually see the supply and demand levels. You can specify any desired currencies and timeframes in the parameters. Also, the panel can send notifications when the ZigZag changes direction or when there was a br
Multicurrency and multi-timeframe indicator Inside Bar (IB). In the parameters, you can specify any desired currencies and timeframes. The panel displays the last found Inside Bar (and Mother Bar) pattern, the current price position and the breakout of the levels of the Mother and Inside Bars. You can set the size and color for bars and text in the cells. The indicator can also send notifications when levels are broken. The dashboard highlights Double Inside Bar in a special color. By clicking
Pro Sessions MT4
Taras Slobodyanik
4.75 (4)
This is an indicator of trading sessions  that can display all levels (Open-High-Low-Close) for four sessions. The indicator can also predict session levels. Sessions can be drawn with lines or rectangles (empty or filled), lines can be extended to the next session. You can easily hide/show each session by pressing hotkeys (by default '1', '2', '3', '4'). You can see ASR (Average Session Range) lines  (default hotkey 'A'). This is similar to the ADR calculation, only it is calculated based on t
CCI Dashboard for MT5
Taras Slobodyanik
5 (1)
Multicurrency and multitimeframe modification of the Commodity Channel Index (CCI) indicator. You can specify any desired currencies and timeframes in the parameters. Also, the panel can send notifications when crossing overbought and oversold levels. By clicking on a cell with a period, this symbol and period will be opened. This is MTF Scanner. The key to hide the dashboard from the chart is "D" by default. Parameters CCI Period  — averaging period. CCI Applied price  — price type. Clear th
Gann Square of 144
Taras Slobodyanik
5 (6)
The Gann Box (or Gann Square) is a market analysis method based on the "Mathematical formula for market predictions" article by W.D. Gann. This indicator can plot three models of Squares: 90, 52(104), 144. There are six variants of grids and two variants of arcs. You can plot multiple squares on one chart simultaneously. Parameters Square — selection of a Gann square model: 90 — square of 90 (or square of nine); 52 (104) — square of 52 (or 104); 144 — universal square of 144; 144 (full) — "fu
Multicurrency and multitimeframe modification of the indicator Bollinger Bands. On the dashboard you can see breakouts and touches of the Bollinger Bands. In the parameters you can specify any desired currencies and timeframes. The indicator can also send notifications when the price touches the Bollinger Bands, when the current volatility changes (expands or falls), and when the price touches all the bands. By clicking on a cell with a period, this symbol and period will be opened. This is MTF
The indicator has three main tools: Magnifier (Zoom chart), Ruler  ( Time and Price scales ),   and Crosshair. You can move it all around with your mouse and customize different formats for  displaying , customize   size and color of each element. The Magnifier (zoom chart) allows you to display candles from any time frame and at different scales. Hotkeys: 'Q' - higher timeframe, 'A' - lower timeframe, 'W' - decrease candle size, 'S' - increase candle size, 'Z' - show/hide zoom chart. You can
ZigZag Dashboard for MT5
Taras Slobodyanik
5 (4)
Multicurrency and multitimeframe modification of the ZigZag indicator. Displays the current direction of the market, the height of the last movement, the number of bars in this movement and the breaking of the previous point of the ZigZag (horizontal line). This is MTF Scanner, you can actually see the supply and demand levels. You can specify any desired currencies and timeframes in the parameters. Also, the panel can send notifications when the ZigZag changes direction or when there was a br
Inside Bar Dashboard
Taras Slobodyanik
5 (3)
Multicurrency and multi-timeframe indicator Inside Bar (IB). In the parameters, you can specify any desired currencies and timeframes. The panel displays the last found Inside Bar (and Mother Bar) pattern, the current price position and the breakout of the levels of the Mother and Inside Bars. You can set the size and color for bars and text in the cells. The indicator can also send notifications when levels are broken. The dashboard highlights Double Inside Bar in a special color. By clicking
Heikin Ashi Dashboard
Taras Slobodyanik
5 (5)
Multi-currency and multitimeframe Heikin Ashi indicator. Shows the current state of the market. On the scanner panel you can see the direction, strength and number of bars of the current trend. The Consolidation/Reversal candles are also shown using color. You can specify any desired currencies and periods in the parameters. Also, the indicator can send notifications when the trend changes or when reversal and consolidation candles (dojis) appear. By clicking on a cell, this symbol and period wi
CCI Dashboard for MT4
Taras Slobodyanik
5 (3)
Multicurrency and multitimeframe modification of the Commodity Channel Index (CCI) indicator. You can specify any desired currencies and timeframes in the parameters. Also, the panel can send notifications when crossing overbought and oversold levels. By clicking on a cell with a period, this symbol and period will be opened. This is MTF Scanner. The key to hide the dashboard from the chart is "D" by default. Parameters CCI Period — averaging period. CCI Applied price — price type. Clear the
Symbol Manager
Taras Slobodyanik
5 (4)
Symbol Manager or Grid Manager, designed to group orders into one position (by Symbol or by Magic Number). This utility will be useful to multi-currency traders (many EAs), who can have multiple orders on several pairs. You will be able to see the total number of lots, the total profit, and set virtual stop loss and virtual take profit. To set a real TP (or SL), you must first set the virtual value, and then enter the command in this cell: "set". If you want to set real TP/SL for all orders at
Filtrer:
TradeTheMoney
75
TradeTheMoney 2024.12.19 19:02 
 

Building my whole strategy with it, its perfect if you want to use NY time or other custom times. With this indicator you can adjust the daily open but also trade a specific session only. VERY helpfull. The only issue is: MQL is deleating this indicator if you are not using your MT4 for a few days. So backingup every setting is advised. Really frustrating but the developer cant do anything about it,

Taras Slobodyanik
91602
Réponse du développeur Taras Slobodyanik 2024.12.19 19:09
Hello.
I doubt that MQL deletes anything from your terminal. Maybe you log out of your MT account or some of your programs clean your computer.
Steve davies
31
Steve davies 2023.04.06 15:37 
 

great indicator, worth every penny.

trade2travel12
36
trade2travel12 2020.11.04 09:29 
 

I purchased this Levels of Timeframes indicator but I cannot access it. Where is it? Where is the exe file or zip file?? Please email it to trade2travel12@gmail.com immediately

Taras Slobodyanik
91602
Réponse du développeur Taras Slobodyanik 2023.04.24 10:50
Hello. You can download the product from your MT4/MT5 (from Market tab). If you want to contact me write a private message.
Répondre à l'avis