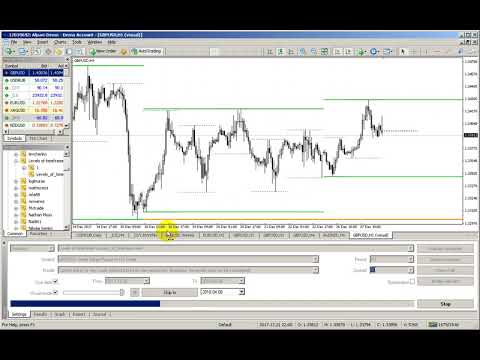
Levels of Timeframes
- 지표
- 버전: 4.80
- 업데이트됨: 10 11월 2025
- 활성화: 10

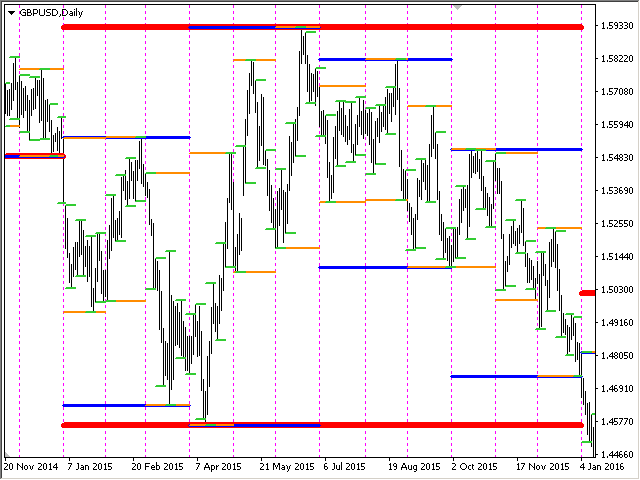
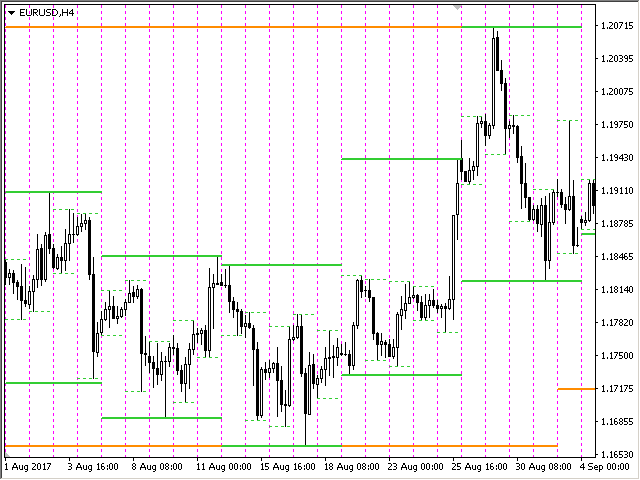
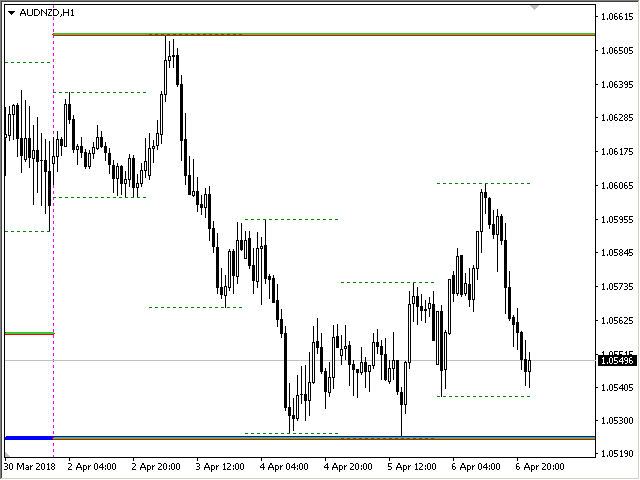
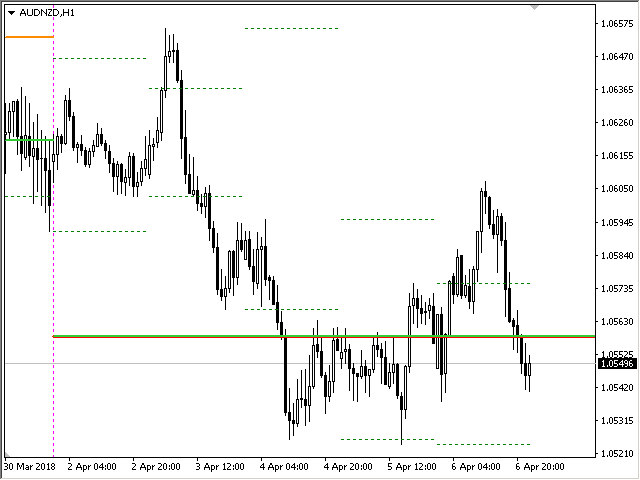
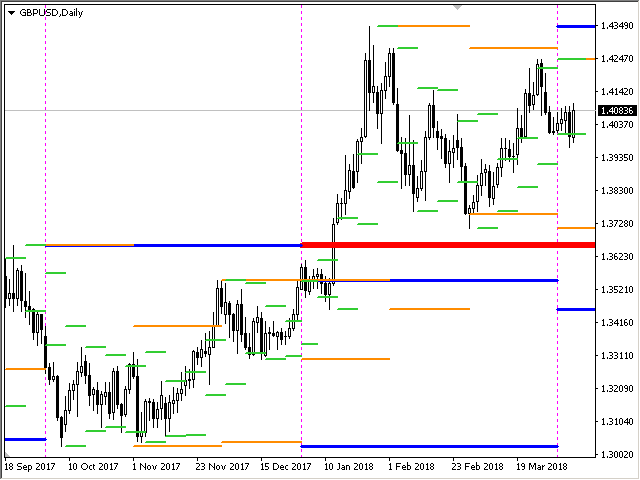
표시기는 기타(및 비표준) 기간(연도, 6개월, 4개월, 3개월, 2개월, 월, 주, 일, H3-H6-H8-H12 시간)의 고가/저/시가/종가 수준을 표시합니다. . 양초를 여는 교대근무를 설정하고 가상 양초를 만들 수도 있습니다.
이러한 기간 중 하나에 대한 '기간 구분 기호'는 수직선 형태로 제공됩니다. 현재 또는 이전 수준의 돌파에 대해 경고를 구성할 수 있습니다(어제/지난주 라인의 고/저 돌파 등).
모든 수준을 한 기간씩 오른쪽으로 이동할 수도 있습니다. 즉, 이전 기간의 고가/저가가 현재 기간에 표시됩니다.
매개변수
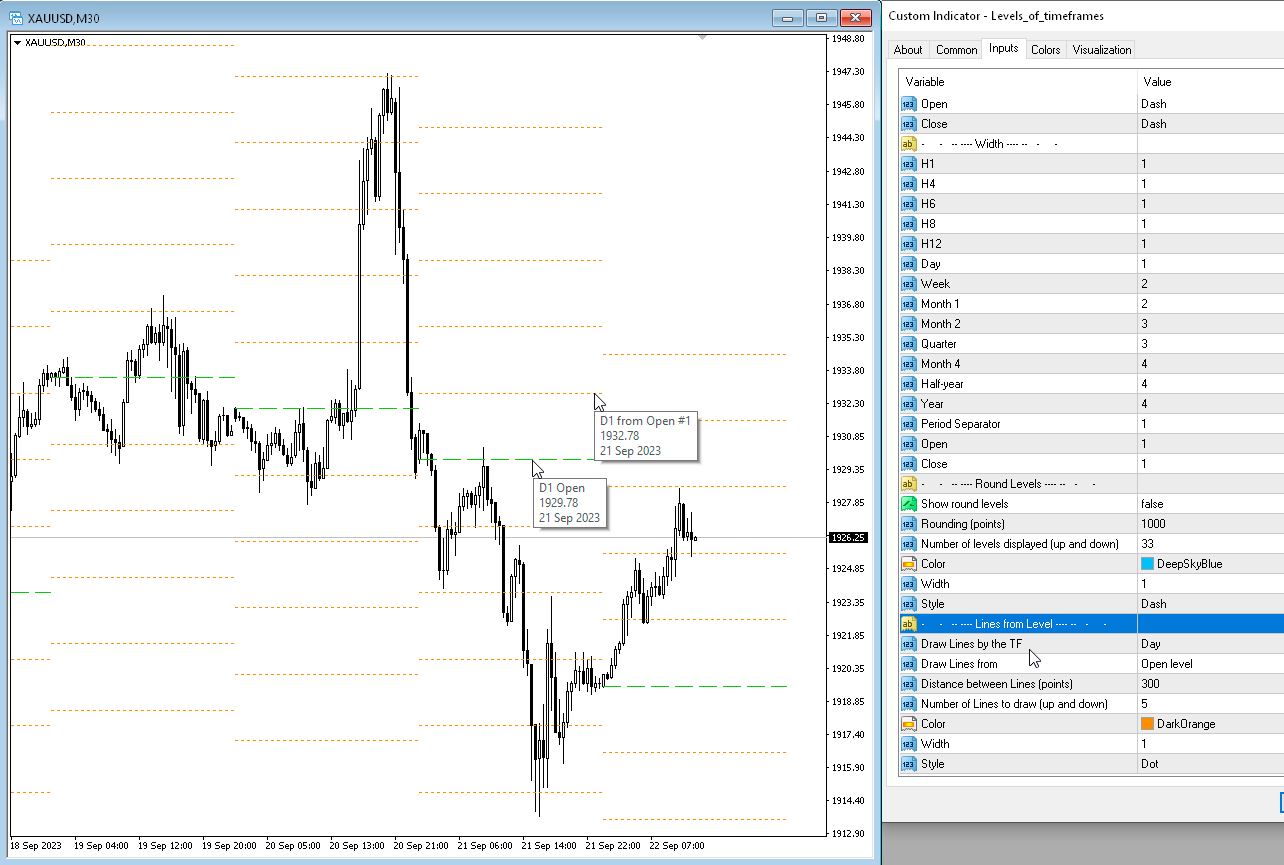
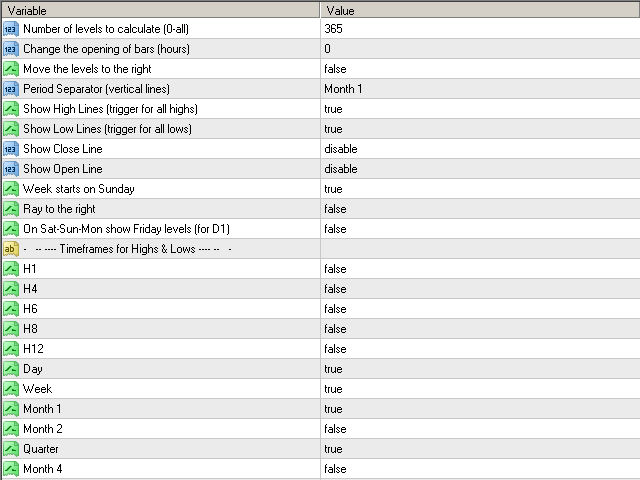
Number of levels to calculate (0-all) — 화면에 표시되는 막대 수입니다.
Change the opening of bars (hours) — 캔들의 오프닝을 n시간만큼 이동합니다. 표시기는 새로운 개장 시간을 고려하여 가상 막대를 그립니다. MN1 이상의 기간은 변경되지 않습니다.
Move the levels to the right — 모든 레벨을 한 막대 오른쪽으로 이동합니다. 현재 캔들의 이전 레벨을 볼 수 있습니다.
Period Separator (vertical lines) — 수직선, 기간 구분 기호를 표시합니다.
Show High Lines (trigger for all highs) — 높은 수준 그리기를 비활성화하거나 활성화합니다.
Show Low Lines (trigger for all lows) — 낮은 수준 그리기를 비활성화하거나 활성화합니다.
Show Open Line — 시가선이 그려지는 기간입니다. "고점 및 저점에 대한 모든 TF"를 선택할 수 있으며 고점-저점에 대해 지정된 기간에 따라 레벨이 그려집니다.
Draw Open Line immediately when a new bar appears.
Draw Open Line immediately when a new bar appears.
Show Close Line — 마감 가격 라인이 그려지는 기간입니다. "고점 및 저점에 대한 모든 TF"를 선택할 수 있으며 고점-저점에 대해 지정된 기간에 따라 레벨이 그려집니다.
Week starts on Sunday — 주는 일요일에 시작됩니다. 터미널에서는 기본적으로 W1 캔들이 일요일에 시작됩니다. 'false'로 설정하면 월요일에 주가 시작됩니다.
Show levels 쇼 레벨
from M45/M90 to Year — 선택한 기간의 최고-최저를 표시합니다. 년, 6개월, 4개월, 3개월, 2개월, 월, 주, 일, 4-6-8-12시간
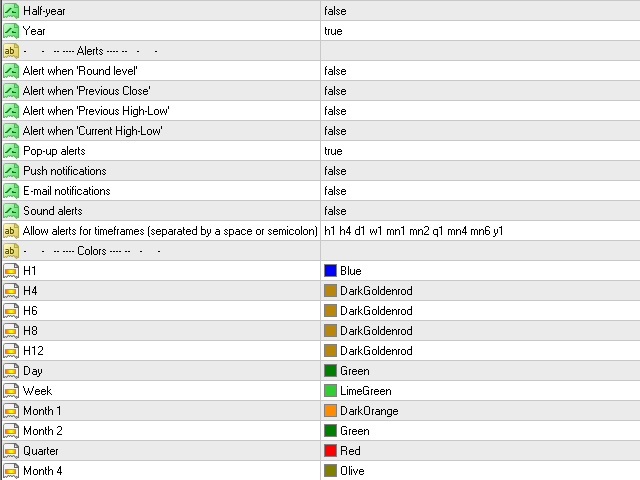
Alerts 경고
Alert when 'Round level' — 가격이 라운드 수준에 도달하면 경고를 보냅니다.
Alert when 'Current Highs-Lows' — 가격이 현재 수준에 도달하면 경고를 보냅니다.
Alert when 'Previous High-Low' — 가격이 이전 수준에 도달하면 경고를 보냅니다.
Pop-up alerts — 팝업 알림.
Push notifications — 푸시 알림.
E-mail notifications — 이메일 알림.
Sound alerts — 소리 알림.
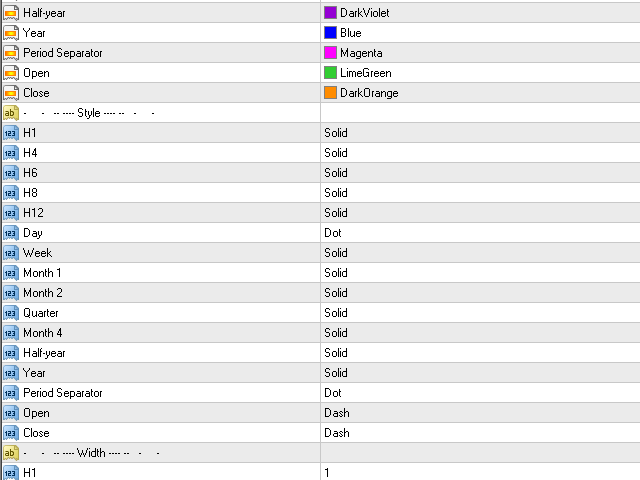
Colors 그림 물감
from M45 to Year — 기간 선의 색상 조정.
Period Separator — 마침표 구분선의 색상입니다.
Line style 선 스타일
from M45 to Year — 기간선 스타일.
Period Separator — 마침표 구분선의 스타일입니다.
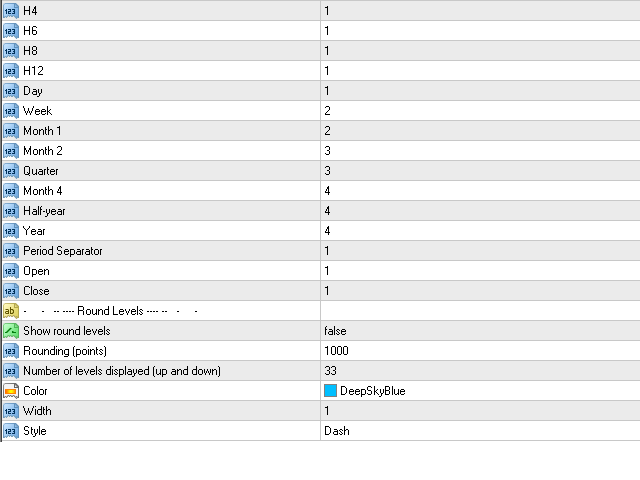
Line width 선의 폭
from M45 to Year — 기간 선 너비.
Period Separator — 마침표 구분선의 너비입니다.
Round Levels 라운드 레벨
Show round levels — 라운드 레벨을 표시합니다.
Rounding (points) — 반올림(점).
Number of levels displayed (up and down) — 현재 수준에서 위 및 아래로 표시할 수준 수입니다.
Color — 색상.
Width — 너비.
Style — 스타일.
이 지표는 지정된 기간의 OHLC(HLOC)를 보여줍니다 (맞춤형 막대 또는 맞춤형 캔들).


great indicator, worth every penny.