Levels of Timeframes
- Indicatori
- Versione: 4.80
- Aggiornato: 10 novembre 2025
- Attivazioni: 10

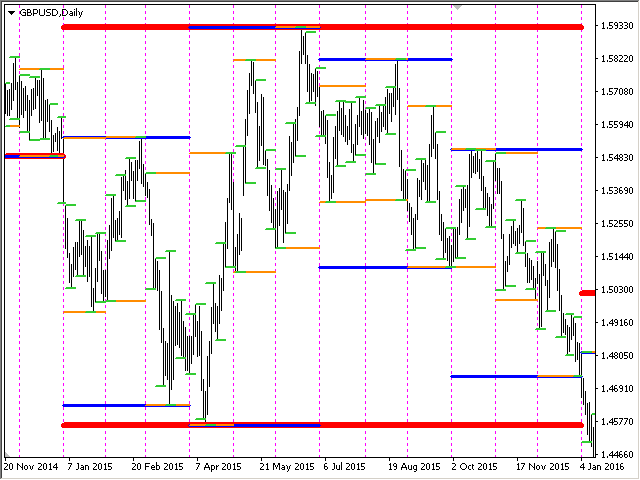
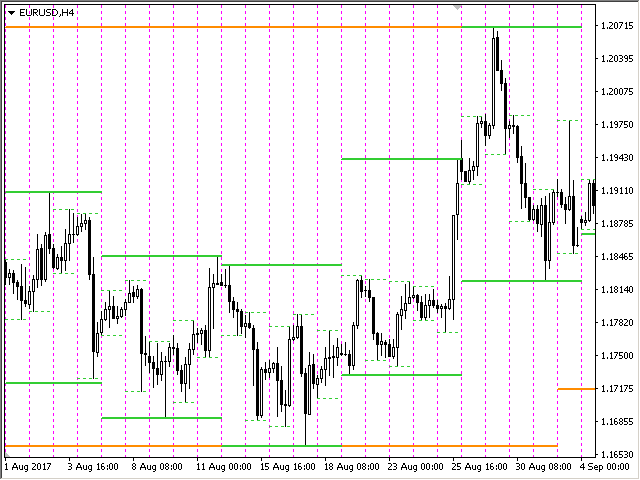
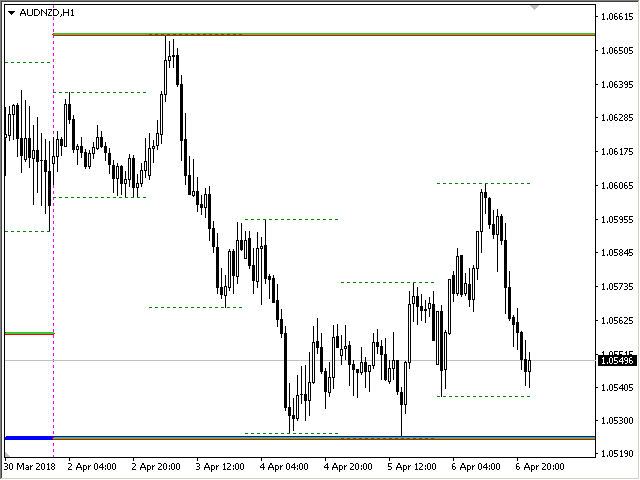
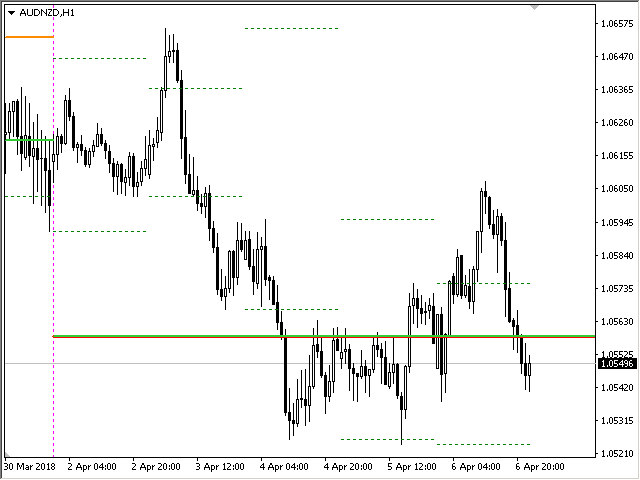
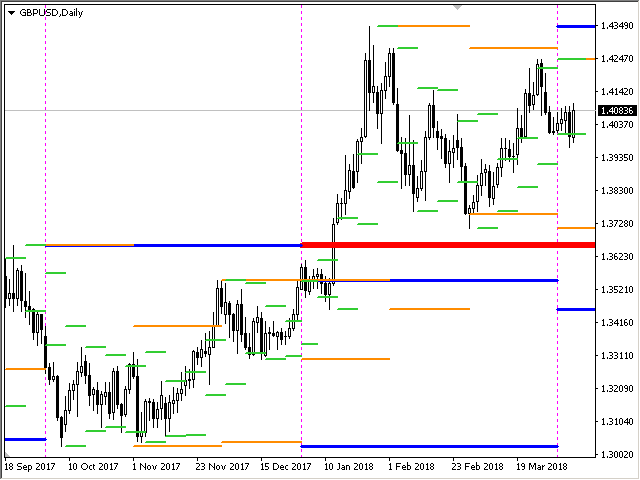
L'indicatore mostra i livelli Alto/Basso/Apertura/Chiusura da altri intervalli di tempo (e non standard): Anno, 6 Mesi, 4 Mesi, 3 Mesi, 2 Mesi, Mese, Settimana, Giorno, H3-H6-H8-H12 Ore . Puoi anche impostare lo spostamento per l'apertura delle candele e costruire candele virtuali.
I "separatori di periodo" per uno di questi intervalli di tempo sono disponibili sotto forma di linee verticali. Gli avvisi possono essere configurati per i breakout dei livelli attuali o precedenti (breakout della linea Alto/Basso ieri/ultima settimana, ecc.).
Puoi anche spostare tutti i livelli a destra di un punto. Cioè, il massimo/minimo del periodo precedente verrà mostrato nel periodo corrente.
Parametri
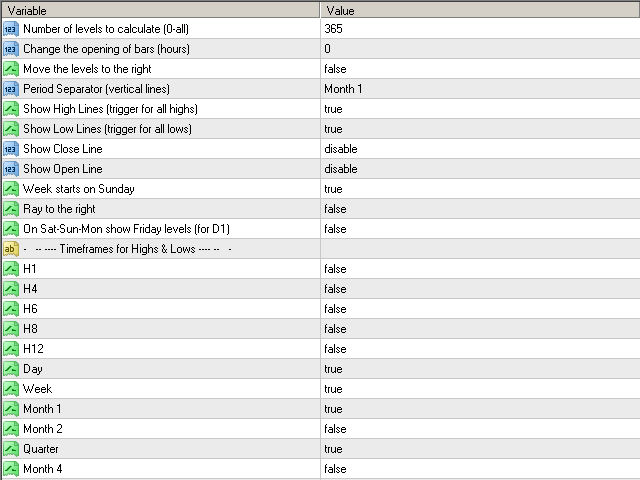
Number of levels to calculate (0-all) — quante barre verranno visualizzate sullo schermo.
Change the opening of bars (hours) — sposta l'apertura delle candele di n ore. L'indicatore disegnerà delle barre virtuali tenendo conto del nuovo orario di apertura. I periodi superiori a MN1 non cambiano.
Move the levels to the right — sposta tutti i livelli di una barra a destra. Vedrai i livelli precedenti sulla candela attuale.
Period Separator (vertical lines) — visualizza una linea verticale, separatore punto.
Show High Lines (trigger for all highs) — disabilita o abilita il disegno dei livelli alti.
Show Low Lines (trigger for all lows) — disabilita o abilita il disegno dei livelli bassi.
Show Open Line — intervallo di tempo per il quale verrà tracciata la linea del prezzo aperto. Puoi selezionare "Tutti i TF per massimi e minimi" e i livelli verranno estratti in base ai periodi specificati per il massimo-minimo.
Show Close Line — intervallo di tempo per il quale verrà tracciata la linea del prezzo di chiusura. Puoi selezionare "Tutti i TF per massimi e minimi" e i livelli verranno estratti in base ai periodi specificati per il massimo-minimo.
Week starts on Sunday — nel terminale, per impostazione predefinita, le candele W1 iniziano di domenica. Se impostato su "false", la settimana inizierà lunedì.
Show levels (Mostra livelli)
from H1 to Year — mostra il massimo e il minimo dai periodi selezionati. Anno, 6 Mesi, 4 Mesi, 3 Mesi, 2 Mesi, Mese, Settimana, Giorno, 4-6-8-12 Ore
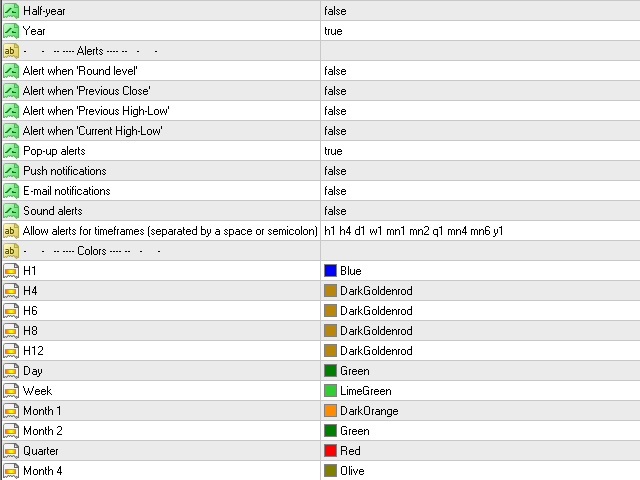
Alerts (Avvisi)
Alert when 'Round level' invia un avviso quando il prezzo tocca un livello rotondo.
Alert when 'Current Highs-Lows' — invia un avviso quando il prezzo tocca i livelli attuali.
Alert when 'Previous High-Low' — invia un avviso quando il prezzo tocca i livelli precedenti.
Pop-up alerts — Avvisi pop-up.
Push notifications — Le notifiche push.
E-mail notifications — Notifiche di posta elettronica.
Sound alerts — Avvisi sonori.
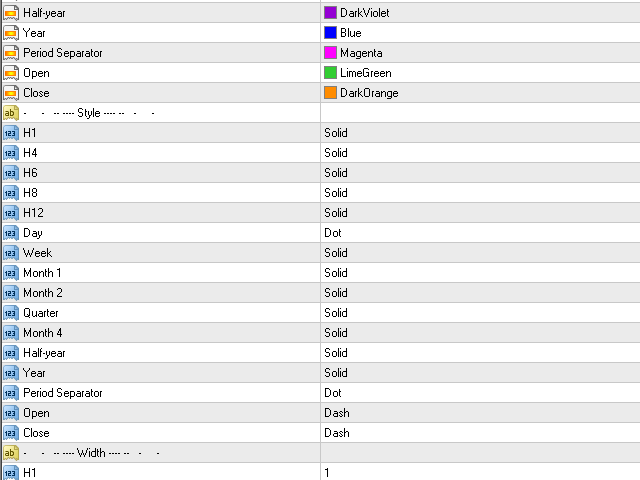
Colors (Colori)
from H1 to Year — regolazione del colore per le linee del periodo.
Period Separator — colore delle linee di separazione del periodo.
Line style (Stile della linea)
from H1 to Year — stile della linea del periodo.
Period Separator — stile delle linee di separazione del periodo.
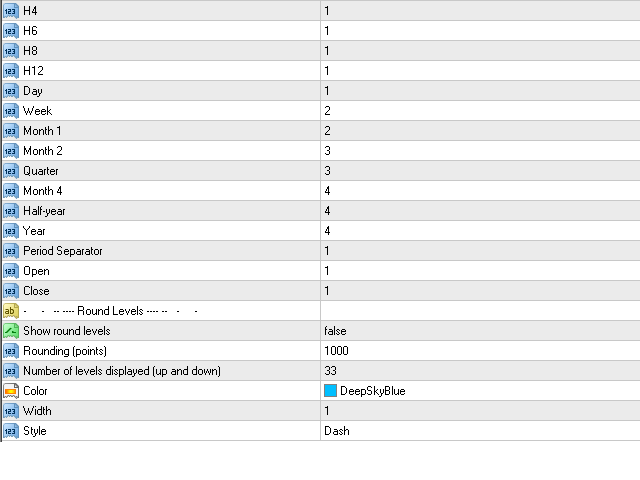
Line width (Larghezza della linea)
from H1 to Year — larghezza della linea del periodo.
Period Separator — larghezza delle linee di separazione del periodo.
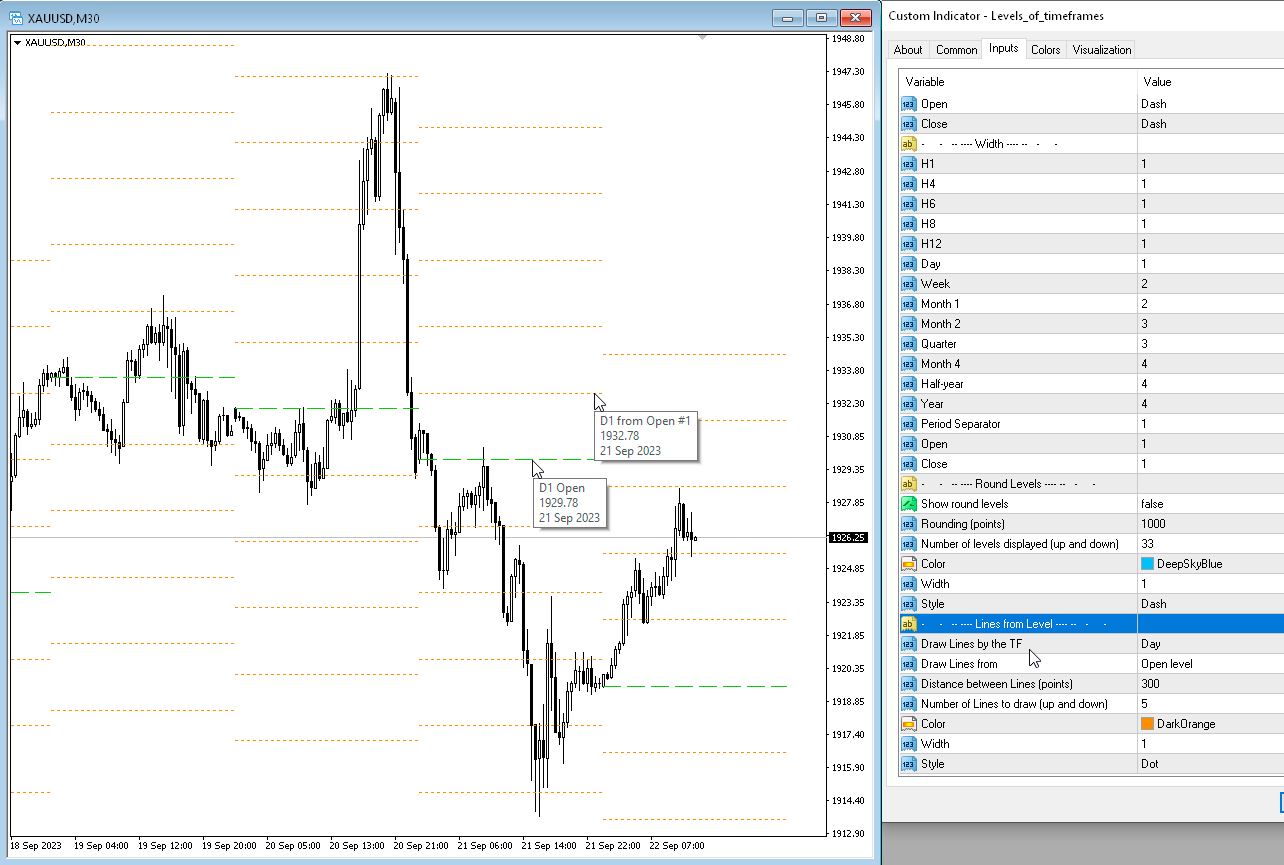
Round Levels (Livelli rotondi)
Show round levels — Mostra livelli rotondi.
Rounding (points) — Arrotondamento (punti).
Number of levels displayed (up and down) — il numero di livelli da visualizzare, su e giù rispetto al livello corrente.
Color — Colore.
Width — Larghezza.
Style — Stile.
L'indicatore mostra l'OHLC (HLOC) degli intervalli di tempo specificati (barre personalizzate o candele personalizzate).


great indicator, worth every penny.