Double top bottom scanner with RSI filter
- Indicators
-
Jan Flodin
 Hello, my name is Jan and I have been developing automated trading tools for the last 9 years. I am originally from Sweden but have lived in the Czech Republic since 2003.
PRODUCTS - Version: 2.9
- Updated: 8 December 2023
- Activations: 10
I recommend you to read the product's blog (manual) from start to end so that it is clear from the beginning what the indicactor offers.
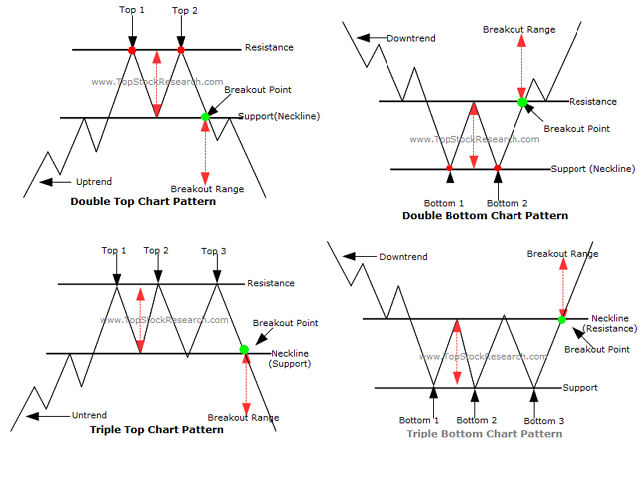
This multi time frame and multi symbol indicator identifies double or triple top/bottom formations or a following neckline breakout (confirmed top/bottom). It offers filters for RSI overbought/oversold, candle patterns (pin bar, engulfing, tweezer, morning/evening star, three line strike) and divergences (MACD, OsMA, Awesome (AO), RSI, CCI, Stochastic) which makes it possible to filter out only the strongest setups. The indicator can also be used in single chart mode. Please read more about this option in the product's blog. Combined with your own rules and techniques, this indicator will allow you to create (or enhance) your own powerful system.
Features
- Can monitor all symbols visible in your Market Watch window at the same time. Apply the indicator to just one chart and instantly monitor the entire market.
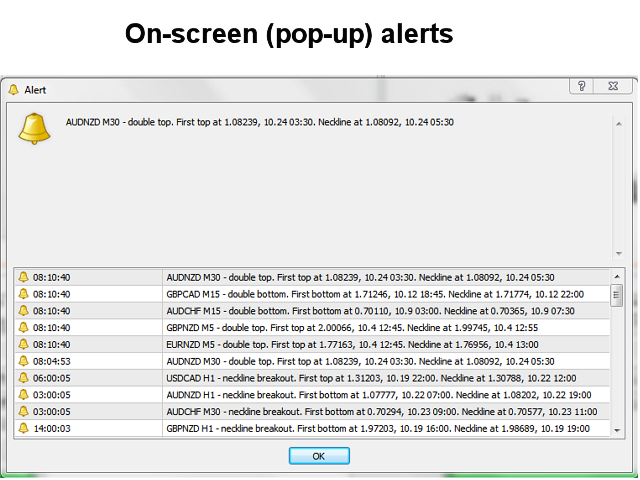
- Can monitor every time frame, from M1 to MN, and sends you a real-time alert when when the second or third top/bottom is identified or at neckline breakout. All Metatrader native alert types are supported.
- Can use RSI, a selection from different candle patterns and divergences to properly identify potential reversals.
- Moving average trend filter
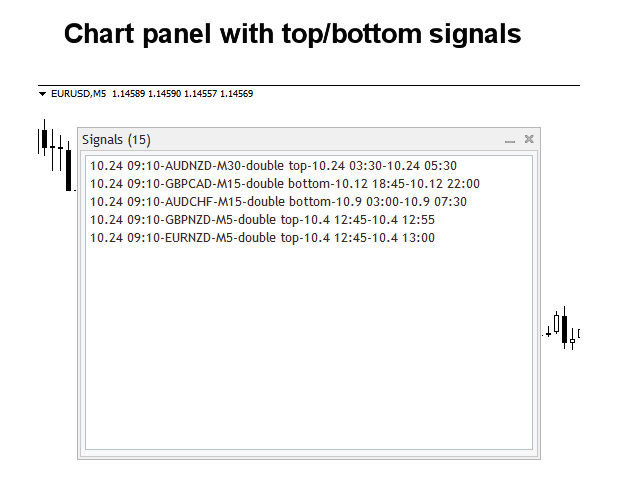
- The indicator includes an interactive panel. When clicking on an item a new chart will be opened with the symbol and time frame in question.
- The indicator writes the signals to a text file or as global variables which can also be used by an Expert Advisor (EA) for auto trading.
Input parameters
The description and explanation of the input parameters can be found here.
Important
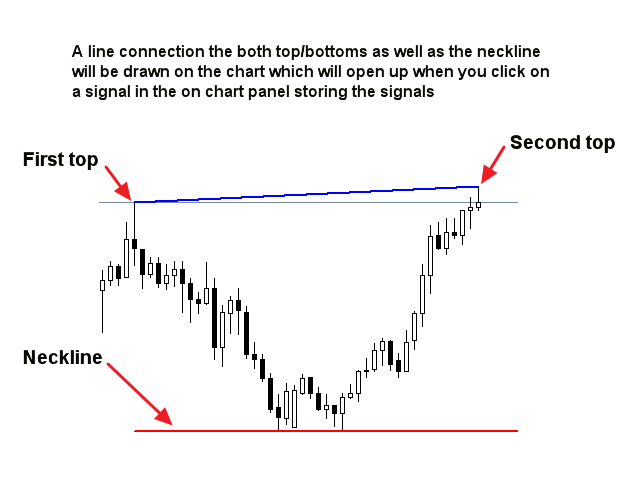
Please note that due to the multifunctionality neither buy and sell advice nor lines and arrows will be drawn on the chart where the indicator has been installed. A line between the extremums as well as the neckline will be drawn on the chart which can be opened from the panel.
It is highly advisable to put the indicator on a clean (empty) chart without any other indicators or Expert Advisors on it which could interfere with the scanner.


It's not just a simple scanner for DB & DT. It has the ability to notify early, allowing for processing time. It becomes very powerful when you apply the provided filters. On this note, I would like some confirmed settings... The fact that the signals are recorded and remain in the MT4 window is a fantastic idea. The way the indicator operates is close to the trader and deviates from the mindset of simple programming. Kudos to the creator. Excellent work!!! The best in its category. I will also purchase the scanner for S&R. It saves me from tasks I've been doing for years on my charts.