Double top bottom scanner with RSI filter
- Indikatoren
-
Jan Flodin
 Hello, my name is Jan and I have been developing automated trading tools for the last 9 years. I am originally from Sweden but have lived in the Czech Republic since 2003.
PRODUCTS - Version: 2.9
- Aktualisiert: 8 Dezember 2023
- Aktivierungen: 10
Ich empfehle Ihnen,den Blog des Produkts (Handbuch) von Anfang bis Endezu lesen, damit von Anfang an klar ist, was der Indikator bietet.
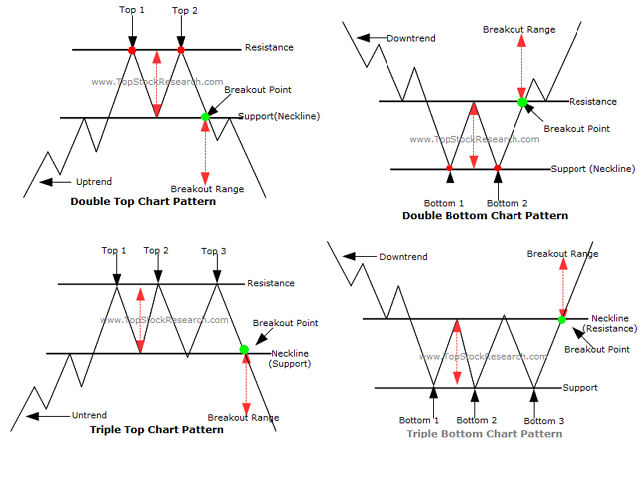
Dieser Multi-Zeitrahmen- und Multisymbol-Indikator identifiziert doppelte oder dreifache Top/Bottom-Formationen oder einen folgenden Halsausbruch (bestätigtes Top/Bottom). Er bietet Filter für RSI überkauft/überverkauft, Kerzenmuster (Pin Bar, Engulfing, Tweezer, Morning/Evening Star, Three Line Strike) und Divergenzen (MACD, OsMA, Awesome (AO), RSI, CCI, Stochastic), die es ermöglichen, nur die stärksten Setups herauszufiltern. Der Indikator kann auch im Single-Chart-Modus verwendet werden. Kombiniert mit Ihren eigenen Regeln und Techniken können Sie mit diesem Indikator Ihr eigenes leistungsstarkes System erstellen (oder erweitern).
Merkmale
- Kann alle in Ihrem Market Watch-Fenster sichtbaren Symbole gleichzeitig überwachen. Wenden Sie den Indikator nur auf einen Chart an und überwachen Sie sofort den gesamten Markt.
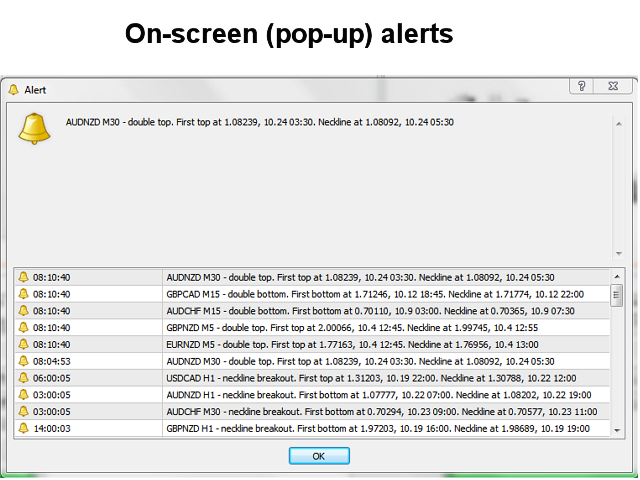
- Kann jeden Zeitrahmen überwachen, von M1 bis MN, und sendet Ihnen einen Echtzeit-Alarm, wenn das zweite oder dritte Top/Bottom identifiziert wird oder beim Durchbruch der Nackenlinie. Alle Metatrader-eigenen Alarmtypen werden unterstützt.
- Kann RSI, eine Auswahl aus verschiedenen Kerzenmustern und Divergenzen verwenden, um potenzielle Umkehrungen richtig zu identifizieren.
- Trendfilter mit gleitendem Durchschnitt
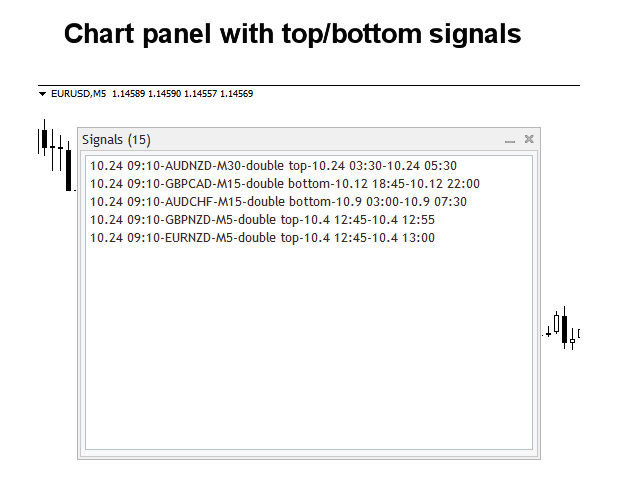
- Der Indikator enthält ein interaktives Panel. Wenn Sie auf ein Element klicken, wird ein neues Diagramm mit dem betreffenden Symbol und Zeitrahmen geöffnet.
- Der Indikator schreibt die Signale in eine Textdatei oder als globale Variablen, die auch von einem Expert Advisor (EA) für den automatischen Handel verwendet werden können.
Eingabeparameter
Die Beschreibung und Erklärung der Eingabeparameter finden Sie hier.
Wichtig
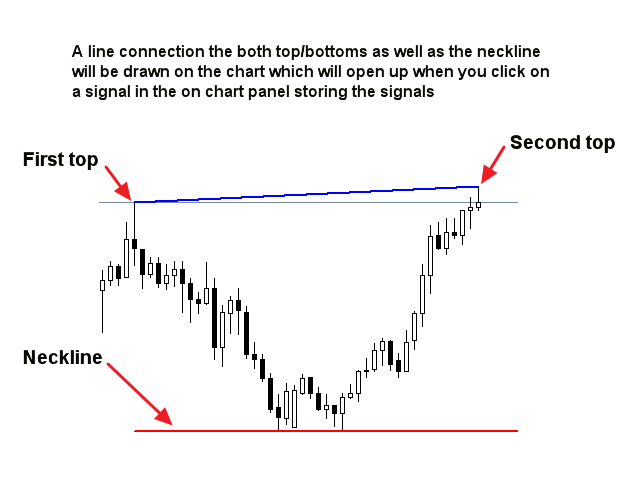
Bitte beachten Sie, dass aufgrund der Multifunktionalität weder Kauf- und Verkaufshinweise noch Linien und Pfeile auf dem Chart eingezeichnet werden, auf dem der Indikator installiert wurde. Eine Linie zwischen den Extremwerten sowie die Nackenlinie werden auf dem Chart eingezeichnet, der über das Panel geöffnet werden kann.
Es ist sehr ratsam, den Indikator auf einem sauberen (leeren) Chart zu installieren, auf dem sich keine anderen Indikatoren oder Expert Advisors befinden, die den Scanner stören könnten.


It's not just a simple scanner for DB & DT. It has the ability to notify early, allowing for processing time. It becomes very powerful when you apply the provided filters. On this note, I would like some confirmed settings... The fact that the signals are recorded and remain in the MT4 window is a fantastic idea. The way the indicator operates is close to the trader and deviates from the mindset of simple programming. Kudos to the creator. Excellent work!!! The best in its category. I will also purchase the scanner for S&R. It saves me from tasks I've been doing for years on my charts.