Zero Lag MA Trend Levels MT4 with Scanner
- Indicators
-
Duc Hoan Nguyen
 I develop practical trading tools for MetaTrader 4/5, with a focus on indicator integration, Multi-Timeframe analysis, market scanning, and automated trading solutions.
My work mainly includes:
• Indicator-to-EA Solutions - Version: 3.0
- Updated: 5 October 2026
- Activations: 10
Get ALL my MT4 & MT5 indicators FREE — See how here
Special offer: ALL TOOLS, just $35 each for a limited time!
New tools will be $30 for the first week or the first 3 purchases!
Trading Tools Channel on MQL5: Join my MQL5 channel to receive the latest updates
See the MT5 version at: Zero Lag MA Trend Levels MT5 Multi-TF Scanner
See the MT4 version at: Zero Lag MA Trend Levels MT4 Multi-TF Scanner
See more products at: All Products or Trading Indicators, Special Offers & New Releases
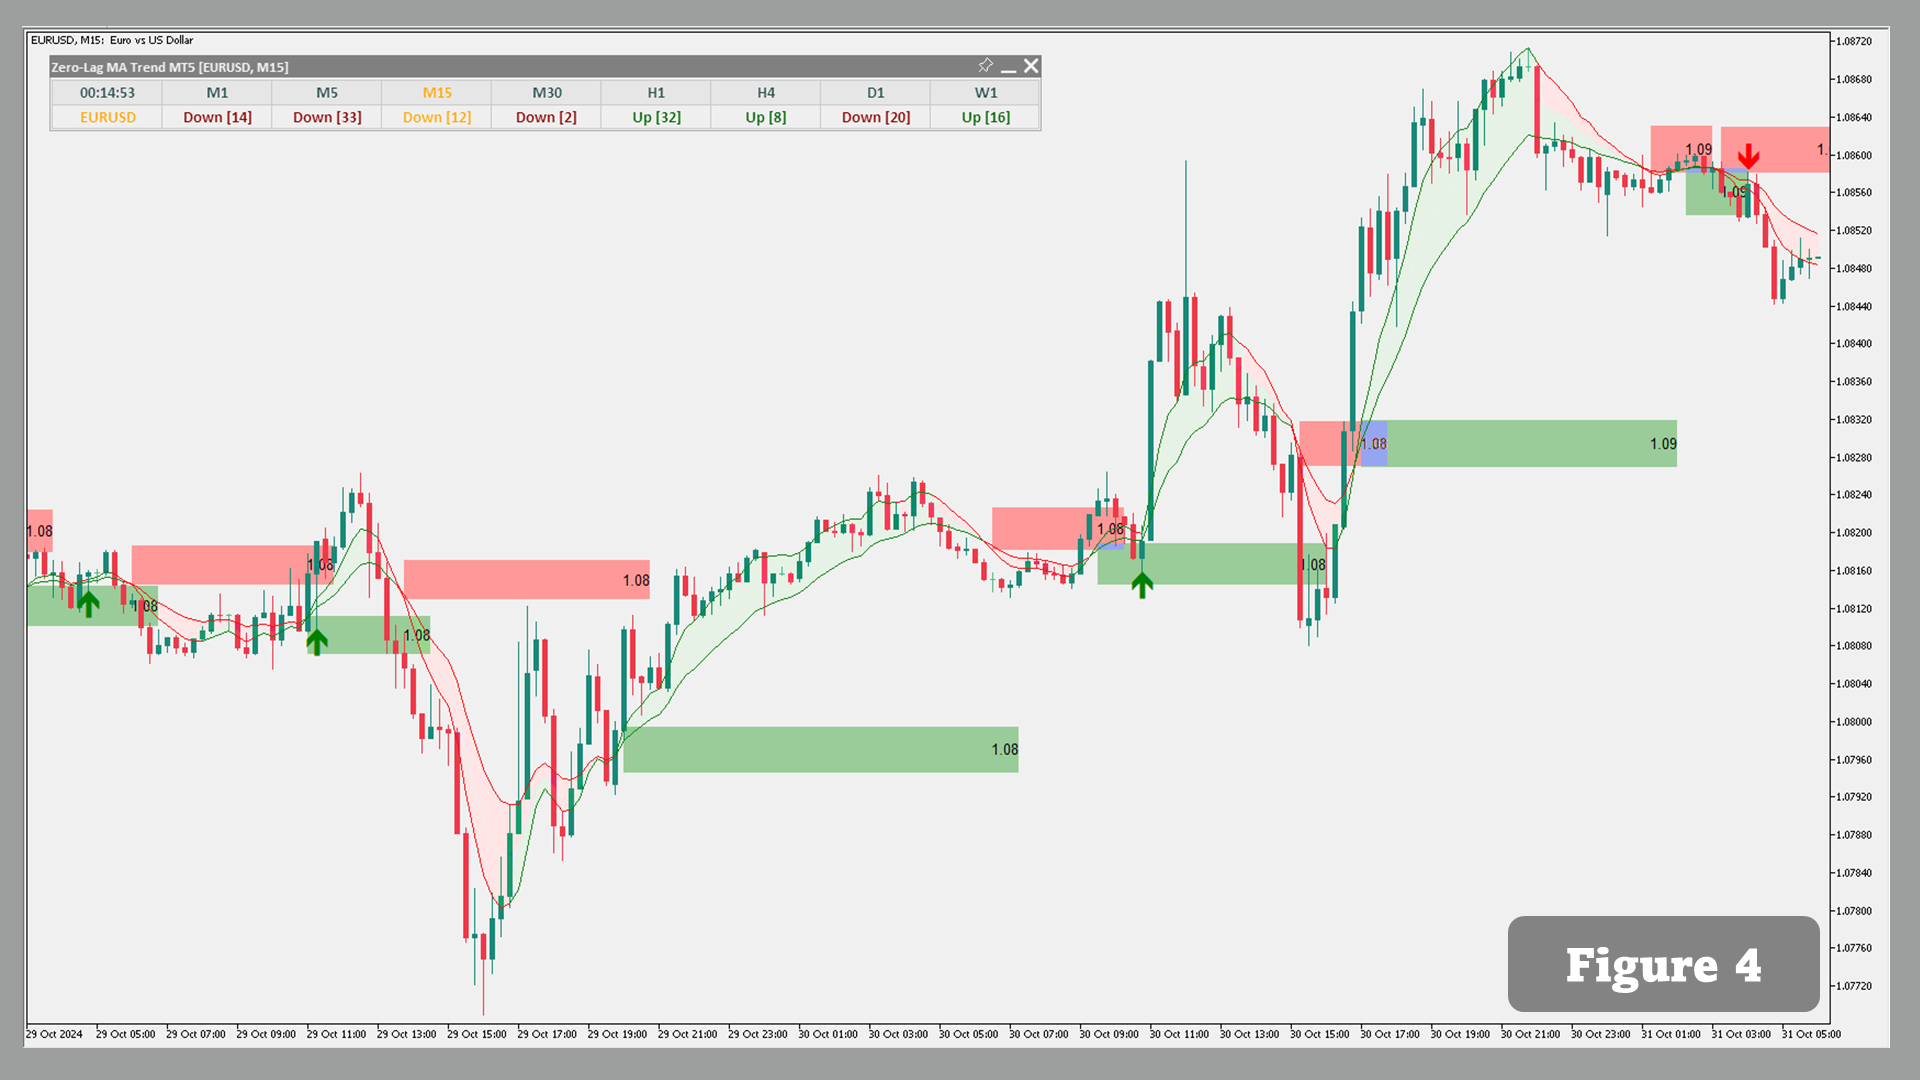
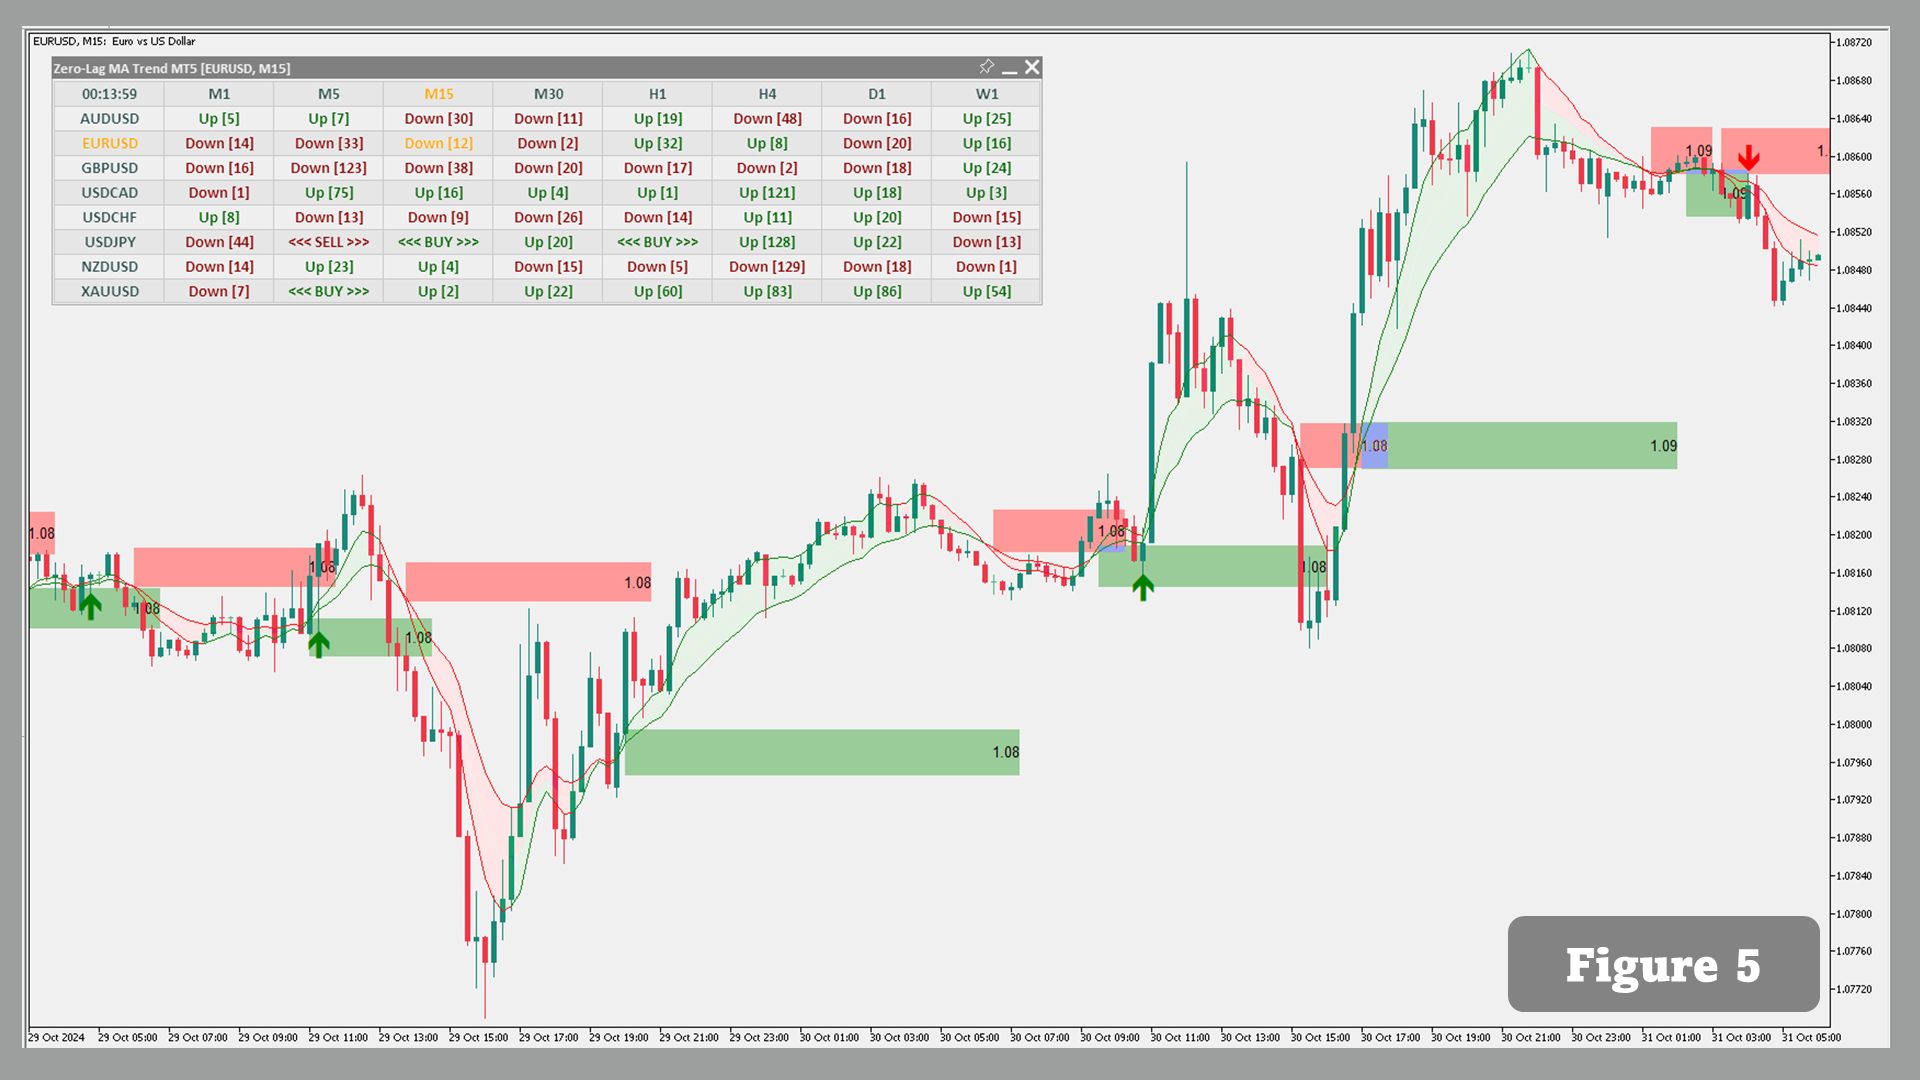
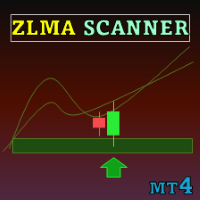
ZLMA Trend Levels combines a Zero-Lag Moving Average (ZLMA), volatility-based trend zones, and Buy/Sell signals with a Multi-Timeframe and Multi-Symbol Scanner. Review your selected markets, compare conditions across timeframes, and move from the Scanner overview to individual charts.
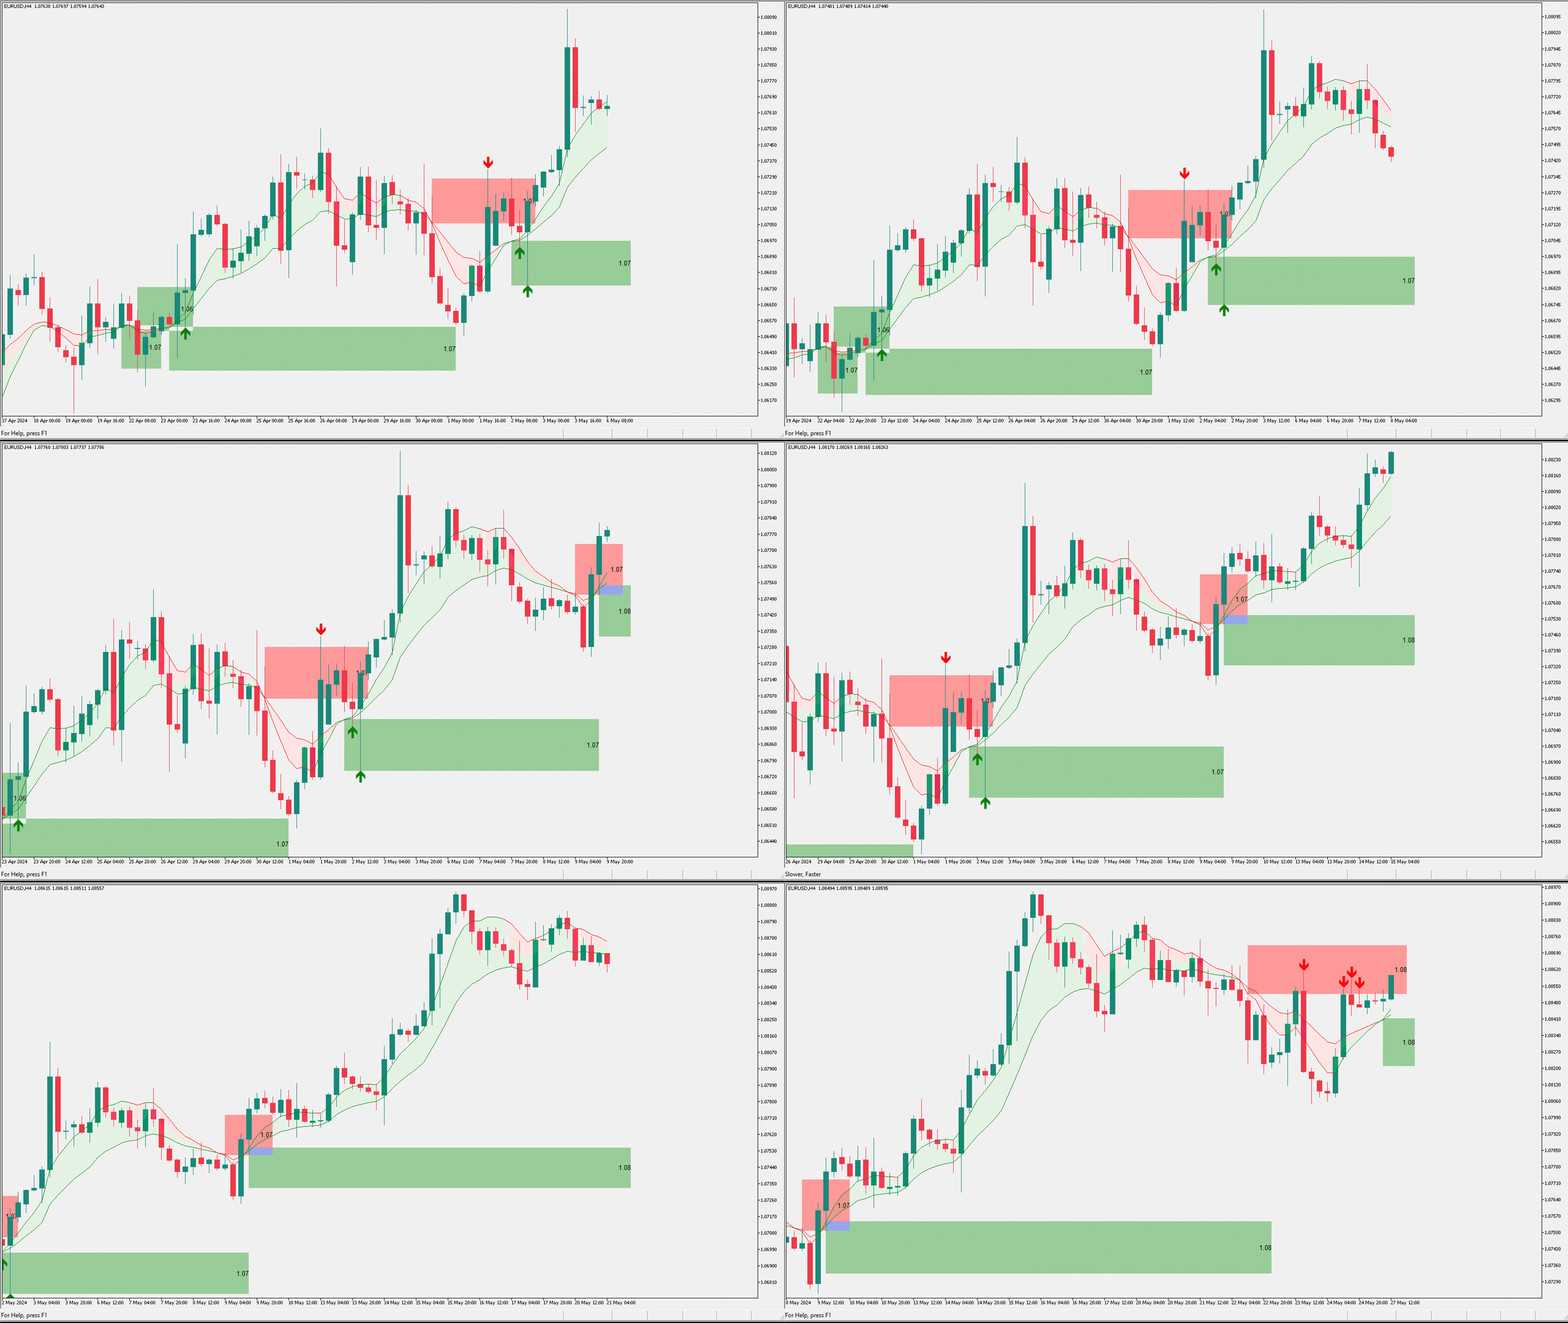
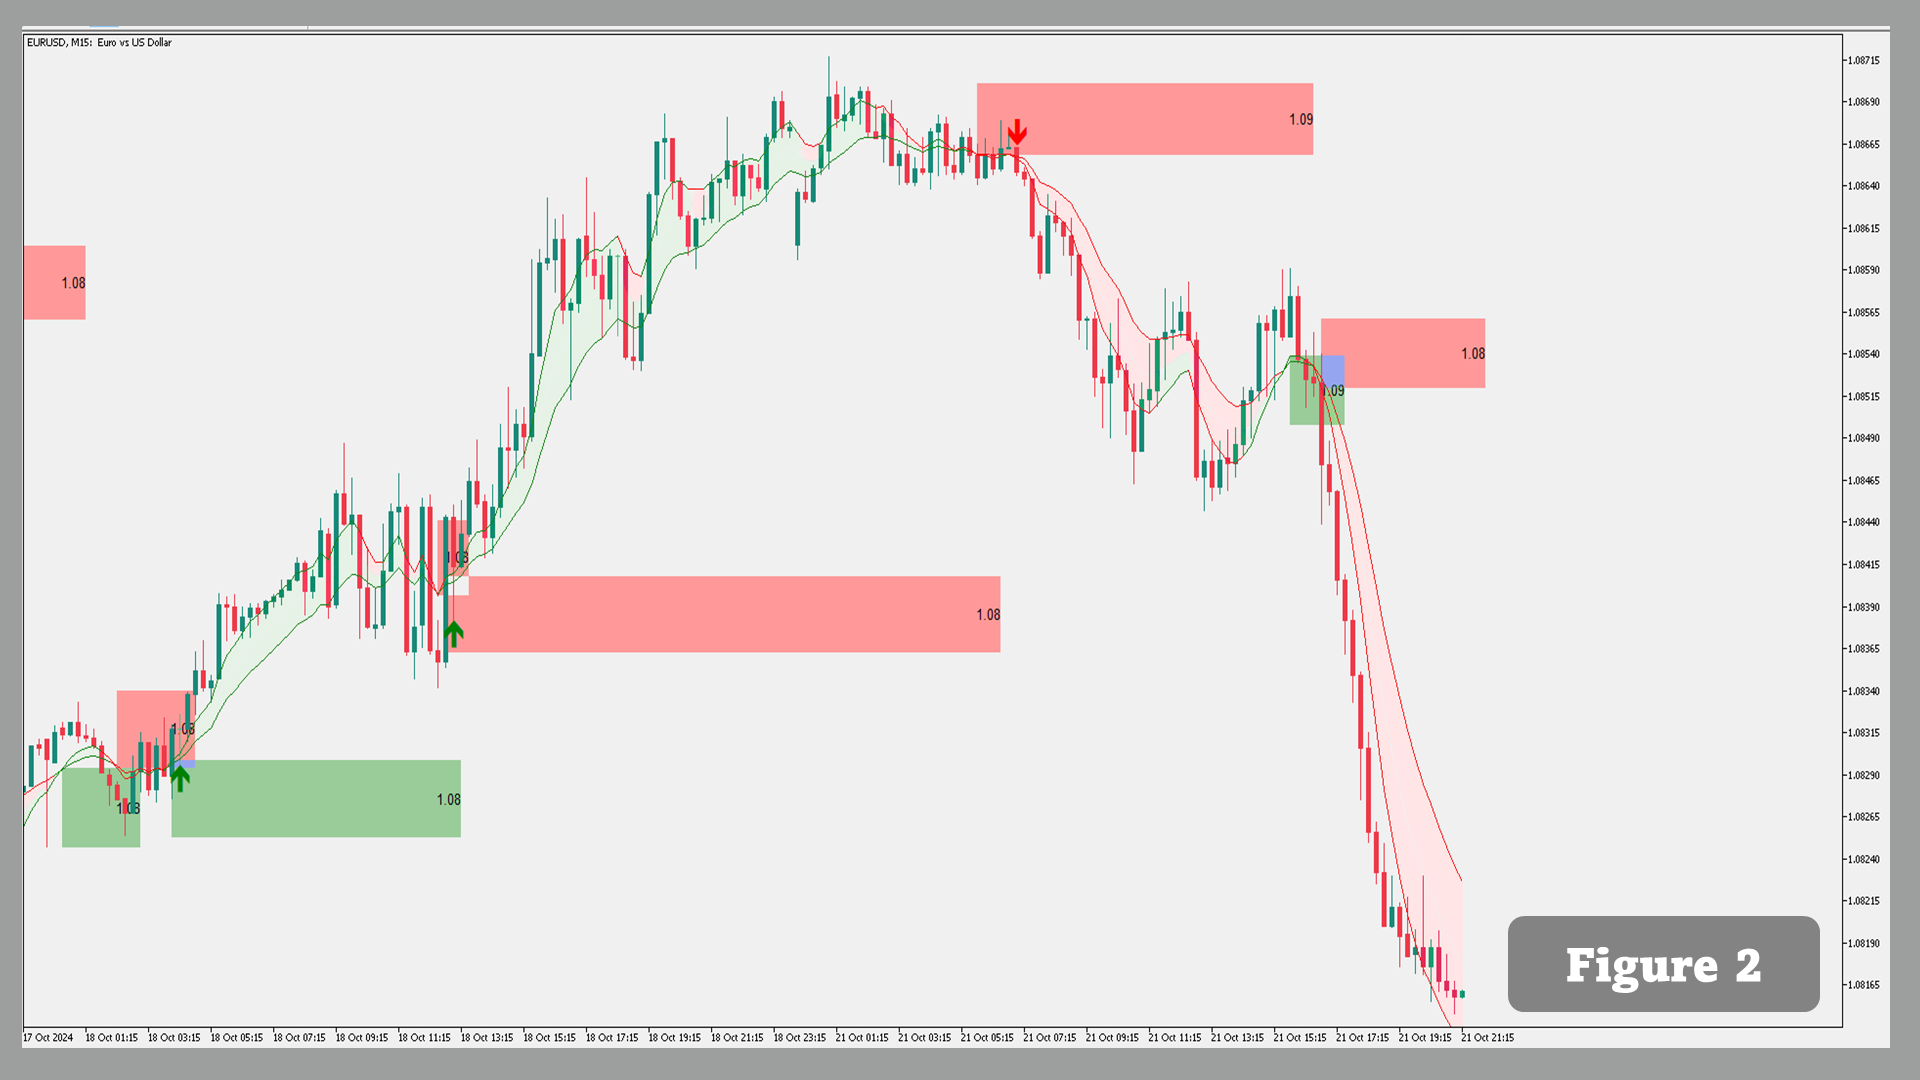
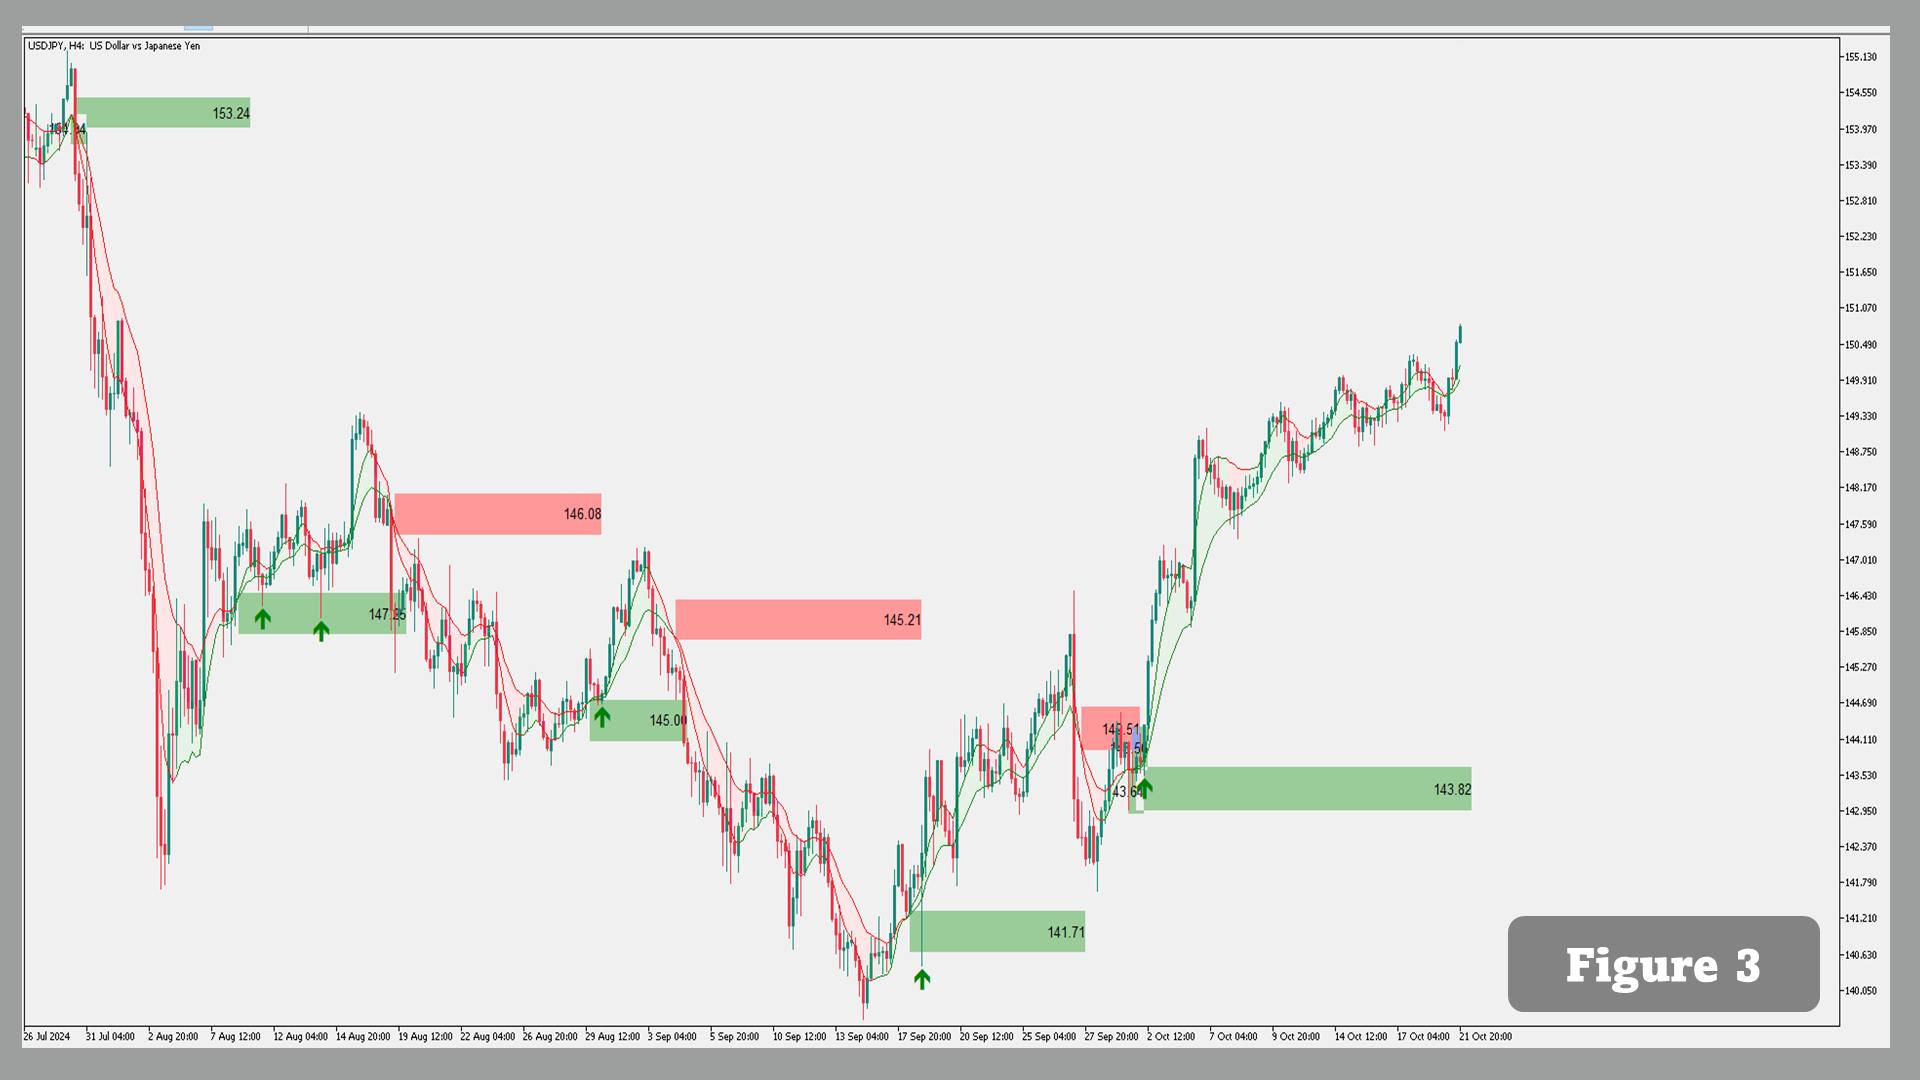
Trend-shift dots mark crossovers between ZLMA and the reference moving average. Each shift creates a bullish or bearish zone whose height is determined by Average True Range (ATR) and your selected multiplier. These zones provide defined price levels for monitoring subsequent price interactions.
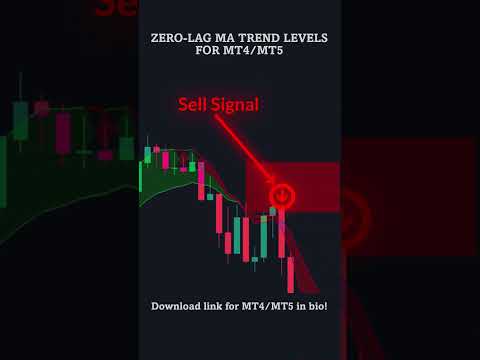
Buy arrows mark qualifying upward crossings of an active bullish zone’s upper boundary. Sell arrows mark qualifying downward crossings of an active bearish zone’s lower boundary. Separate settings control signal confirmation and zone breakout confirmation. Broken zones can remain visible with different styling or be removed from the chart.
The indicator brings these functions into your analysis workflow:
- Monitor multiple markets from one chart. Follow selected symbols across up to 10 timeframes in the Scanner. Choose the current symbol, symbols from Market Watch, or a custom symbol list. Click a Scanner cell to change the chart for closer inspection.
- Add context from another timeframe. Display indicator information from your selected timeframe directly on the current chart. Compare higher-timeframe trend conditions with price interactions and signals on your working timeframe.
- Give each timeframe its own settings. Use shared parameters or configure moving-average methods and periods, ATR settings, confirmation rules, alerts, and appearance separately for individual timeframes. An optional parameter panel lets you review the configuration.
- Follow the events you select. Enable alerts for trend shifts, Buy/Sell signals, or both. Monitor the current symbol or all Scanner symbols through terminal messages, push notifications, email, and sound. Alerts are checked using the previous closed candle.
- Keep the workspace focused. Show or hide signals, moving-average lines, the middle line, zones, and labels. Customize colors, transparency, line widths, arrow styles, and fonts. Move the Scanner and adjust its position and cell dimensions to suit your chart layout.
Independent MA and ZLMA calculation settings let you adjust the applied price, methods, periods, and volume sources for calculations that use volume. Optional shading, timeframe labels, and a candle countdown provide additional chart context.
Configure your markets, timeframes, and alert conditions to build a view around the information you follow.
Values and markers on the current candle may change before it closes.
Setup instructions: Multi-Timeframe & Scanner User Guide.