FE Fibo Expansion

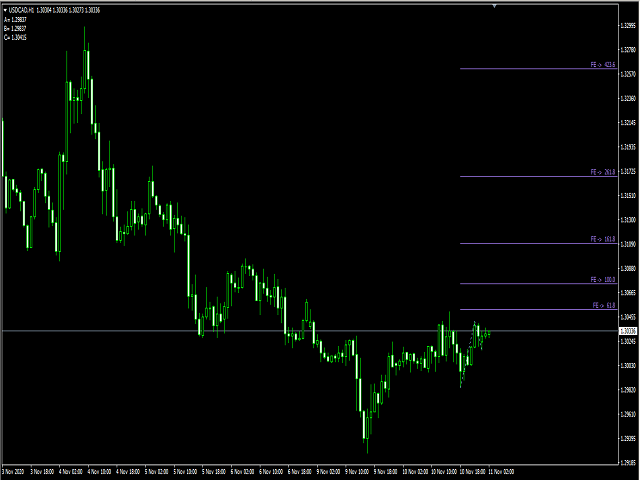
This is Fibo Expansion.

You can use it, as profit target at any level...

It use price Highs and Lows and price between...

It is simple and easy to use...

No Input menu, just drag it on your chart and it ready to use...

The blue and red dot color indicate it direction...

It also use as the same as fractal high and low price as the points to construct the levels...

No more analysis to choose the points..

Recommended products
UPD1 Fibo Levels
Vitaliy Kuznetsov
5 (3)
The indicator analyzes the specified number of candles and plots Fibonacci levels based on the high-low. Since the levels are rearranging, we are interested in the right side of the range. The price magnetizes the levels and reacts to the touch. Use this tool to find a trend entry point after a correction. If on the left we see that the levels have risen perfectly, then we can assume that we have found the end of the movement at the extreme point. All lines are drawn through buffers or objects (
FREE
This indicator is based on Mr. Mark Fisher's ACD strategy, based on the book "The Logical Trader." - OR lines - A lines - C lines - Daily pivot range - N days pivot range - Customizable trading session - Drawing OR with the desired time Drawing levels A and C based on daily ATR or constant number - Possibility to display daily and last day pivots in color zone - Displaying the status of daily PMAs (layer 4) in the corner of the chart - Show the order of daily pivot placement with multi-day pi
FREE
The   Pivot Point indicator   automatically calculates and displays the pivot point line and support and resistance levels. Pivot can be calculated according to the Classic, Floor, Fibonacci, Woodie, Camarilla or DeMark formula. It is also possible to select the period for calculating the indicator. A trader can choose from daily, weekly, monthly, or user-defined periods. Types of pivots Classic Floor Fibonacci Woodie Camarilla DeMark Main features The indicator shows the current and historic
FREE
MP Demark Pivot Levels
Pierre Ksachikian
4 (1)
This indicator is stand alone version from  MP Pivot Levels  (All in one) containing Demark's Pivots. Calculations:     PP = X / 4     R1 = X / 2 - LOWprev     S1 = X / 2 - HIGHprev Uses: When the pair currency price may change the direction of movement. Possible constraints of support and resistance that creates plateaus for the currency pair prices. Tendency identification by comparing the present prices according to current day's pivot point and also the prior day's pivot points. ____________
FREE
This is just a simple indicator that show Alert when the Current candle Close Above the Trendline. Previous candle do not affect the Alert.  The indicator is tied to the Trendline so if the Trendline is accidentally deleted, the Alert will not work. The indicator will draw another Trendline if the current Trendline is deleted.  Removing the indicator will removed the Trendline. There are 4 type of Alert to set: Popup Alert, Signal Alert, Push Notification, Comment.
FREE
Convenient drawing of parabolic channels by four points (two lower and two upper extremums). Additional control keys: N (New) - Start drawing a new channel. C (Clear) - Deletes the current channel. By default, the current channel is the last channel. But you can click on the line of any channel to make it current. Click on the gear in the upper right corner to set some parameters for all channels or the current channel. All work is visible from the animated Gif. Channels are saved when the time
FREE
-- Simple but effective. Inversion Indicator -  What is it? A trend-following overlay indicator that combines SuperTrend logic with exponential curve technology. It detects trend direction, draws a dynamic channel on the chart, and sends real-time alerts when the trend reverses. How does it work? The indicator calculates an exponential baseline using ATR and a SuperTrend factor. When price closes above or below this baseline, a trend reversal is confirmed. A green arrow marks the start of a
FREE
MQLTA Support Resistance Lines is an indicator that calculates the historical levels of Support and Resistance and display them as Lines on chart. It will also Alert you if the price is in a Safe or Dangerous zone to trade and show you the distance to the next level. The indicator is ideal to be used in other Expert Advisor through the iCustom function. This DEMO only works with AUDNZD, the full product can be found at https://www.mql5.com/en/market/product/26328 How does it work? The indicator
FREE
pivot points using by many traders and pivot levels most of the times are very helpfull . this indicator is a custom with internal parameters. it can show two times pivot (weekly and daily). you can choose periods total for each time showing pivots.( 1 week , 2 week ,...1day , 2day ,...) when use weekly and daily pivots , it can show you many support and resistance zones. if have proposal comment too me for upgrading indicator.
FREE
Pivot Classic, Woodie, Camarilla, Fibonacci and Demark Floor/Classic Pivot points, or simply pivots, are useful for identifying potential support/resistance levels, trading ranges, trend reversals, and market sentiment by examining an asset's high, low, and closing values. The Floor/Classic Pivot Points can be calculated as follows. Pivot Point (P) = (High + Low + Close)/3 S1 = P * 2 - High S2 = P - (High - Low) S3 = Low – 2*(High - P) R1 = P * 2 - Low R2 = P + (High - Low) R3 = High + 2*(P - L
FREE
Description: The indicator measures, through the zigzag indicator, the levels of trend or correction. It shows in the chart the levels of each low or high detected. KEY LINKS:   How to Install  –  Frequent Questions  -  All Products  How is this indicator useful? This indicator determines, depending on Zigzag parameter if a trend is beginning, developing, or ending This indicator determines the direction of the trend Components Levels as positive or negative numbers, depending on the direction
FREE
The SFT Fibo Smart Pivot indicator is a powerful trading tool based on the Fibonacci Golden Ratio, designed to identify key support and resistance levels in the forex market. This indicator has the ability to pinpoint significant price levels that can serve as entry and exit points for trades. It enables traders to analyze the market more effectively and make well-informed decisions. The indicator uses the Fibonacci Golden Ratio to accurately determine support and resistance levels. These levels
FREE
SRP (Strong Retracement/Reversal Points) is a powerful and unique support and resistance indicator. It displays the closest important levels which we expect the price retracement/reversal! If all level are broken from one side, it recalculates and draws new support and resistance levels, so the levels might be valid for several days depending on the market! Key Features You can use it in all time-frames smaller than daily! Displays closest significant support and resistance levels Update the le
FREE
AC Pivot Panel – Your Ultimate Pivot Trading Tool The   AC Pivot Panel   is a powerful yet user-friendly pivot point indicator designed to help traders identify key support and resistance levels with ease. Whether you’re a beginner or an experienced trader, this indicator simplifies pivot trading and enhances your decision-making process. Key Features : Interactive Selection Panel : Easily adjust pivot settings directly on the chart with a compact and intuitive panel. Multiple Pivot Methods : C
FREE
Forex trading support timer: - This is an indicator that supports a trader's trading process. - Before placing a BUY or SELL order, it is advisable to observe what the current time is like, to get the best position when trading. Function of indicator: - Display information about candle closing time of different timeframes (M1,M5,M15,H1), best used when Scalping. - Show market spreads. - Show TimeZone Trading. - Displays the remaining time of a session.
FREE
Wa Candle Timer MT4
Wachinou Lionnel Pyrrhus Sovi Guidi
5 (1)
Wa Candle Timer MT4 Wa Candle Timer MT4 is a powerful and user-friendly indicator designed to display the remaining time until the next candle forms on your MT4 chart. This tool helps traders stay aware of candle closure times, allowing for better trade execution and decision-making. Key Features : Displays the countdown timer for the current candle. Changes color when the remaining time falls below a user-defined percentage. New in v3.00: Customizable alert when the timer reaches a sp
FREE
Grapic ByArrowTrend Pro
Truong Cong Truc
1 (1)
Indicator support for only: Entry Point to Trend Pro Link indicator  support   :   https://www.mql5.com/en/market/product/70867 Supports all currency pairs declared in the definition. Help investors do not need to open many charts. Notice the DEAL:  multiple time frames confluence   M15, H1, H4. Entry Point to Trend Pro The indicator helps investors to identify the earliest and perfect reversal point. Easy to make decision to trade with the trend   Price action trading. support resistance an
FREE
SR indicator
Alexander Chertnik
5 (2)
SR is a support and resistance indicator, it shows major highs and lows by different colors. The color of a level is changing if the last high or low are touching it. After the closing of a bar above or below level, it will delete it. extern inputs: loop for candles / colors / drawing time *This indicator signal is not perfect and have to be used with other market analysis and confirmations.
FREE
Institutional Levels / Bank levels ... Psychological levels / Quarters theory. This indicator will automatically draw at levels, "000, 200, 500 and 800", what I know as 'Institutional Levels', OR, can also draw levels "000, 250, 500 and 750", onto the chart. Depending on where you have learnt Institutional Level trading / Quarters theory, you may know them as different names, essentially the core idea is that these levels act as strong support & resistance points in most forex markets. Group ch
FREE
BeST_ Classic Pivot Points is an MT4 Indicator that is based on the widely known and definitely classic Pivot Point of a market prices activity. A pivot point is calculated as an average of significant prices (high,low,close) from the performance of a market in the prior trading period. If the market in the following period trades above the pivot point it is usually evaluated as a bullish sentiment, whereas trading below the pivot point is seen as bearish. A pivot point and the associated suppo
FREE
Shows Kaufman Efficiency Ratio value and smoothed by MA. Calculation is based on movement divided by volatility on a specified period. Levels are adjustable as well as visualization. Parameters: KERPeriod - period for ratio calculation. EMAPeriod - period for moving average. Shift - indicator shift. HigherLevel - low value of the higher zone. LowerLevel - high value of the lower zone. ShowHigherZone - allow higher zone drawing. HigherZoneColor - higher zone color. ShowLowerZone - allow lower zon
FREE
Master the Markets with Auto Trading Sessions V1.8E Stop guessing when to enter the market and start trading with institutional precision. The Auto Trading Sessions V1.8E | Global Market Hub is an all-in-one technical powerhouse designed to turn price action into actionable intelligence across Forex, Crypto, and Stocks. Why Traders Choose V1.8E: Global Session Mapping: Automatically visualizes the Asia, London, and New York sessions with clear, color-coded zones, allowing you to capitalize on se
FREE
This indicators automatically draws the Support and resistances levels for you once you've dropped it on a chart.  It reduces the hustle of drawing and redrawing these levels every time you analysis prices on a chart. With it, all you have to do is dropped it on a chart, adjust the settings to your liking and let the indicator do the rest.  But wait, it gets better; the indicator is absolutely free!  Get the new and improved version here:  https://youtu.be/rTxbPOBu3nY Parameters Time-frame  -> T
FREE
.................................if you need pivot point s levels............................... ............................this is a daily pivot point level creator........................... ...it is for daily pivots and show levels at times period H4 , H1 , M30 , M15 ,M 5... .................................also shows levels for 3 last days.............................. ................can use it with other indicators and see important levels...............
FREE
Awesome Pivot Indicator
Komang Putra Riswanjaya
The Pivot Indicator is a vital tool for technical analysis used by traders in the financial markets. Designed to assist in identifying potential reversal points or trend changes, this indicator provides valuable insights into key levels in the market. Key features of the Pivot Indicator include: Automatic Calculations: The Pivot Indicator automatically calculates Pivot Point, Support, and Resistance levels based on the previous period's high, low, and close prices. This eliminates the complexity
FREE
Ava Ffx Signal
Nirundorn Promphao
The principle of this indicator is very simple: detecting the candlestick pattern in H1 timeframe, then monitoring the return point of graph by using the pullback of High-Low of H1 Candlestick and finally predicting BUY and SELL signal with arrows, alerts and notifications. The parameters are fixed and automatically calculated on each time frame. Example: If you install indicator on XAUUSD, timeframe H1: the indicator will detect the reversal, pullback, price action on this timeframe (for exam
FREE
Free automatic Fibonacci is an indicator that automatically plots a Fibonacci retracement based on the number of bars you select on the BarsToScan setting in the indicator. The Fibonacci is automatically updated in real time as new highest and lowest values appears amongst the selected bars. You can select which level values to be displayed in the indicator settings. You can also select the color of the levels thus enabling the trader to be able to attach the indicator several times with differe
FREE
The Chart High Low Indicator is an indicator for META TRADER 4, with the function of analyzing and showing the weekly MAXIMUM, weekly MINIMUM, monthly MAXIMUM and monthly MINIMUM levels. This can help a lot when creating TrendLine or even plotting your FIBONNACI line, as there is no need to access Internet sites to analyze the MAXIMUM/MINIMUM levels. In graphical analysis, it can assist in breaking HIGH/MIN levels, creating support and resistance breakOuts. There are "mark" functions on the in
FREE
Trend Rising SDEA MT4
Wan Mohd Safwan Bin Wan Daud
Trend Rising is a custom MT4 ( Metatrader 4 ) indicator, use best for scalping on TF M30 and below that analyzes the trend and momentum pattern using Bill William Indicators on multiple timeframes.  As the result, It identifies the beginning and the end of the trend that works for most currency pairs. The Trend Rising indicator is developed based on Accelerator Oscillator and Awesome Indicator.     Key Features Identify the beginning and the end of the trend as display with colors.  Identify eas
FREE
Central Pivot Tool
Conor Stephenson
5 (8)
Central Pivot Range levels are formed around a central pivot point. These levels in relation to the central pivot can be used to determine numerous market behaviours and possible outcomes. The distance away from the central pivot, and the price that new levels form in relation to previous day levels , can be used to determine following days trending direction and strength. Central Pivot Ranges can act as support and resistance, offer a guide where to put a stop loss and also give signals of pric
FREE
Buyers of this product also purchase
Genesis Matrix Pro is a professional multi-timeframe trend detection indicator designed to help traders identify high-quality market alignment with clarity and structure. It combines 12 different technical indicators into one visual alignment matrix, allowing traders to quickly see when market conditions are bullish, bearish, or neutral. A signal is generated only when the selected strategies are aligned, helping reduce noise and improve decision-making. PLEASE CONTACT ME AFTER PURCHASE TO GET
Gann Made Easy
Oleg Rodin
4.83 (163)
Gann Made Easy is a professional and easy to use Forex trading system which is based on the best principles of trading using the theory of W.D. Gann. The indicator provides accurate BUY and SELL signals including Stop Loss and Take Profit levels. You can trade even on the go using PUSH notifications. PLEASE CONTACT ME AFTER PURCHASE TO GET TRADING  INSTRUCTIONS AND GREAT EXTRA INDICATORS   FOR FREE! Probably you already heard about the Gann trading methods before. Usually the Gann theory is a ve
The Propfolio Master Suite is the ultimate all-in-one analytical workstation for professional traders. Combining the power of the Beat The Market Maker (BTMM) methodology, Smart Money Concepts (SND/Liquidity), and Advanced Volume Profile, this suite replaces multiple different indicators with one optimized engine. Monitor up to 14 pairs simultaneously from a single chart, instantly identify market cycles, and seamlessly map institutional footprints with the click of a button. The Command Center
Scalper Inside PRO
Alexey Minkov
4.74 (69)
Scalper Inside PRO Scalper Inside PRO is an intraday trend and scalping indicator for MetaTrader 4 that uses an exclusive algorithm to quickly detect market direction and key target levels. It automatically calculates entry, exit and multiple profit targets, and shows detailed performance statistics so you can see how different instruments and strategies performed. This helps you choose the most suitable trading instruments for the current market conditions. Additionally, you can easily integrat
M1 Sniper
Oleg Rodin
5 (23)
M1 SNIPER is an easy to use trading indicator system. It is an arrow indicator which is designed for M1 time frame. The indicator can be used as a standalone system for scalping on M1 time frame and it can be used as a part of your existing trading system. Though this trading system was designed specifically for trading on M1, it still can be used with other time frames too. Originally I designed this method for trading XAUUSD and BTCUSD. But I find this method helpful in trading other markets a
PRO Renko System
Oleg Rodin
5 (30)
PRO Renko System is a highly accurate trading system specially designed for trading RENKO charts. The ARROWS and Trend Indicators DO NOT REPAINT! The system effectively neutralizes so called market noise giving you access to accurate reversal signals. The indicator is very easy to use and has only one parameter responsible for signal generation. You can easily adapt the tool to any trading instrument of your choice and the size of the renko bar. I am always ready to provide extra support to help
Auto Optimized Parabolic RSI: Advanced 3D Momentum Engine Most retail indicators fail because they rely on static inputs that break the moment market volatility shifts. Auto Optimized Parabolic RSI solves the problem of "indicator decay" by continuously recalculating its own mathematical edge, bringing institutional-grade quantitative adaptation directly to your MT5 terminal. The Core Advantage: Custom In-Memory 3D Optimization   Standard auto-optimizers often freeze the MT5 platform because the
NAM Order Blocks
NAM TECH GROUP, CORP.
3.67 (3)
MT4 Multi-timeframe Order Blocks detection indicator. Features - Fully customizable on chart control panel, provides complete interaction. - Hide and show control panel wherever you want. - Detect OBs on multiple timeframes. - Select OBs quantity to display. - Different OBs user interface. - Different filters on OBs. - OB proximity alert. - ADR High and Low lines. - Notification service (Screen alerts | Push notifications). Summary Order block is a market behavior that indicates order collection
Quants HL Break
Ferhat Mutlu
5 (2)
Advanced calculation made by pure price action to find LH and HL breakouts. It will give you a great reversal points in the market. LH and HL signals can used for the traingle breakouts as well. Once breakout happens its indicate strong reversal. Nice filter for Moving Averages. I highly suggest to use that with trend indicators. Can be used as an extra confirmation for support and resistance , supply demand indicators. The indicator is not repainting. Buffers :   SetIndexBuffer ( 0 ,UpBar);
Dynamic Forex28 Navigator
Bernhard Schweigert
4.43 (7)
Specials Discount now. The Next Generation Forex Trading Tool. Dynamic Forex28 Navigator is the evolution of our long-time, popular indicators, combining the power of three into one: Advanced Currency Strength28 Indicator (695 reviews) + Advanced Currency IMPULSE with ALERT (520 reviews) + CS28 Combo Signals (recent Bonus) Details about the indicator  https://www.mql5.com/en/blogs/post/758844 What Does The Next-Generation Strength Indicator Offer? Everything you loved about the originals, now
PZ Harmonacci Patterns
PZ TRADING SLU
3.17 (6)
Trade smarter, not harder: Empower your trading with Harmonacci Patterns This is arguably the most complete harmonic price formation auto-recognition indicator you can find for the MetaTrader Platform. It detects 19 different patterns, takes fibonacci projections as seriously as you do, displays the Potential Reversal Zone (PRZ) and finds suitable stop-loss and take-profit levels. [ Installation Guide | Update Guide | Troubleshooting | FAQ | All Products  ] It detects 19 different harmonic pric
RFI levels PRO
Roman Podpora
5 (1)
The indicator accurately shows the reversal points and price return zones where the   Major players . You see where new trends are forming and make decisions with maximum precision, maintaining control over every trade. VERSION MT5     -     Reveals its maximum potential when combined with the   TREND LINES PRO   indicator What the indicator shows: Reversal structures and reversal levels with activation at the beginning of a new trend. Display of   TAKE PROFIT   and   STOP LOSS   levels with mi
Trend Catcher ind
Ramil Minniakhmetov
TREND CATCHER INDICATOR Trend Catcher Indicator analyzes market price movements, using a combination of the author’s proprietary and customized adaptive trend-analysis indicators.  It identifies the true market direction by filtering out short-term noise and focusing on underlying momentum strength, volatility expansion, and price structure behavior.  It also uses a combination of smoothing and trend-filtering customized indicators such as moving averages, RSI, and volatility filters.   Real ope
Apollo SR Master is a Support/Resistance indicator with special features which make trading with Support/Resistance zones easier and more reliable. The indicator calculates Support/Resistance zones in real-time without any time lag by detecting local price tops and bottoms. Then to confirm the newly formed SR area, the indicator shows special signal which signalizes that the SR zone can be taken into consideration and used as an actual SELL or BUY signal. In this case the strength of the SR zone
Grabber System
Ihor Otkydach
5 (2)
Let me introduce you to an excellent technical indicator – Grabber, which works as a ready-to-use "All-Inclusive" trading strategy. Within a single code, it integrates powerful tools for technical market analysis, trading signals (arrows), alert functions, and push notifications. Every buyer of this indicator also receives the following for free: Grabber Utility for automatic management of open orders Step-by-step video guide: how to install, configure, and trade with the indicator Custom set fi
Day Trader Master is a complete trading system for traders who prefer intraday trading. The system consists of two indicators. The main indicator is the one which is represented by arrows of two colors for BUY and SELL signals. This is the indicator which you actually pay for. I provide the second indicator to my clients absolutely for free. This second indicator is actually a good trend filter indicator which works with any time frame. THE INDICATORS DO NOT REPAINT AND DO NOT LAG! The system is
GoldRush Trend Arrow Signal V1.6 The GoldRush Trend Arrow Signal indicator V1.6 continues to provide precise, real-time trend analysis tailored for high-speed, short-term scalpers in XAU/USD , but it now has additional features and improved efficiency and reliability. Built specifically for the 1-minute time frame, this tool displays directional arrows for clear entry points, allowing scalpers to navigate volatile market conditions with confidence. The indicator consists of PRIMARY and SECONDARY
Introduction to Fractal Pattern Scanner Fractal Indicator refers to the technical indicator that makes use of the fractal geometry found in the financial market. Fractal Pattern Scanner is the advanced Fractal Indicator that brings the latest trading technology after the extensive research and development work in the fractal geometry in the financial market. The most important feature in Fractal Pattern Scanner is the ability to measure the turning point probability as well as the trend probabi
Trading Special –40% OFF Best Solution for any Newbie or Expert Trader! This Indicator is a unique, high quality and affordable trading tool because we have incorporated a number of proprietary features and a new formula. With only ONE chart you can read Currency Strength for 28 Forex pairs! Imagine how your trading will improve because you are able to pinpoint the exact trigger point of a new trend or scalping opportunity? User manual: click here That's the first one, the original! Don't buy a
Advanced Supply Demand
Bernhard Schweigert
4.91 (300)
Trading Special – 40% OFF Best Solution for any Newbie or Expert Trader! This indicator is a unique, high quality and affordable trading tool because we have incorporated a number of proprietary features and a new formula. With this update, you will be able to show double timeframe zones. You will not only be able to show a higher TF but to show both, the chart TF, PLUS the higher TF: SHOWING NESTED ZONES. All Supply Demand traders will love it. :) Important Information Revealed Maximize the pot
Market Structure Patterns MT4
Samuel Manoel De Souza
5 (18)
Market Structure Patterns   is an indicator based on   smart money concepts   that displays   SMC/ICT   elements that can take your trading decisions to the next level. Take advantage of the   alerts ,   push notifications   and   email messages   to keep informed from when an element is formed on the chart, the price crosses a level and/or enters in a box/zone. Developers can access the values of the elements of the indicator using the   global variables  what allows the automation of trading d
Advanced UT BOT ALERTS for MT4 Professional Multi-Filter Trend Detection System | Enhanced UT BOT Engine We only provide high-quality indicators.  Advanced UT BOT is built for professional use, featuring a stable signal logic and secure calculation process that prevents any delays or false updates. It does not repaint, redraw, remove, or modify past signals in any way. All BUY and SELL signals are generated only after the candle has closed , ensuring consistent accuracy and reliability. There is
Contact me after purchase to get Bonus EA based on this indicator. The Self Optimizing Double MA Strategy is a professional-grade trading tool designed to eliminate parameter guesswork. Powered by a built-in auto-optimization engine, it continuously adapts to shifting market conditions by simulating thousands of parameter combinations in the background to maintain a statistical edge. Instead of relying on static, outdated settings, the indicator dynamically updates its own logic to find the mos
If you trade Forex, having detailed information about the currency strength and currency pairs correlation can take your trading to new heights. The correlation will help to cut your risk in half, and strength analysis will help to maximize the profits. This indicator provides a hybrid approach for selecting the most appropriate currency pairs using the strength analysis and currency pairs correlation. How to use the Currency Strength Analysis Suppose your trading strategy provides a buying opp
KURAMA GOLD SIGNAL PRO (MT4) — Complete XAUUSD Trading System with 7-Layer Filter, Auto TP/SL, and Quality Scoring NON-REPAINTING. NON-REDRAWING. NON-LAGGING. Every signal is permanent. What you see is what you get. BONUS: Buy the lifetime license and receive AI Zone Radar ($59 value) + full PDF manual FREE. Message me after purchase. AI Zone Radar: https://www.mql5.com/en/market/product/175834 TRUSTED BY TRADERS: Already used by an active community of Gold traders. Praised for accuracy and
The " Dynamic Scalper System " indicator is designed for the scalping method of trading within trend waves. Tested on major currency pairs and gold, compatibility with other trading instruments is possible. Provides signals for short-term opening of positions along the trend with additional price movement support. The principle of the indicator. Large arrows determine the trend direction. An algorithm for generating signals for scalping in the form of small arrows operates within trend waves.
Master head and shoulders patterns for better trading decisions A head and shoulders pattern is a chart formation that resembles a baseline with three peaks, the outside two are close in height and the middle is highest. It predicts a bullish-to-bearish trend reversal and is believed to be one of the most reliable trend reversal patterns. It is one of several top patterns that signal, with varying degrees of accuracy, that a trend is nearing its end. [ Installation Guide | Update Guide | Trouble
PZ Double Top Bottom
PZ TRADING SLU
5 (1)
Trade double tops and bottoms effectively The PZ Double Top/Bottom Indicator is a technical analysis tool that helps traders identify potential price reversal patterns in the market. These patterns, known as double tops and bottoms, are characterized by two consecutive peaks or valleys in the price of an asset. Double tops and bottoms are often seen as potential reversal patterns because they can signal a change in the direction of the current trend. [ Installation Guide | Update Guide | Troubl
Apex Break PRO MT4
Kestutis Balciunas
Apex Break PRO is a non-repainting pivot trendline breakout indicator for MetaTrader 4. It detects pivot highs and pivot lows, draws dynamic sloped trendlines between consecutive pivots, and generates buy and sell signals when price breaks through those trendlines on a confirmed bar close. Every signal is filtered through up to four independent confluence layers — EMA trend, RSI boundaries, volume spike detection, and ADX trend strength — and rated with a star system so traders can immediately s
Special offer : ALL TOOLS , just $35 each! New tools   will be   $30   for the   first week   or the   first 3 purchases !  Trading Tools Channel on MQL5 : Join my MQL5 channel to update the latest news from me The Three Bar Reversal Pattern Indicator offers a powerful tool for traders, automatically identifying and highlighting three-bar reversal patterns directly on the price chart. This indicator serves as a valuable resource for detecting potential trend reversals and enables users to refin
More from author
SnR tool
Syahirul Nizzam Bin Haron
5 (1)
This is a SnR tool. It is built based on the body candle. It is a multi timeframe indicator. There is a powerful scalabar for vertical line slides to limit the candle bars. Color for each line can also be changed. It can detect: 1. Support && Resistance 2. Support become Resistance && vice versa 3.Support become Resistance become Support && vice versa It also can be used for trading tools and studies on SnR *New Version avaiable
MACD The Factor
Syahirul Nizzam Bin Haron
MACD FACTOR! Macd factor is amazing!...it draws multi lines of its own factor of macd(12,26,9) on the chart! not on separate windows as normally macd (12,26,9) it is.                     It is not 12,26 of EMA's on that chart ... it is now really different! ... It has 6 difference lines + 1 line of it own factor line .. You can examine every each of the lines cross over of each other at the specific time and price while at the same time, the main line of macd (12,26,9) cross over the signal l
Filter:
Wan Ping Fei
1690
Wan Ping Fei 2020.12.18 04:18 
 

User didn't leave any comment to the rating

Reply to review